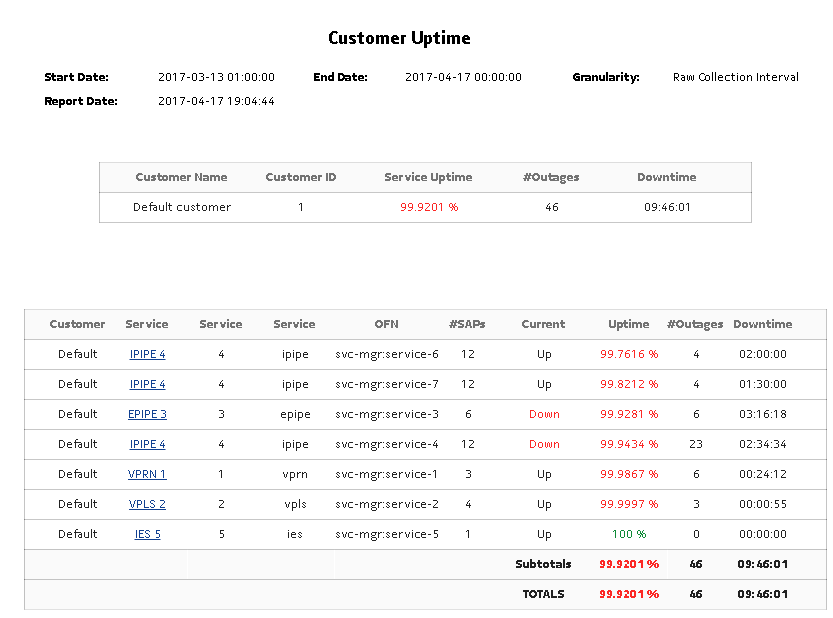
Customer Uptime Summary report
Customer Uptime Summary report overview
The Customer Uptime Summary report shows outage information for a customer. The default display is a table showing outage information.
Totals are calculated as follows:
Subtotals are calculated as follows:
Note: Nokia recommends that large customers do not use the Show report output on one page option.
Note: The report loads slowly when there are more than 200,000 state change events.
Note: Report launching time will be non-linear with respect to huge data.
Use cases
SLA monitoring—Use the report to examine outage patterns, to ensure SLAs are met.
Prerequisites
To create Customer Uptime Summary reports, enable the event logging using NSP Classic management for the following object types in the Timeline Settings in the NSP:
Report characteristics
The following table lists the principal report characteristics.
Table 14-6: Customer Uptime Summary report characteristics
|
Characteristic |
Value | |||||
|---|---|---|---|---|---|---|
|
Data type |
||||||
|
Source database |
Auxiliary database | |||||
|
NE types supported |
all 7705 SAR variants all 7750 SR and VSR variants all 7450 ESS variants all 7950 XRS variants all 7210 SAS variants all 7250 IXR variants OS 6860, OS 6450, OS 6900 | |||||
|
Service types supported |
VPRN, VPLS, Epipe, Ipipe, Cpipe | |||||
|
Report inputs |
Prompt |
Notes | ||||
|
End date |
Calendar date or relative date (for example, two days ago) and time | |||||
|
Granularity |
Aggregation types: | |||||
|
Report range |
Length of time to be reported, in minutes (minutes, min), hours (hours, h), days (days, d), or months (months, m) | |||||
|
Customer Name (or Name Pattern) |
Search using partial names or wildcard (%). | |||||
|
Customer Name |
Search using partial names or wildcard (%). Select individual items or click Select All. | |||||
|
Exclude SAP Downtime |
When enabled, all SAP-related downtime is zero. The structure of the report and entries in the tables across the Uptime reports do not change. SAP outages are shown, but their downtime is zero (duration is not affected). | |||||
|
Exclude Services |
— | |||||
|
Exclude SAP |
— | |||||
|
Uptime Threshold % |
Identify the threshold percentage | |||||
|
Logo Resource ID |
The logo to add to the report. Enter the Resource ID of the logo image in the Images folder. The default is the Nokia logo. To create the report without a logo, leave the Logo Resource ID field blank. | |||||
|
Logo Position |
Choose Left, Middle, or Right. The logo appears on the left on the first page of the report if you choose Left or Middle. | |||||
|
Show report output on one page |
Select the check box to enable pagination. Note: Using the Show report output on one page option when creating reports as drill-downs may impact report rendering time. Nokia recommends disabling the Show report output on one page option when creating reports. | |||||
|
Drill-down support |
Yes—Open the Service Uptime report for the selected service. | |||||
