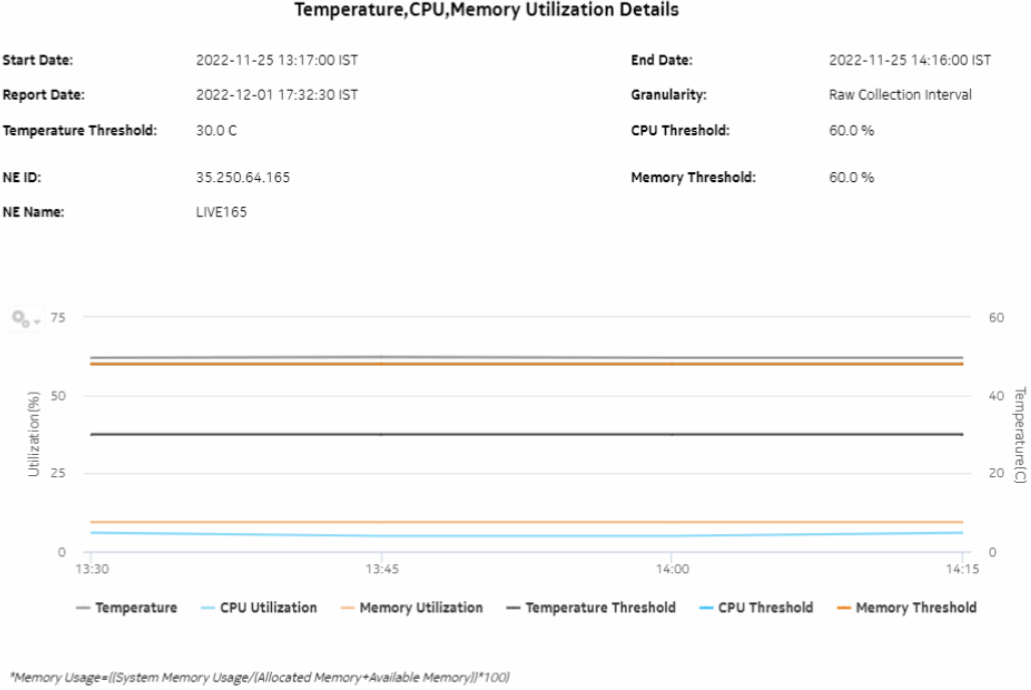
Temperature, CPU, Memory Utilization Details report
Temperature, CPU, Memory Utilization Details report overview
The Temperature, CPU, Memory Utilization Details report shows the temperature, memory and CPU usage details for selected NEs and sites. The default display is a graph displaying usage over time relative to user-defined thresholds.
The following temperatures can be reported by the NE when no temperature sensor is available. These temperatures are invalid and will not be displayed in the report.
Note: For 7705 SAR-Hm and 7705 SAR-Hmc NEs, negative temperatures can be valid. Temperatures reported by 7705 SAR-Hm and 7705 SAR-Hmc NEs are always displayed.
Limitations
Minimum and maximum throughput aggregation cannot be compared with the minimum and maximum throughput values generated from raw granularity.
Prerequisites
The following table describes the aggregation rules that must be enabled and the accounting policies that must be configured for the NEs on which statistics are to be collected; see the NSP NFM-P Statistics Management Guide for information about configuring an accounting policy. To view the report for granularities other than raw data, the aggregation rules must be enabled; see How do I configure analytics aggregation?.
See information in the NSP NFM-P Statistics Management Guide about creating or modifying a specific MIB statistics policy using a bottom-up method.
Table 14-41: Temperature, CPU, Memory Utilization Details Summary report prerequisites
|
Aggregator name |
Monitored object class |
Statistics class |
Statistics collection |
Details (MIB name) |
NE types |
|---|---|---|---|---|---|
|
System CPU Usage Stats Aggregator |
equipment.SystemStatsHolder |
equipment.SystemCpuStats |
Performance statistics |
TIMETRA-SYSTEM-MIB.sgiCpuUsage |
7210 SAS 7250 IXR 7705 SAR 7705 SAR-H 7705 SAR Hm 7750 SR |
|
System Memory Stats Aggregator |
equipment.SystemStatsHolder |
equipment.System MemoryStats |
Performance statistics |
TIMETRA-SYSTEM-MIB.sgiMemoryUsed |
7210 SAS 7250 IXR 7705 SAR 7705 SAR-H 7705 SAR Hm 7750 SR |
|
Allocated Memory Stats Aggregator |
equipment.SystemStatsHolder |
equipment.AllocatedMemoryStats |
Performance statistics |
TIMETRA-SYSTEM-MIB.sgiMemoryPoolAllocate |
7210 SAS 7250 IXR 7705 SAR 7705 SAR-H 7705 SAR Hm 7750 SR |
|
Available Memory Stats Aggregator |
equipment.SystemStatsHolder |
equipment.AvailableMemoryStats |
Performance statistics |
TIMETRA-SYSTEM-MIB.sgiMemoryAvailable |
7210 SAS 7250 IXR 7705 SAR 7705 SAR Hm 7750 SR Note: 7705 SAR-H is not supported. Memory Usage is as follows: Memory Usage =(systemMemory UsageInKb/(allocatedMemoryInKb+availableMemoryInKb)*100 For SAR-H NEs, the available memory statistics are not supported; the calculation is as follows: Memory Usage =(systemMemory UsageInKb/(allocatedMemoryInKb)*100 |
|
Hardware Temperature Stats Aggregator |
equipment.BaseCard equipment.CardSlot equipment.CCM equipment.FanTray equipment.ControlProcessor equipment.DaughterCard equipment.MCCard equipment.PowerSupplyTray equipment.Shelf equipment.SwitchFabricProcessor equipment.XioCard |
equipment.HardwareTemperature |
Performance statistics |
TIMETRA-CHASSIS-MIB.tmnxHwEntry |
7210 SAS 7250 IXR 7705 SAR 7705 SAR-H 7705 SAR Hm 7750-SR Omnisystem NEs |
|
Card Health Stats Aggregator |
equipment.CardSlot |
equipment.CardHealth Stats |
Performance statistics |
ALCATEL-IND1-HEALTH-MIB.healthModuleEntry |
7705 SAR-H Omnisystem NEs and their variants |
Report characteristics
The following table lists the principal report characteristics.
