Bandwidth Throughput with Forecast report

Bandwidth Throughput with Forecast report overview

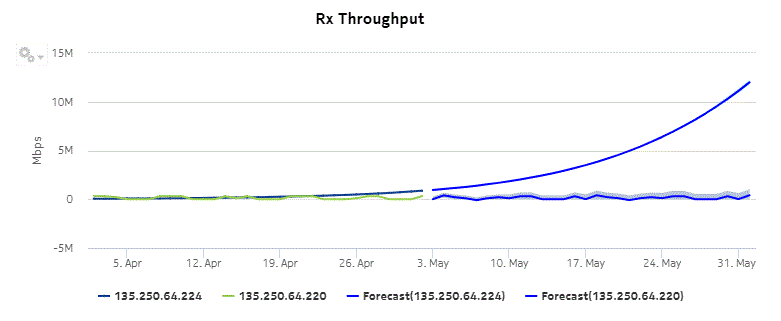
The Bandwidth Throughput with Forecast report shows bandwidth utilization by specified radio or Ethernet ports configured as a part of the link across the Wavence NEs with forecasting data. The default display is a set of time series graphs for Rx and Tx Throughput.

Note: The report generation takes approximately 49 to 50 s to complete.

Use cases

Capacity planning—Use the report to examine traffic usage and patterns based on the radio or Ethernet traffic in a network and to plan for capacity requirements.

Limitations

Minimum and maximum throughput aggregation cannot be compared with the minimum and maximum throughput values generated from raw granularity.

Prerequisites

The session time zone must match the aggregation time zone. When these two settings are different, the report does not run correctly and the system returns an error. See section How do I configure the Analytics session time zone? for more information about configuring the session time zone.

The following table describes the aggregation rules that must be enabled and the accounting policies that must be configured for the NEs on which statistics are to be collected; see the NSP NFM-P Statistics Management Guide for information about configuring an accounting policy. To view the report for granularities other than raw data, the aggregation rules must be enabled; see How do I configure analytics aggregation?.

Table 15-14: Bandwidth Throughput with Forecast report prerequisites

Aggregator name

Monitored object class

Statistics class

Statistics collection

MIB

NE types

Wavence Ingress Stats Bandwidth Aggregator

Wavence Egress Stats Bandwidth Aggregator

Port

LAG

Ethernet

Ethernet Aggregate Rx Stats (15Min)

Ethernet Aggregate Tx Stats (15Min)

ethAggrMaintRxEntry

ethAggrMaintTxEntry

Wavence MSS-1, Wavence MSS-4, Wavence MSS-8, Wavence MSS-O, Wavence MSS-E, Wavence MSS-HE, Wavence MSS-XE, Wavence MSS-1c, Wavence SA, Wavence UBT-SA, Wavence UBT-I, Wavence UBT-T XP, 9500 MPR-A Chassis 4, 9500 MPR-A Chassis 8, 9500 MPR-E Chassis 1, 9500 MPR-E Chassis 4, 9500 MPR-E Chassis 8, 9500 MSS-1c, 9500 MSS-O ANSI, 9500 MSS-O ETSI, 9500 SA

Note: The 7705 SAR-H is not supported.

Report characteristics

The following table lists the principal report characteristics.
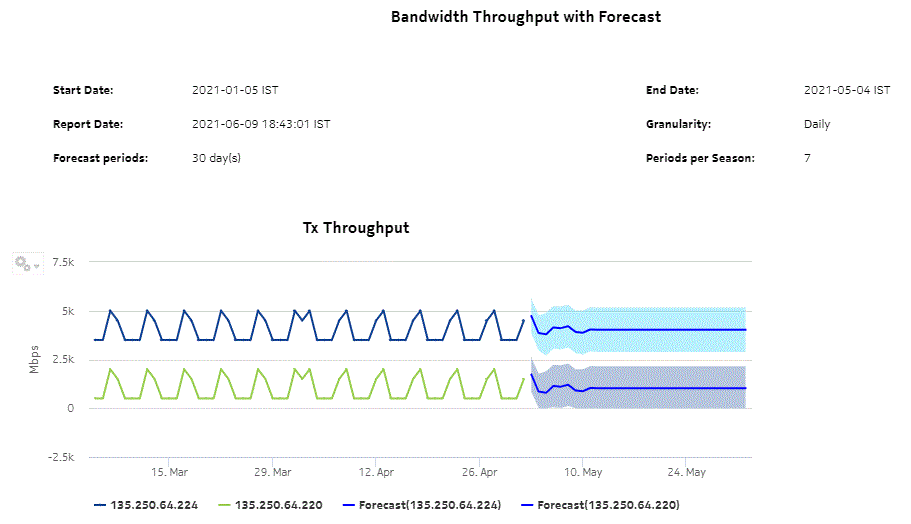
Table 15-15: Bandwidth Throughput with Forecast report characteristics

Characteristic

Value

Data type

Statistics

NE types supported

Wavence MSS-1, Wavence MSS-4, Wavence MSS-8, Wavence MSS-O, Wavence MSS-E, Wavence MSS-HE, Wavence MSS-XE, Wavence MSS-1c, Wavence SA, Wavence UBT-SA, Wavence UBT-I, Wavence UBT-T XP, 9500 MPR-A Chassis 1, 9500 MPR-A Chassis 4, 9500 MPR-A Chassis 8, 9500 MPR-E Chassis 1, 9500 MPR-E Chassis 4, 9500 MPR-E Chassis 8, 9500 MSS-1c, 9500 MSS-O ANSI, 9500 MSS-O ETSI, 9500 SA

Report inputs

Prompt

Notes

End date

Calendar date or relative date (for example, two days ago) and time

Granularity

Aggregation types:

  • Daily

  • Monthly

Report Range

Length of time to be reported, in minutes (minutes, min), hours (hours, h), days (days, d), or months (months, m)

Name or name pattern for links

Enter the name pattern of the link

Links

Select individual link

Tx Threshold

Specify value (Mbps)

Rx Threshold

Forecast periods

The range for the forecast to work. The value is based on the granularity selected. For example, a period of 30 would mean 30 days if the granularity is daily, and 30 months if the granularity is monthly.

Periods per Season

The frequency at which there is a similarity in data. For example, the frequency at which a plot has similar values. The behavior is the same as the forecast period. For example, a period of 7 would mean 7 days if the granularity is daily, and 7 months if the granularity is monthly.

Logo Resource ID

The logo to add to the report. Enter the Resource ID of the logo image in the Images folder. The default is the Nokia logo. To create the report without a logo, leave the Logo Resource ID field blank.

Logo Position

Choose Left, Middle, or Right. The logo appears on the left on the first page of the report if you choose Left or Middle.

Show report output on one page

Select the check box to enable pagination.

Note: Using the Show report output on one page option when creating reports as drill-downs may impact report rendering time. Nokia recommends disabling the Show report output on one page option when creating reports.

Apply

Applies all the parameters and prepares the report based on the parameters entered

Reset

Resets all the parameters to default value

Drill-down support

No

Example

The following figures show a report example.

Figure 15-18: Bandwidth Throughput with Forecast report—Tx Throughput
Bandwidth Throughput with Forecast report—Tx Throughput
Figure 15-19: Bandwidth Throughput with Forecast report—Rx Throughput
Bandwidth Throughput with Forecast report—Rx Throughput