Port Cross-Connect
PXC terminology
The following describes Port Cross-Connect (PXC) terminology:
- PXC
PXC is a software concept representing a pair of logical ports interconnecting egress and ingress forwarding paths within the same forwarding complex.
The physical underpinning of a PXC can be either of the following:
-
a faceplate (physical) port in a loopback mode
The PXC is referred to as a port-based PXC. Multiple PXCs can be created per a faceplate port.
-
a loopback configuration in the MAC chip
The PXC is referred to as an internal or MAC-based PXC. Multiple PXCs can be created per MAC loopback.
-
-
PXC sub-port
PXC sub-port is a logical port that is created under the PXC. Two interconnected PXC sub-ports are created per PXC. This is further described in Port-based PXC.
-
Forwarding Complex (FC)
FC is a chipset connected to a set of faceplate ports that processes traffic in the ingress direction (the ingress path) and the egress direction (the egress path). A line card can contain multiple FCs for increased throughput, while the inverse is not true, a single FC cannot be distributed over multiple line cards.
The terms cross-connect and loopback can be used interchangeably.
Overview
- 7705 SAR-1
PXC is supported on 10G interfaces only.
This section describes the PXC feature implementation. PXC is a software concept representing a pair of logical ports interconnecting egress and ingress forwarding paths within the same forwarding complex (FC). In cross-connect functionality, an egress forwarding path is looped back to the ingress forwarding path on the same forwarding complex instead of leading out of the system.
The cross-connect is modeled in the system and in the CLI as a port, appropriately naming the feature Port Cross-Connect (PXC) software concept representing a pair of logical ports interconnecting egress and ingress forwarding paths within the same forwarding complex.
Conceptually, PXC functionality is similar to the functionality provided by two externally interconnected faceplate ports where traffic exits the system through one port (the egress path) and is immediately looped back into another port (the ingress path) through a cable.
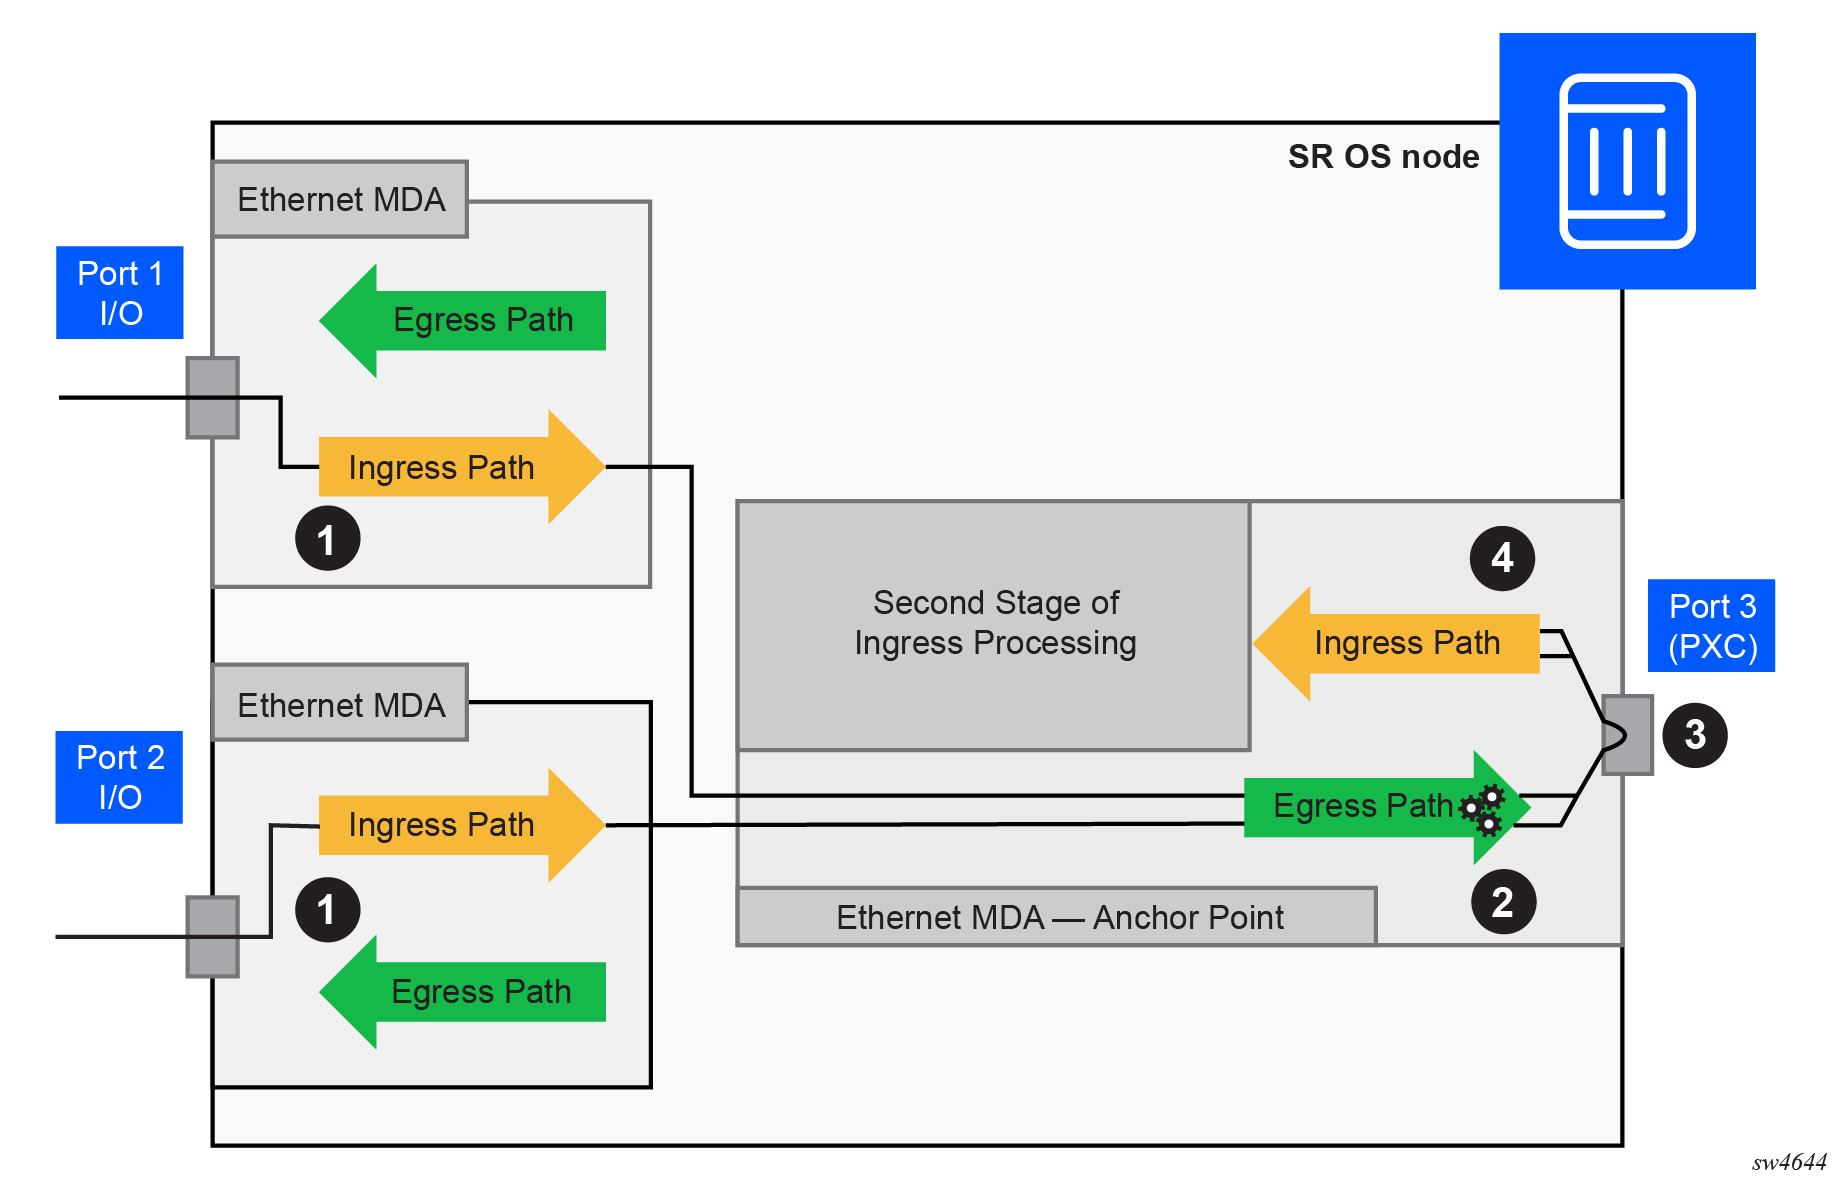
Traffic preprocessing using PXC shows the traffic flow from the first to the second stage through a cross-connect in a system with PXC:
-
Traffic entering a node through a faceplate port is processed by the local ingress forwarding path (1) on the line cards 1 and 2. Traffic is then directed toward the PXC (3) on the line card 3.
-
The PXC (3) loops the traffic from the local egress path (2) into the local ingress forwarding path (4) where it is further processed.
Port-based PXC
The concept of a port-based PXC (a PXC based on a faceplate port in loopback mode) is shown in Port-based PXC. This PXC does not require an optical transceiver.
Place the faceplate port into a cross-connect mode (MD-CLI)
[ex:/configure]
A:admin@node-2# info
   port-xc {
        pxc 1 {
            admin-state enable
            port-id 1/1/c1/1
        }
    }
Place the faceplate port into a cross-connect mode (classic CLI)
A:node-2>config>port-xc# info
----------------------------------------------
        pxc 1 create
            port 1/1/c1/1
            no shutdown
        exit
    exit
----------------------------------------------
Multiple PXCs on the same underlying cross-connect configuration (MD-CLI)
[ex:/configure]
A:admin@node-2# info
    port-xc {
        pxc 1 {
            admin-state enable
            port-id 1/1/c1/1
        }
        pxc 2 {
            admin-state enable
            port-id 1/1/c2/1
        }
        pxc 3 {
            admin-state enable
            port-id 1/1/c3/1
        }
    }
Multiple PXCs on the same underlying cross-connect configuration (classic CLI)
A:node-2>config>port-xc# info
----------------------------------------------
        pxc 1 create
            port 1/1/c1/1
            no shutdown
        exit
        pxc 2 create
            shutdown
            port 1/1/c2/1
        exit
        pxc 3 create
            shutdown
            port 1/1/c3/1
        exit
    exit
A faceplate port that has been placed in the loopback mode for PXC use, supports only hybrid mode of operation and dot1q encapsulation. The recommendation is that the MTU value be configured to the maximum value. dot1x tunneling is enabled and cannot be changed.
The pre-set dot1q Ethernet encapsulation on the faceplate port is irrelevant from the user’s perspective and there is no need to change it. The relevant encapsulation carrying service tags defined on PXC subports and that encapsulation is configurable. For more information, see PXC sub-ports.
The following guidelines apply to a PXC configuration based on faceplate ports:
-
Only unused faceplate ports (not associated with an interface or SAP) can be referenced within a PXC ID configuration.
-
When the faceplate port is allocated to a PXC, it cannot be used outside of the PXC context. For example, an IP interface cannot use the faceplate port directly, or a SAP under a such port cannot be associated with an Epipe or VPLS service.
PXC sub-ports
Two cross-connected external ports versus a single cross-connect displays the benefit of PXC sub-ports on top of the cross-connect, which is analogous to two distinct faceplate ports that are connected by a fiber cable.
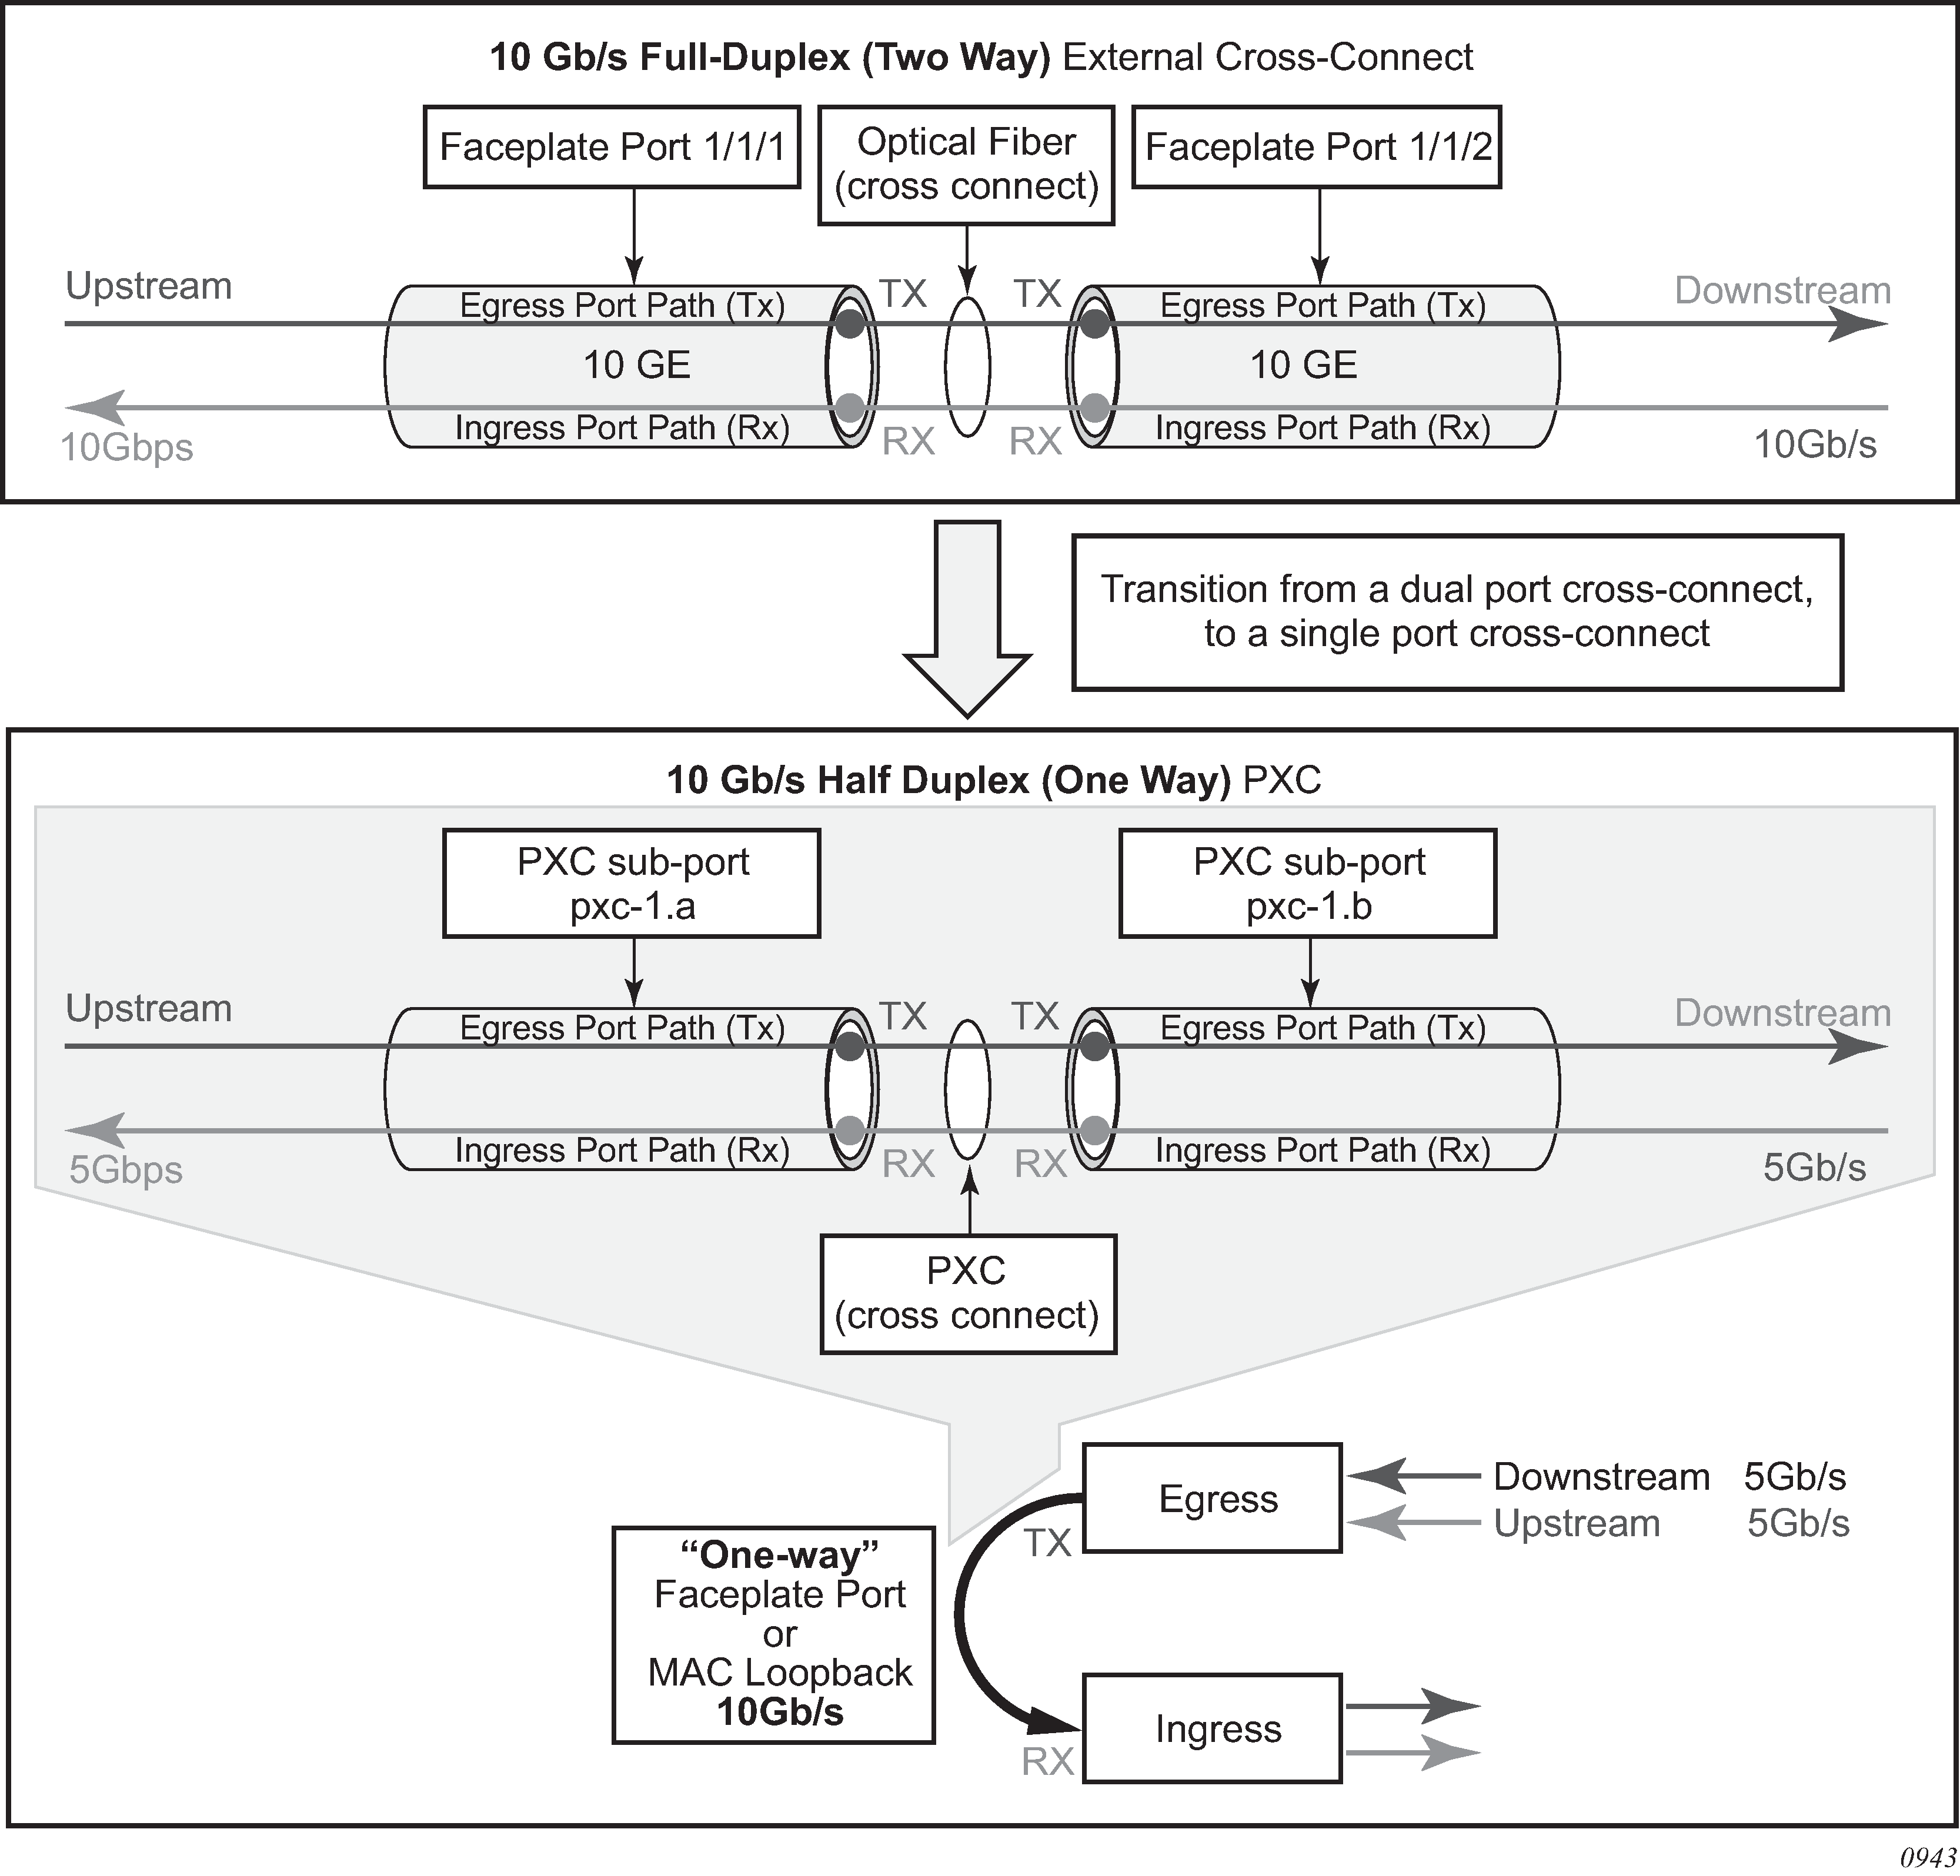
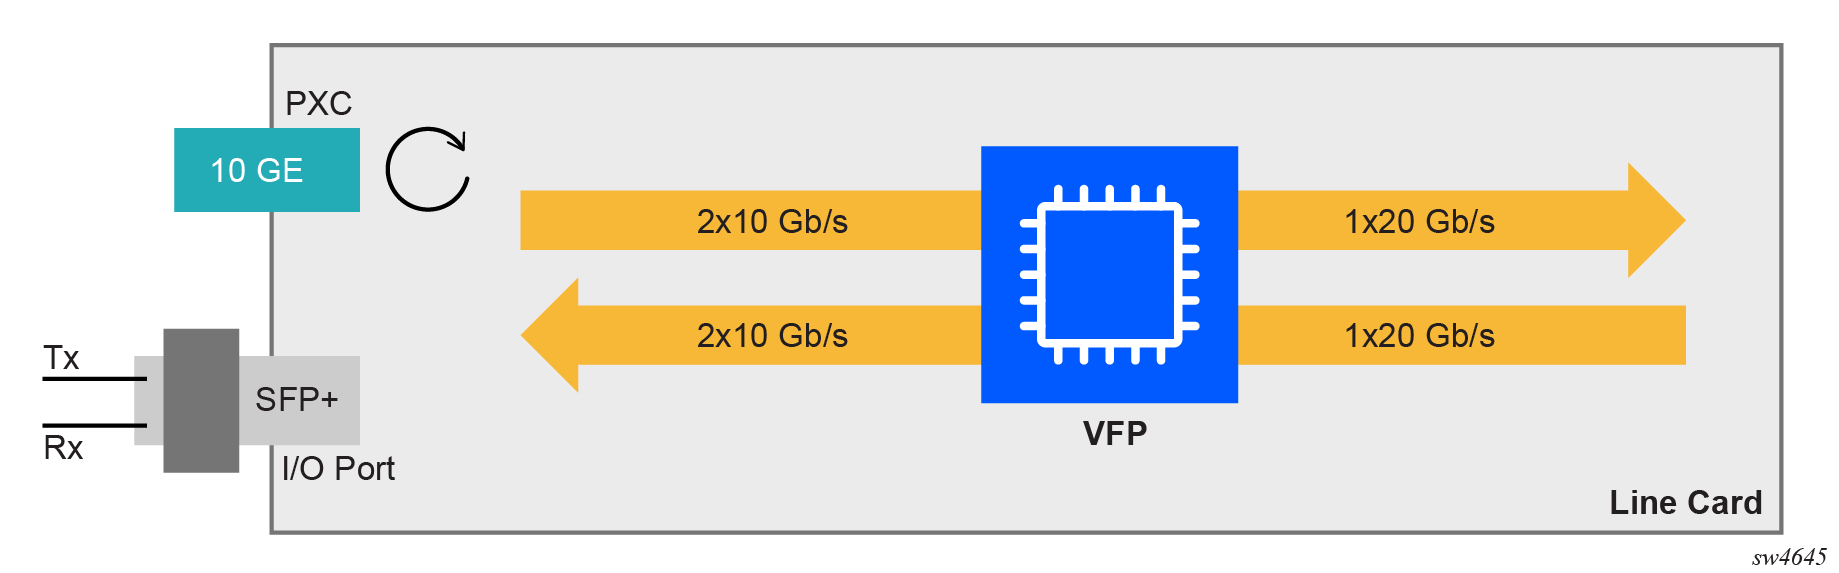
Bidirectional connectivity provided by PXC requires two sub-ports, one in each direction. The router uses these PXC sub-ports as logical configurations to transmit traffic in both directions over a half-duplex (one-way) cross-connect created in the system. As a result, the total bandwidth capacity supported by the mated PXC sub-ports is limited by the bandwidth capacity of the underlying cross-connect (a single faceplate port or a MAC loopback).
For example, if a 10 Gb/s faceplate port is allocated for PXC functions, the sum of downstream and upstream traffic on the mated PXC sub-ports is always less than or equal to 10 Gb/s. The bandwidth distribution is flexible; it can be symmetric (5 Gb/s downstream and 5 Gb/s upstream), or asymmetric (9 Gb/s downstream and 1 Gb/s upstream, 8 Gb/s downstream and 2 Gb/s upstream, or any other downstream and upstream distribution combination). Therefore, the faceplate port speed from the PXC perspective is half-duplex.
Similar logic can be followed for MAC-based PXC, with two key differences:
-
The bandwidth (for example, 100 Gb/s) is configured under the MAC loopback and there is no need to allocate an additional faceplate port.
-
PXC traffic is not reserved as part of the faceplate port bandwidth, as it is in the port-based PXC where a faceplate port is reserved only for PXC traffic. Instead, the PXC traffic is added to the traffic from the faceplate ports even in situations where all faceplate ports are 100% used, potentially oversubscribing the forwarding complex.
After the faceplate port or the port based on MAC loopback is associated with a PXC ID, a pair of mated PXC sub-ports is automatically created in the classic CLI by the SR OS.
In MD-CLI, the user must manually create the sub-ports.
The sub-ports must be explicitly enabled. Use the following commands to enable the subports:
-
MD-CLI
admin-state enable -
classic CLI
no shutdown
The two PXC sub-ports are distinguishable by ‟.a” and ‟.b” suffixes. They transmit traffic toward each other, simulating two ports that are interconnected.
Although, the most PXC sub-ports command options are configurable, specific command options are fixed and cannot be changed. For example, PXC sub-ports are created in a hybrid mode and this cannot be modified.
Each PXC sub-port is internally (within the system) represented by an internal four-byte VLAN tag which is not visible to the user. Therefore, traffic carried over the PXC contains four extra bytes, which must be accounted for in the QoS configured on PXC sub-ports.
MD-CLI
[ex:/configure port-xc]
A:admin@node-2# info
    pxc 1 {
        admin-state enable
        port-id 1/1/c1/1
    }
    pxc 2 {
        admin-state enable
        port-id 1/1/c2/1
    }
classic CLI
A:node-2>config>port-xc# info
----------------------------------------------
        pxc 1 create
            port 1/1/c1/1
            no shutdown
        exit
        pxc 2 create
            port 1/1/c2/1
            no shutdown
        exit
----------------------------------------------
The preceding configuration automatically creates the following PXC sub-ports. In the following example, the following ports are cross-connected:
- pxc-1.a is cross-connected with pxc-1.b
- pxc-1.b is cross-connected with pxc-1.a
- pxc-2.a is cross-connected with pxc-2.b
- pxc-2.b is cross-connected with pxc-2.a
MD-CLI
[ex:/configure]
A:admin@node-2# info
...
    port pxc-1.a {
    }
    port pxc-1.b {
    }
    port pxc-2.a {
    }
    port pxc-2.b {
    }
classic CLI
A:node-2# admin display-config
...
#--------------------------------------------------
echo "Port Configuration"
#--------------------------------------------------
    port pxc-1.a
        exit
    exit
    port pxc-1.b
        exit
    exit
    port pxc-2.a
        exit
    exit
    port pxc-2.b
        exit
    exit
Bandwidth considerations and QoS
Bandwidth consumed by PXCs based on faceplate ports correlates with the faceplate’s port capacity. Because each PXC allocates a faceplate port for exclusive use, the PXC capacity cannot exceed the card capacity that is already allocated for the faceplate ports. In other words, a PXC based on a faceplate port does not add any additional bandwidth to the forwarding complex.
The bandwidth management in the PXC environment is performed through existing QoS mechanisms.
QoS
There are interactions between the PXC traffic and non-PXC traffic in the datapath. Interaction between PXC and non-PXC traffic shows this interaction as the traffic enters the egress forwarding path from the fabric tap (T). This traffic consists of non-PXC traffic (1) destined for the egress faceplate ports and PXC traffic (2) that is sent (cross-connected) to the ingress forwarding path (P) within the same forwarding complex. Regular ingress traffic from the faceplate ports (3) is added to the stream and merged into the same ingress forwarding path as the PXC traffic.
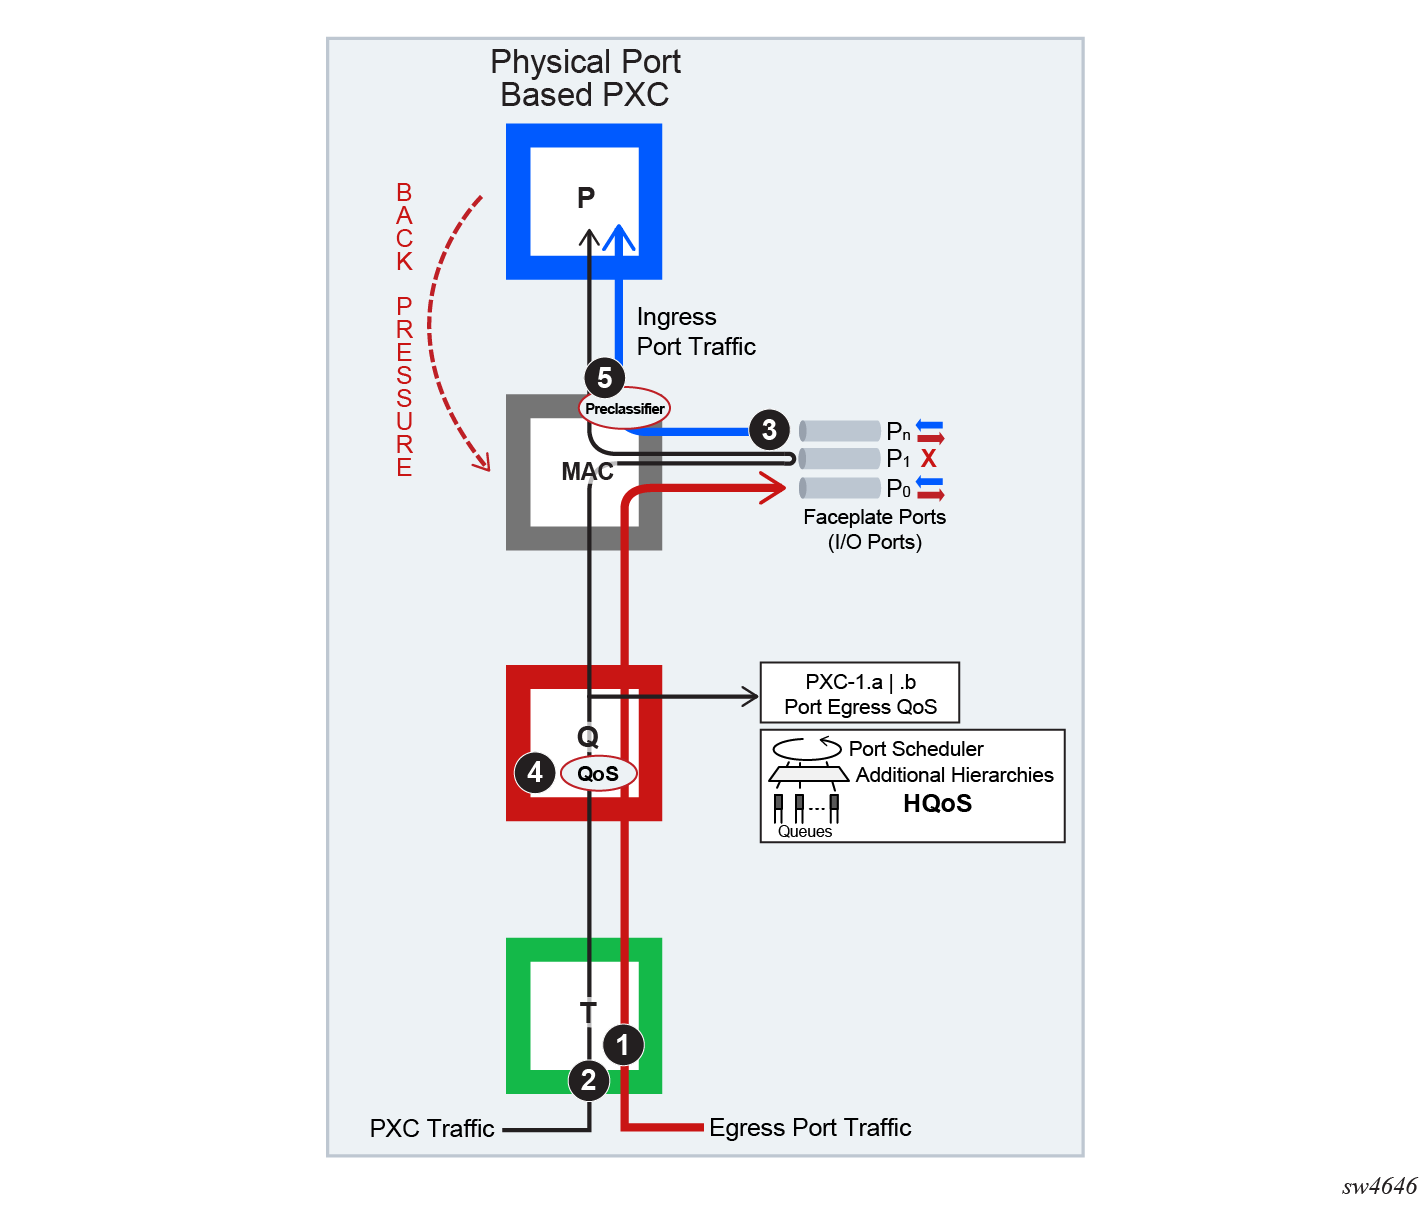
The physical port-based PXC configuration Interaction between PXC and non-PXC traffic, shows interaction of the three traffic streams on the forwarding complex with a PXC based on the faceplate ports. To manage congestion, the user-configured input can be exserted in points 4 and 5.
Point 4 represents regular egress QoS in the traffic manager (Q) applied to an egress port. In this setup, the faceplate port P1 is reserved for PXC traffic which is represented by the two sub ports (PXC sub-ports pxc-id.a and pxc-id.b). Egress QoS is applied to each PXC subport.
Point 5 represents a pre-classifier in the MAC chip that manages ingress bandwidth if transient bursts occur in the ingress datapath (P), which then exserts back pressure toward the MAC. During congestion, the pre-classifier arbitrates between regular ingress traffic from the faceplate ports and the PXC traffic.
QoS on PXC sub-ports
The network user must understand the concept of the PXC sub-ports described in Port-based PXC for correct egress QoS configuration in the traffic manager (Q).
The following summarizes key points for the PXC sub ports:
-
Each subport (pxc-id.a and pxc-id.b) in a PXC is, in the context of egress QoS, treated as a separate port with its own port scheduler policy.
Both sub-ports are created on top of the same loopback configuration (port- based or MAC-based). For faceplate ports, this bandwidth is determined by the port capabilities (for example, a 100 Gb\s port versus a 400 Gb\s port) and for the MAC loopback, this bandwidth is configurable.
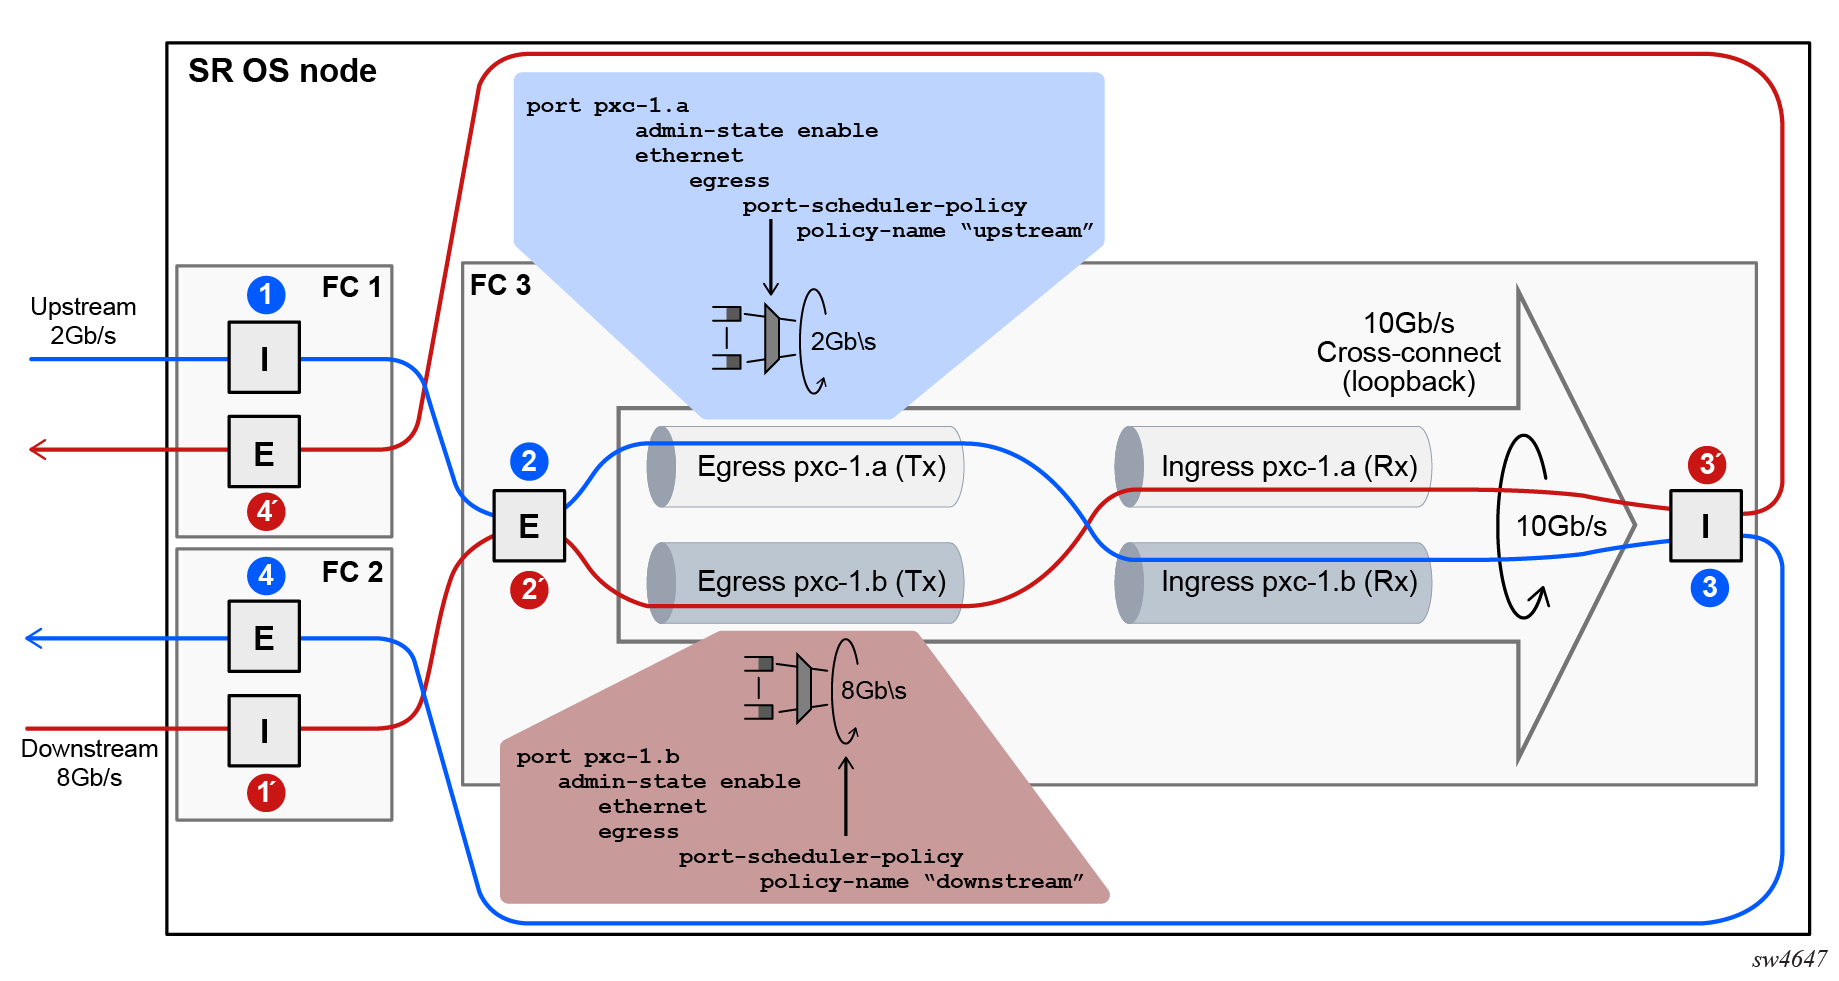
Funneling traffic from two PXC sub-ports through the same loopback requires separate bandwidth management for each PXC sub-ports. The sum of the configured bandwidth caps for the Egress Port Scheduler (EPS) under the two PXC sub-ports should not exceed the bandwidth capacity of the underlying loopback. Bandwidth management on PXC sub-ports shows an example of this concept where each PXC sub-port is divided into two parts, the Tx or the egress part and the Rx or the ingress part. Bandwidth management on PXC sub-ports shows bidirectional traffic entering and exiting the SR node at forwarding complex 1 and 2, with PXC processing on forwarding complex 3. In the upstream direction, traffic enters SR node at the ingress forwarding complex 1 at point (1) and is redirected to the PXC for additional processing, points (2) and (3). From there, traffic is sent by the egress forwarding complex 2 out of the node, at point (4).
Similar logic can be followed in the downstream (opposite) direction where the traffic enters the ingress forwarding complex 2 at point (1’), it is redirected to the same PXC on forwarding complex 3 and exists the node on forwarding complex 1 at point (4’).
In this example with the maximum loopback bandwidth of 10 Gb\s, port-schedulers under the PXC egress subports must be configured to support their respective anticipated bandwidth in each direction (2 Gb\s upstream and 8 Gb\s downstream), for the total bandwidth of 10 Gb\s supported on the cross-connect.
Traffic traversing PXC contains an overhead of 4 bytes per packet that are attributed to the internal VLAN tag used for PXC sub-port identification within the SR node. However, these 4 bytes are not accounted for in the configured QoS rates. Therefore, the user should take this into consideration when configuring rates on QoS objects under PXC ports.
Queue allocation on PXC sub-ports
PXC sub-ports are auto-configured in hybrid mode and this cannot be changed by configuration. The PXC sub-ports each have a set of queues on the network egress side and a set of queues on the access egress and ingress (per SAP or ESM subscriber). Queues on network ingress are shared per FP or per MDA, as they are on non-PXC ports in hybrid mode.
Queue groups are allocated per PXC sub-ports.
Pool allocations on PXC ports
Queue buffers are created in buffer pools and are used for traffic buffering when queues are congested. Buffer pools are allocated per forwarding complex or per cross-connect.
Each cross-connect has three associated buffer pools:
access ingress
access egress
network egress
The network ingress pool is shared between all faceplate ports on a forwarding complex. The size of the buffer pools is automatically determined by the system based on the forwarding complex type and cross-connect configuration.
Operational states
A port under a PXC (for example, port 1/1/c1/1 ), the PXC itself (PXC ID represented by the cross-connect port configuration port-xc pxc 1), and PXC sub-ports (for example, port pxc-1.a and pxc-1.b) all have administrative and operational states.
For a port-based PXC, when all layers of a PXC (PXC port, PXC ID, and PXC sub-ports) are operationally up, the faceplate port status LED on the faceplate blinks amber. The port activity LED lights green in the presence of traffic on PXC ports and turns off in the absence of traffic on PXC ports. The presence of the optical transceiver on the PXC has no effect on its operational state. Traffic cannot be sent out through the transceiver or be received through the transceiver from the outside. However, the existing traps related to insertion or removal of a transceiver (SFF Inserted/Removed) are supported. The "Signal-Fail" alarm on the PXC is suppressed.
The operational state of the PXC ID is derived from its administrative state and the operational state of the sub-ports.
The operational state of the PXC sub-ports is dependent on the operational state of the underlying port and the administrative state of the corresponding PXC ID.
PXC statistics
Two types of statistics can be collected on a regular, non-PXC Ethernet port:
-
Low-level port statistics which provide information about conditions on the data-link layer and physical port, for example, the aggregate number of forwarded and dropped octets or bytes on the data-link layer (Layer 2 MAC), FCS errors, number of collisions, and so on. These statistics can be viewed with the show port command.
-
Network-level statistics provide information about forwarded and dropped octets or packets on a per-queue level on network ports. These statistics can be viewed with the show port detail command.
Statistics on PXC ports
The statistics on the PXC ports are maintained only on the data-link layer (Layer 2 MAC). The internal Q-tag used for PXC sub-port identification within the router is included in the displayed octet count. The collected statistics represent the combined upstream and downstream traffic carried by the corresponding PXC sub-ports.
For example, in port level statistics output for a PXC port, the output count represents the upstream and downstream traffic flowing out of the faceplate port while the input count represents the same looped traffic returning into the same port.
show port 1/1/c1/1 detail...
===============================================================================
Traffic Statistics
===============================================================================
Input Output
-------------------------------------------------------------------------------
Octets 290164703 290164703
Packets 2712661 2712661
Errors 0 0
Statistics are cleared when a faceplate port is added or removed from the PXC.
Statistics collection to a local file is not supported for PXC ports.
Queues are not instantiated on the PXC ports, therefore, the network level (queue) statistics are not maintained in that location.
Statistics collection on PXC sub-ports and PXC LAG
PXC sub-ports (for example, pxc-1.a and pxc-1.b) provide aggregated network-level statistics (queue statistics). Physical-level statistics are not supported on PXC sub-ports because these ports do not relay on MAC statistics.
The statistics on a PXC sub-port are aggregated counts of all queues in each traffic direction for the following:
-
forwarded packets
-
forwarded octets
-
dropped packets
-
dropped octets
The statistics collection is triggered on demand at the time of executing either of the following commands.
show port pxc-1.a statistics queue-aggregate
monitor port pxc-1.a interval 30 0 aggregate-queue
The collected statistics are cached for 30 seconds. If multiple consecutive executions of these commands occur within the 30 second period, the statistics counters remains unchanged from the previous reads. Therefore, the minimum interval between two executions of the following command should be at least 30 seconds apart.
show port statistics queue-aggregateExamples for PXC statistics on individual PXC sub-ports
Use the following command to display aggregate queue statistics.
show port pxc-1.a statistics aggregate-queue=============================================================================
Port Statistics on Slot 1
=============================================================================
Port-id Ingress Packets Fwd Ingress Octets Fwd
Ingress Packets Drop Ingress Octets Drop
Egress Packets Fwd Egress Octets Fwd
Egress Packets Drop Egress Octets Drop
------------------------------------------------------------------------------
pxc1.a 4654649 94523288
22544 99852
98652214 65889554
55451 22144
==============================================================================
Use the following command to display aggregate queue statistics with the interval and repeat option.
monitor port pxc-1.a interval 30 repeat 10 aggregate-queue===============================================================================
Monitor statistics for port pxc-1.a
===============================================================================
Ingress Packets Fwd Ingress Octets Fwd
Ingress Packets Drop Ingress Octets Drop
Egress Packets Fwd Egress Octets Fwd
Egress Packets Drop Egress Octets Drop
-------------------------------------------------------------------------------
-------------------------------------------------------------------------------
At time t = 0 sec (Base Statistics)
-------------------------------------------------------------------------------
4654649 94523288
22544 99852
98652214 65889554
55451 22144
-------------------------------------------------------------------------------
At time t = 30 sec (Mode: Delta)
-------------------------------------------------------------------------------
4654649 94523288
22544 99852
98652214 65889554
55451 22144
-------------------------------------------------------------------------------
At time t = 60 sec (Mode: Delta)
-------------------------------------------------------------------------------
4654649 94523288
22544 99852
98652214 65889554
55451 22144
-------------------------------------------------------------------------------
Use the following command to display aggregate queue statistics with the interval, repeat, and rate option.
monitor port pxc-1.a interval 30 repeat 10 rate aggregate-queue===============================================================================
Monitor statistics for port pxc-1.a
===============================================================================
Input Output
-------------------------------------------------------------------------------
-------------------------------------------------------------------------------
At time t = 0 sec (Base Statistics)
-------------------------------------------------------------------------------
Forwarded Packets 454649 94288
Forwarded Bytes 3343434 777998
-------------------------------------------------------------------------------
At time t = 30 sec
-------------------------------------------------------------------------------
Rate [kbps] 4654649 94288
Utilization (% of port capacity) 22.54 9.98
-------------------------------------------------------------------------------
At time t = 60 sec
-------------------------------------------------------------------------------
Rate [kbps] 4654649 94288
Utilization (% of port capacity) 22.54 9.98
-------------------------------------------------------------------------------
Examples for PXC statistics on PXC LAG
Use the following command to display aggregate queue statistics on PXC LAG.
show lag 1 statistics aggregate-queue ===============================================================================
LAG Statistics
===============================================================================
Description : N/A
Port-id Ingress Packets Fwd Ingress Octets Fwd
Ingress Packets Drop Ingress Octets Drop
Egress Packets Fwd Egress Octets Fwd
Egress Packets Drop Egress Octets Drop
-------------------------------------------------------------------------------
pxc1.a 4654649 94523288
22544 99852
98652214 65889554
55451 22144
pxc2.a 4654649 94523288
22544 99852
98652214 65889554
55451 22144
--------------------------------------------------------------------------------
Totals 4654649 94523288
22544 99852
98652214 65889554
55451 22144
===============================================================================
Use the following command to display aggregate queue statistics with the interval and repeat option.
monitor lag 1 interval 30 repeat 10 aggregate-queues===============================================================================
Monitor statistics for LAG ID 1
===============================================================================
Port-id Ingress Packets Fwd Ingress Octets Fwd
Ingress Packets Drop Ingress Octets Drop
Egress Packets Fwd Egress Octets Fwd
Egress Packets Drop Egress Octets Drop
-------------------------------------------------------------------------------
-------------------------------------------------------------------------------
At time t = 0 sec (Base Statistics)
-------------------------------------------------------------------------------
pxc1.a 4654649 94523288
22544 99852
98652214 65889554
55451 22144
pxc2.a 4654649 94523288
22544 99852
98652214 65889554
55451 22144
--------------------------------------------------------------------------------
Totals 4654649 94523288
22544 99852
98652214 65889554
55451 22144
-------------------------------------------------------------------------------
At time t = 30 sec (Mode: Delta)
-------------------------------------------------------------------------------
pxc1.a 4654649 94523288
22544 99852
98652214 65889554
55451 22144
pxc2.a 4654649 94523288
22544 99852
98652214 65889554
55451 22144
--------------------------------------------------------------------------------
Totals 4654649 94523288
22544 99852
98652214 65889554
55451 22144
-------------------------------------------------------------------------------
At time t = 60 sec (Mode: Delta)
-------------------------------------------------------------------------------
pxc1.a 4654649 94523288
22544 99852
98652214 65889554
55451 22144
pxc2.a 4654649 94523288
22544 99852
98652214 65889554
55451 22144
--------------------------------------------------------------------------------
Totals 4654649 94523288
22544 99852
98652214 65889554
55451 22144Use the following command to display aggregate queue statistics with the interval, repeat, and rate option.
monitor lag 1 interval 30 repeat 10 rate aggregate-queues===============================================================================
Monitor statistics for LAG ID 1
===============================================================================
Port-id Ingress Rate [kbps] Egress Rate [kbps]
Ingress Utilization Egress Utilization
% of port capacity) (% of port capacity)
-------------------------------------------------------------------------------
-------------------------------------------------------------------------------
At time t = 0 sec (Base Statistics)
-------------------------------------------------------------------------------
pxc1.a 0 0
0 0
pxc2.a 0 0
0 0
--------------------------------------------------------------------------------
Totals 4654649 94523288
22.44 17.52
-------------------------------------------------------------------------------
At time t = 30 sec (Mode: Delta)
-------------------------------------------------------------------------------
pxc1.a 4654649 94523288
25.44 10.85
pxc2.a 4654649 94523288
22.44 11.52
--------------------------------------------------------------------------------
Totals 4654649 94523288
22.44 17.52
-------------------------------------------------------------------------------
At time t = 60 sec (Mode: Delta)
-------------------------------------------------------------------------------
pxc1.a 4654649 94523288
25.44 10.85
pxc2.a 4654649 94523288
22.44 11.52
--------------------------------------------------------------------------------
Totals 4654649 94523288
22.44 17.52MIBs
PXC sub-ports statistics are represented in a MIB table tmnxPortAggQueueStatsTable which is defined in TIMETRA-PORT-MIB.mib with the following entries.
TmnxPortAggQueueStatsEntry         ::= SEQUENCE
{
    tmnxPortAggQueueIngPktsFwd      Counter64,
    tmnxPortAggQueueIngOctsFwd      Counter64,
    tmnxPortAggQueueIngPktsDrop     Counter64,
    tmnxPortAggQueueIngOctsDrop     Counter64,
    tmnxPortAggQueueEgrPktsFwd      Counter64,
    tmnxPortAggQueueEgrOctsFwd      Counter64,
    tmnxPortAggQueueEgrPktsDrop     Counter64,
    tmnxPortAggQueueEgrOctsDrop     Counter64,
    tmnxPortLastClearedTime	        TimeStamp,
    tmnxPortLastFetchedTime	        TimeStamp

}
Restrictions
The following items describe monitor port restriction.
-
Monitor port command allows monitoring of five simultaneous ports. Mixing of PXC and regular ports in the same monitor command is not supported.
-
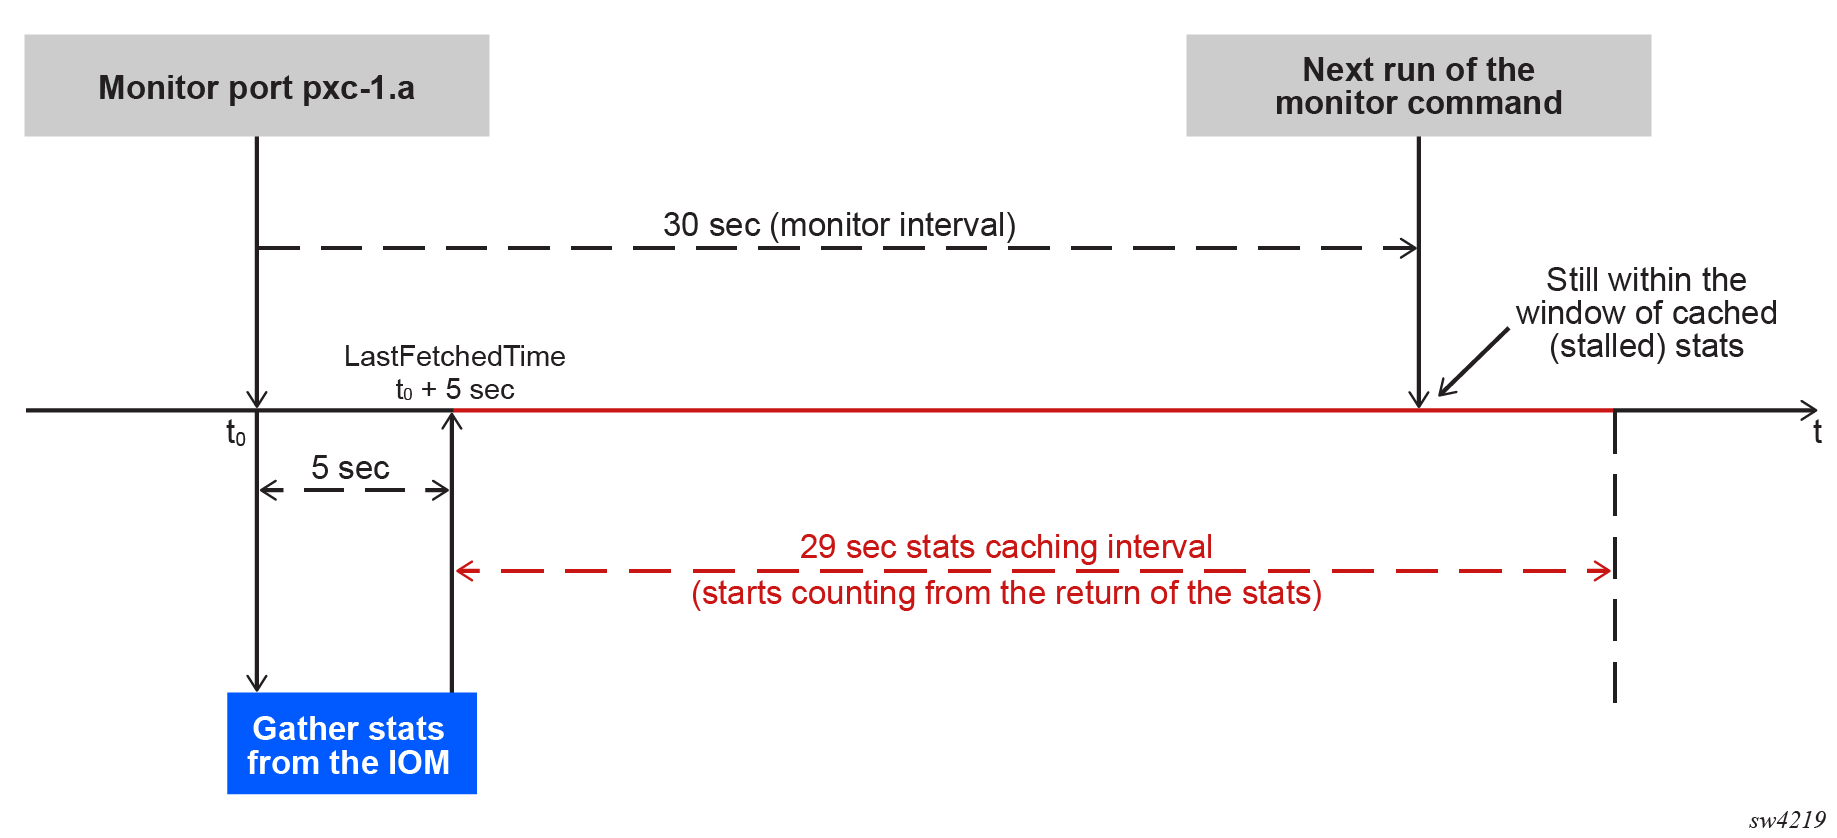
When monitoring ports with a large number of queues, it is possible that the longer time needed for statistics collection may lead to every other output of the monitor command displaying all zeros. This is particularly true at shorter monitoring intervals, such as the minimum of 30 seconds. To ensure consistent non-zero outputs, Nokia recommends gradually increasing the monitoring interval. The recommended monitoring interval with larger number of queues is 60 seconds.
The following diagram illustrates this issue.
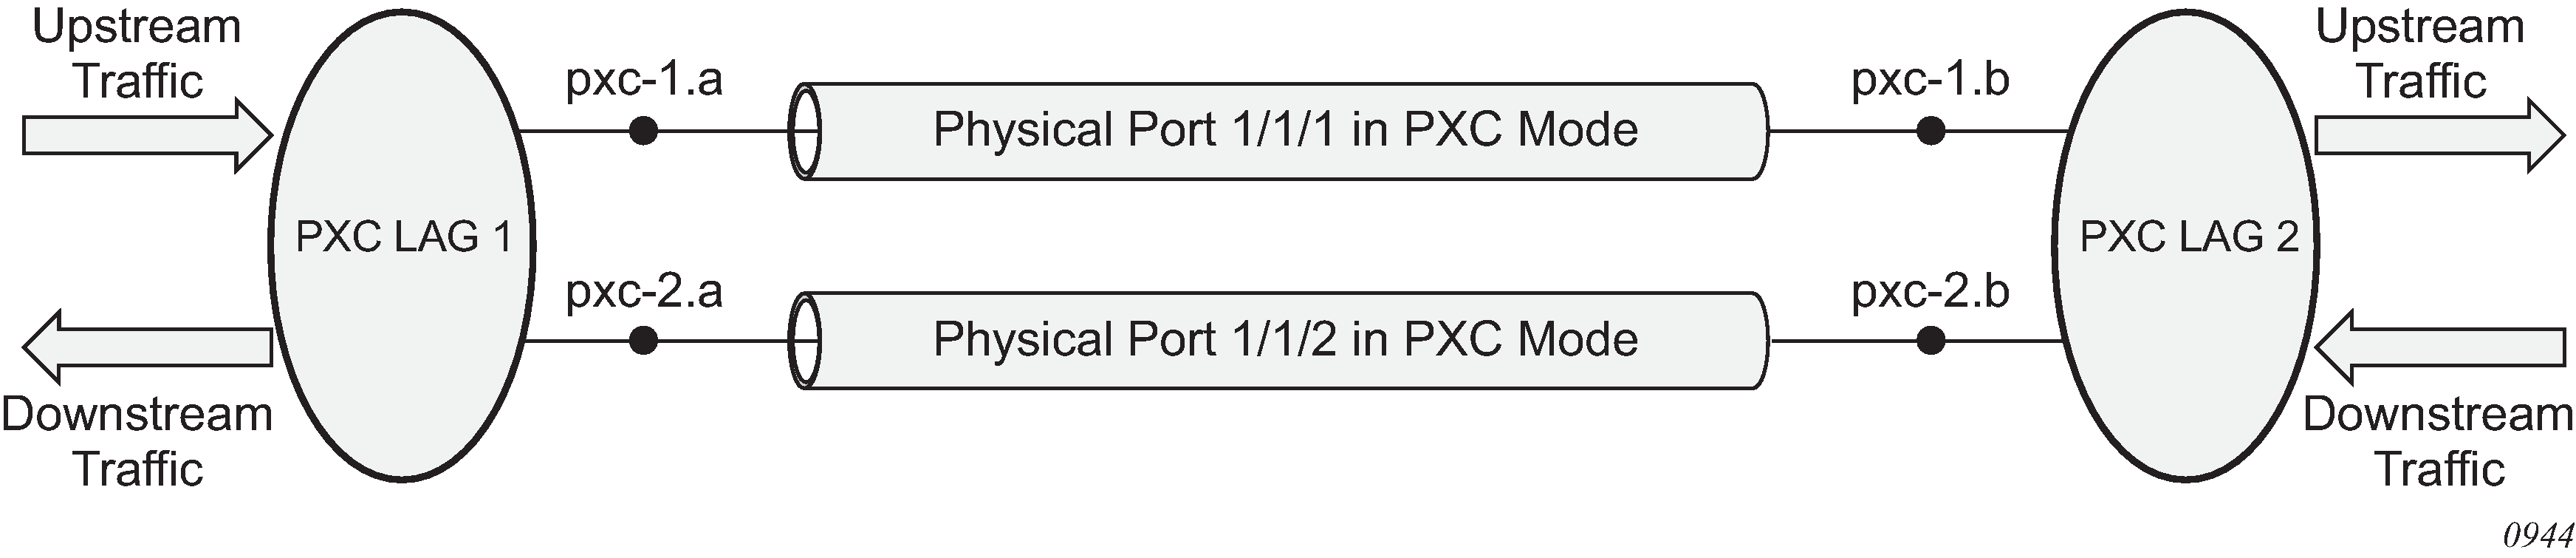
PXC LAG
PXC sub-ports can be aggregated into a PXC LAG for increased capacity and card redundancy. A logical concept of a PXC LAG is shown in Logical concept of a LAG on PXC ports.
Although the configuration allows for a mix of port-based PXCs and MAC-based PXCs in a LAG, the configuration should be used in a production network only during a short migration period when transitioning from one type of PXC to the other. Outside of the migration, the PXCs in a LAG should be of the same type, for example, a LAG should contain only port-based PXCs or only MAC-based PXCs but not both.
The LAGs on PXC ports must be configured in pairs as shown in the following example.
MD-CLI
[ex:/configure]
A:admin@node-2# info
...
    lag "lag-1" {
        description "lag in the up direction"
        port pxc-1.a {
        }
        port pxc-2.a {
        }
    }
    lag "lag-2" {
        description "lag in the down direction"
        port pxc-1.b {
        }
        port pxc-2.b {
        }
    }
classic CLI
A:node-2# configure lag 1
A:node-2>config>lag$ info
----------------------------------------------
        description "lag in the up direction"
        port pxc-1.a
        port pxc-2.a
----------------------------------------------
A:node-2# configure lag 2
A:node-2>config>lag$ info
----------------------------------------------
        description "lag in the down direction"
        port pxc-1.b
        port pxc-2.b
        no shutdown
----------------------------------------------
Within the router, the two sides of the PXC LAG (LAG 1 and LAG 2 in the example configuration) are not aware of their interconnection. As a result, the operational state of one side of the PXC LAG is not influenced by the state of the PXC LAG on the other side.
PXC sub-ports in a LAG must have the same properties (such as the same speed). Mixing PXC sub-ports and non-PXC ports is not allowed. The first port added to a LAG determines the type of LAG (PXC or non-PXC).
Statistics in the output of the show lag statistics command represent combined traffic carried over the referenced LAG and its pair (lag 1 and lag 2 in the above example).
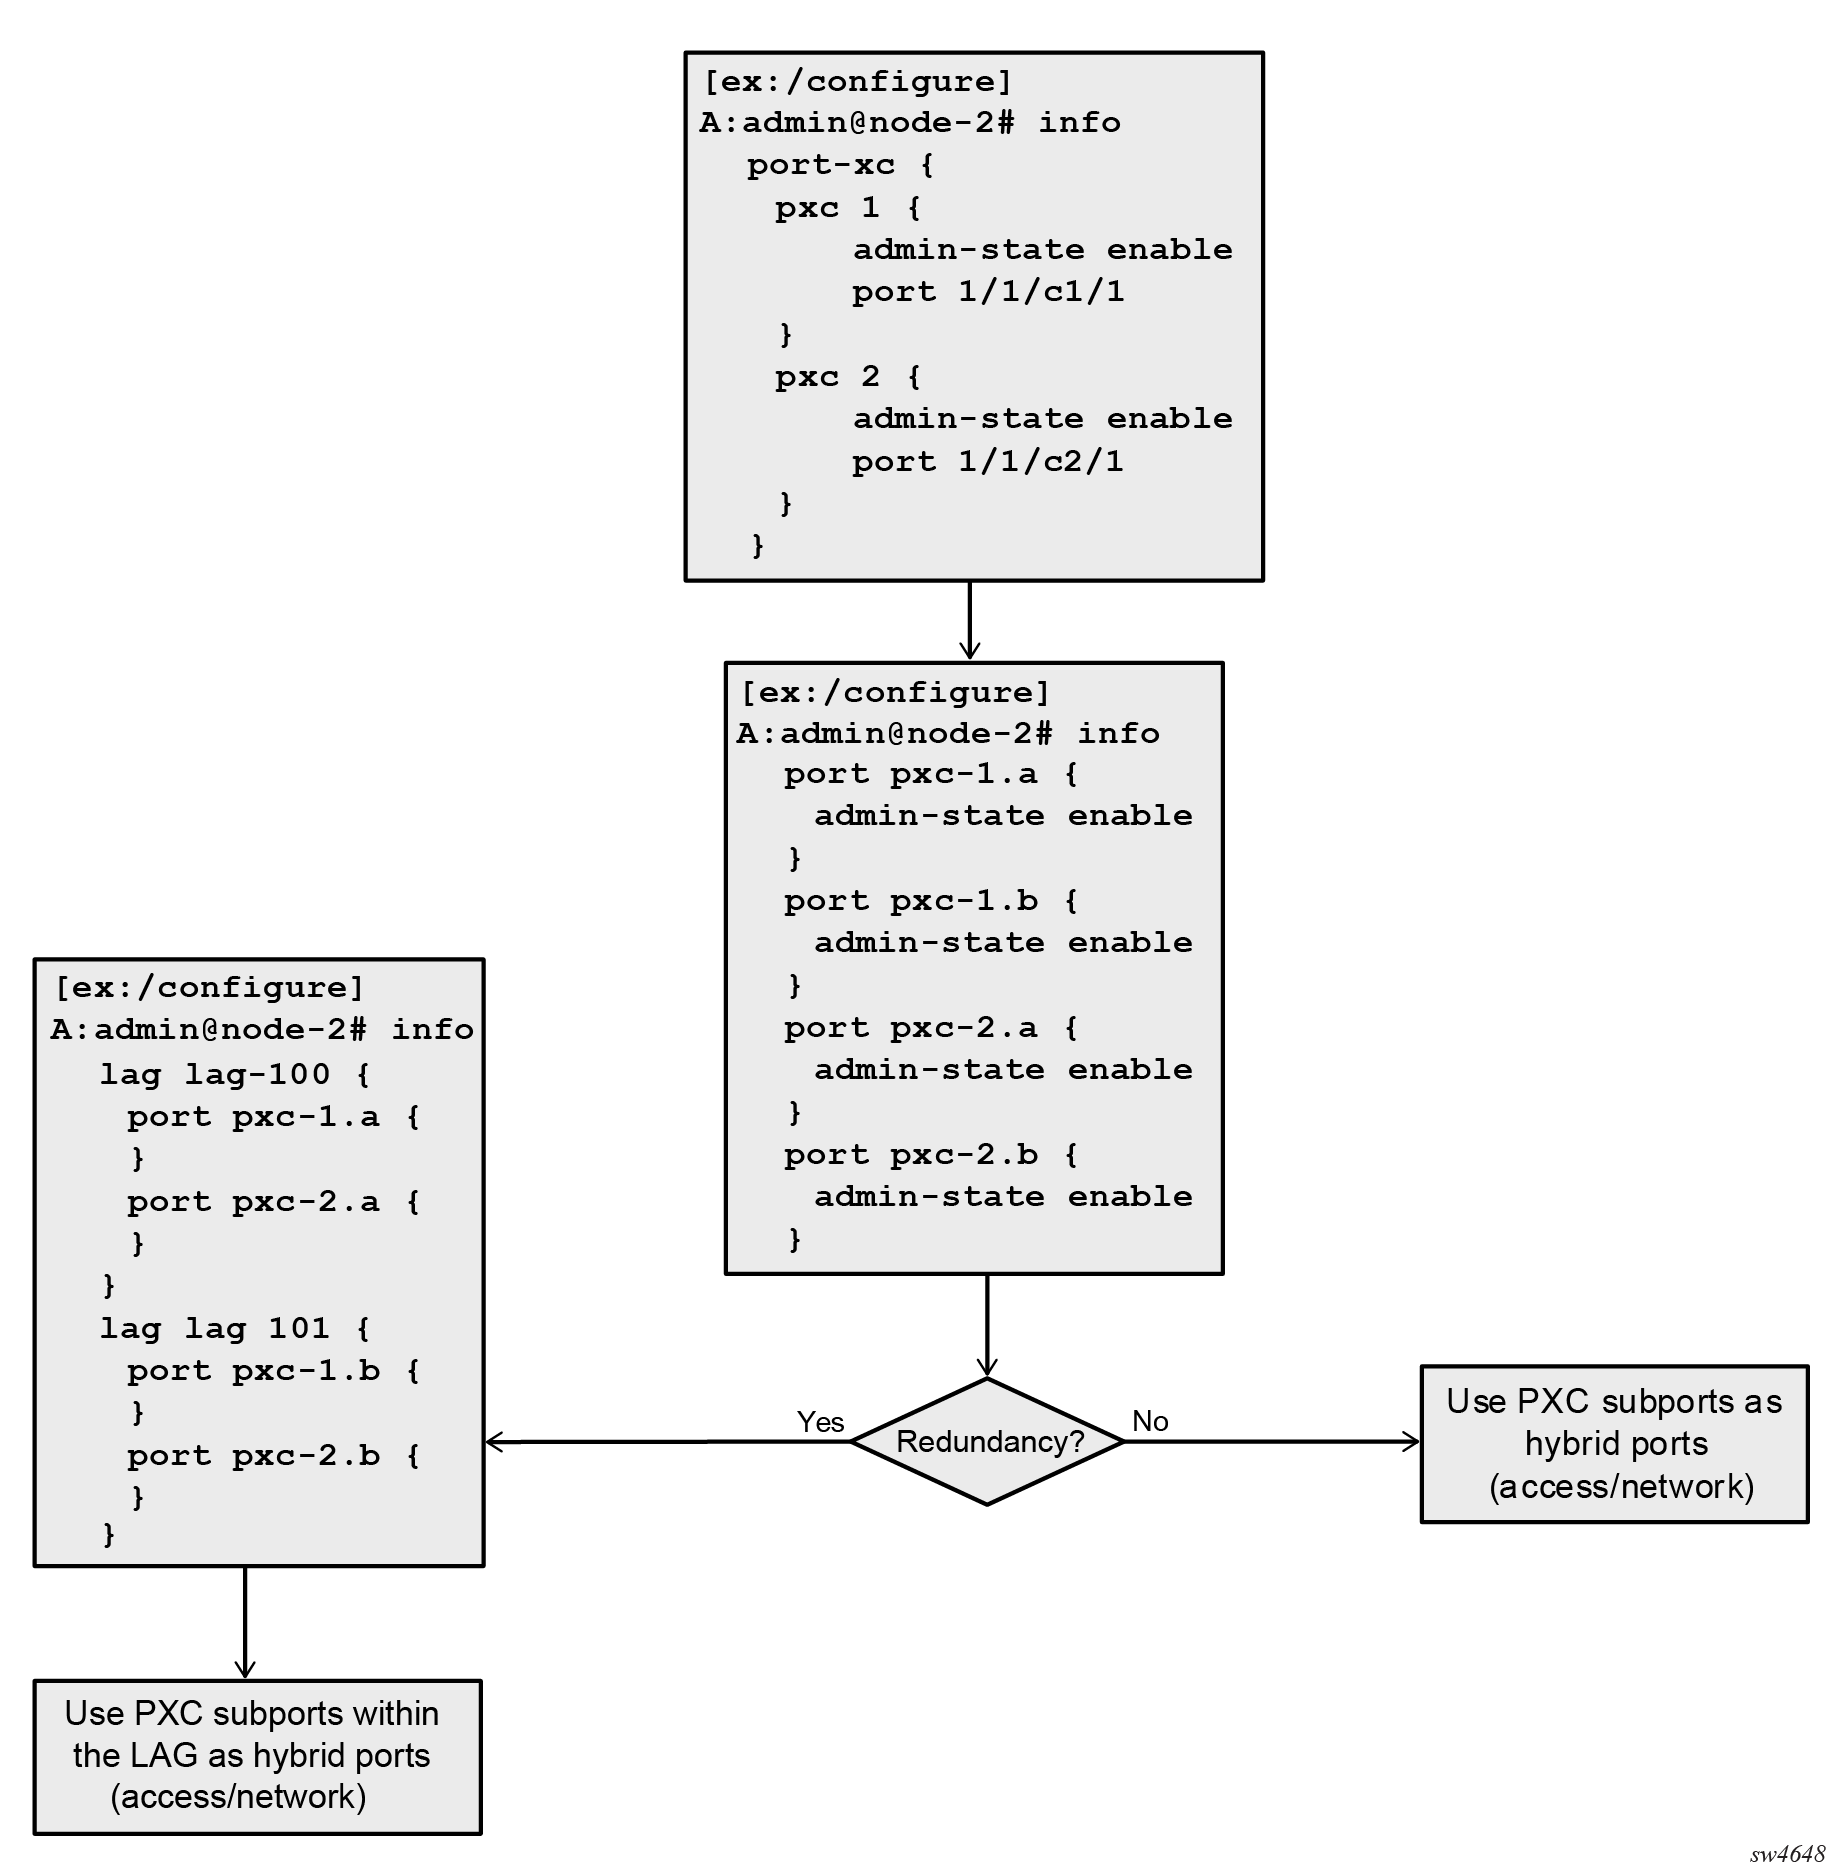
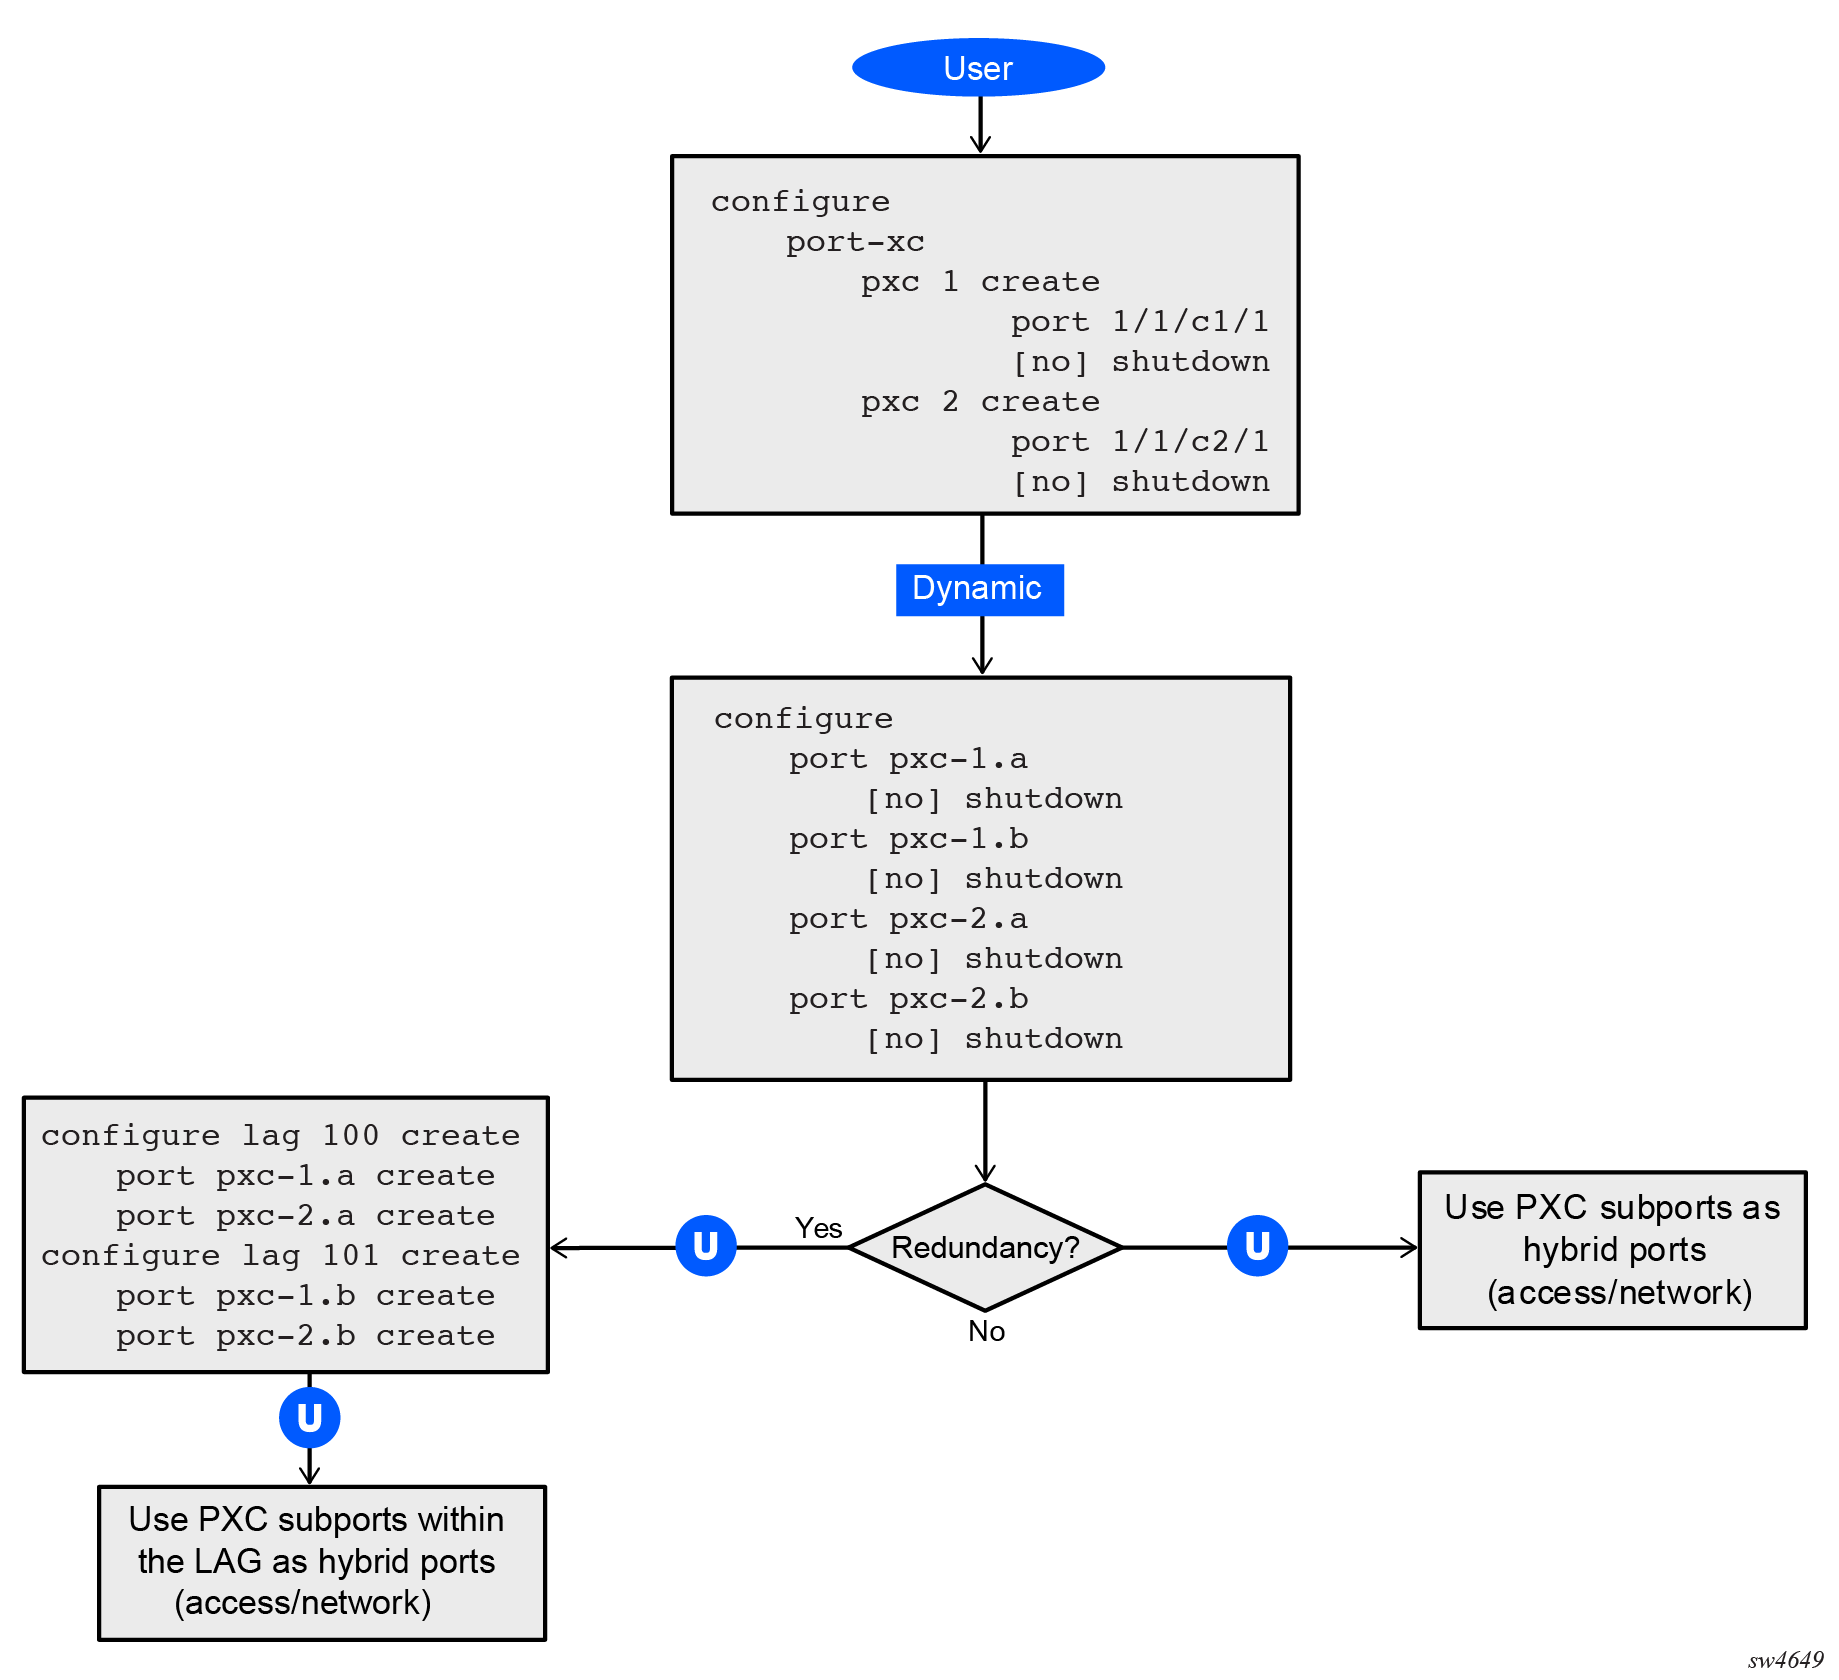
Basic PXC provisioning
The CLI configuration flow example shown in the following figures represents a PXC configuration based on the faceplate port. The oval marked ‟User” represents a configuration step that the user must perform. The block marked ‟Dynamic” represents a step that the system performs automatically without a user’s assistance.
PXC mirroring and LI
Traffic on a PXC sub-port can be mirrored or lawfully intercepted (LI). For example, subscriber ‟Annex1” traffic arriving on a PXC sub-port is mirrored if ‟Annex1” is configured as a mirror or LI source. A PXC sub-port can also be used to transmit mirror and LI traffic out from a mirror-destination service (such as a mirror-dest SAP or SDP can egress out a PXC sub-port, or a routable LI encapsulated packet can be forwarded and transmitted out a PXC sub-port).
A mirror destination can be configured to transmit mirrored and LI traffic out of a SAP on a PXC sub-port that is then cross connected into a VPLS service where a VXLAN encapsulation is added to the mirrored packets before transmission out of the node.
The internal Q-tag that represents the PXC sub-port within the system is included in the lawfully intercepted copy of the packet for traffic intercepted (mirrored) on the ingress side of a PXC sub-port, when the associate mirror-dest service is of type ether (the default) with routable lawful interception encapsulation in the following context.
Use the following command to configure a mirror destination to transmit mirrored and LI traffic from a SAP on a PXC sub-port.
configure mirror mirror-dest encapSee the 7705 SAR Gen 2 OAM and Diagnostics Guide for information about LI.
Configuration example
The following example shows how a PXC port is used to transport an Epipe service over IPsec tunnels when the 7705 SAR Gen 2 is operating as an IPsec SecGW head-end router (for example, when aggregating Epipes over IPsec from a group of 7705 SAR-Hm series of routers). The Epipe service uses GRE transport, where this network egress traffic is sent over the PXC port and into a VPRN SAP configured on the other side of the PXC port. The VPRN SAP ingress traffic is routed over the relevant IPsec tunnel to reach the respective 7705 SAR-Hm series router that terminates the Epipe, using its own VPRN and PXC port to terminate the IPsec tunnel and GRE transport packets.
MDA and port configuration (MD-CLI)
[ex:/configure]
A:admin@node-2# info
...
    card 1 {
        mda 2 {
            mda-type isa-tunnel-v
        }
        mda 3 {
            mda-type isa-bb-v
        }
    }
    port 1/1/c10 {
        admin-state enable
        connector {
            breakout c1-10g
        }
    }
    port 1/1/c10/1 {
        admin-state enable
        ethernet {
            mode hybrid
        }
    }
    port 1/1/c11 {
        admin-state enable
        connector {
            breakout c1-1g
        }
    }
    port 1/1/c11/1 {
        admin-state enable
        ethernet {
            mode hybrid
        }
    }
    port 1/1/c12 {
        admin-state enable
        connector {
            breakout c1-1g
        }
    }
    port 1/1/c12/1 {
        admin-state enable
        ethernet {
            mode access
            encap-type dot1q
        }
    }
...
Faceplate (physical) port configuration on cards 3 and 4 (classic CLI)
[ex:/configure]
A:admin@node-2# info
...
    card 1
        card-type iom-sar
        mda 1
            mda-type m10-sfp++6-sfp
            no shutdown
        exit
        mda 2
            mda-type isa-tunnel-v
            no shutdown
        exit
    exit
    port 1/1/c10
        connector
            breakout c1-10g
        exit
        no shutdown
    exit
    port 1/1/c11
        connector
            breakout c1-1g
        exit
        no shutdown
    exit
    port 1/1/c12
        connector
            breakout c1-1g
        exit
        no shutdown
    exit
    port 1/1/c10/1
        ethernet
            mode hybrid
        exit
        no shutdown
    exit
    port 1/1/c11/1
        ethernet
            mode hybrid
            encap-type dot1q
        exit
        no shutdown
    exit
    port 1/1/c12/1
        ethernet
            mode access
            encap-type dot1q
        exit
        no shutdown
    exit
...PXC and PXC sub-port configuration (MD-CLI)
[ex:/configure port-xc]
A:admin@node-2# info
    pxc 1 {
        admin-state enable
        port-id 1/1/c10/1
    }
    port pxc-1.a {
        admin-state enable
        description "VPRN for IPsec; SAP private interface configured here"
    }
    port pxc-1.b {
        admin-state enable
        description "GRE orig/term PXC side; NW interface will be configured here"
    }
PXC and PXC sub-port configuration (classic CLI)
A:node-2>config>port-xc# info
----------------------------------------------
        pxc 1 create
            port 1/1/c10/1
            no shutdown
        exit
A:node-2>config# info
...
    port pxc-1.a
        description "VPRN for IPsec; SAP private interface configured here"
        ethernet
        exit
        no shutdown
    exit
    port pxc-1.b
        description "GRE orig/term PXC side; NW interface will be configured here"
        ethernet
        exit
        no shutdown
    exit
...
----------------------------------------------
Configuration of the router interface on PXC for GRE transport (MD-CLI)
A:admin@node-2>config>router# info
...
        interface "toVPRN100" {
            port pxc-1.b:200
            ipv4 {
                primary {
                    address 200.200.200.1
                    prefix-length 30
                    gre-termination true
                }
            }
        }
...
Configuration of the router interface on PXC for GRE transport (classic CLI)
A:admin@node-2>config>router# info
...
        interface "toVPRN100"
            address 200.200.200.1/30 gre-termination
            port pxc-1.b:200
            no shutdown
        exit
...
Configuration IPsec SecGW and the E-pipe and VPRN services (MD-CLI)
[ex:/configure service]
A:admin@node-2# info
...
        pw-template "3084" {
            allow-fragmentation true
            auto-gre-sdp true
        }
        epipe "VLL-Hmc03" {
            admin-state enable
            service-id 10573
            customer "1"
            bgp 1 {
                route-distinguisher "65001:10573"
                route-target {
                    export "target:65001:10573"
                    import "target:65001:10573"
                }
                pw-template-binding "3084" {
                }
            }
            bgp-vpws {
                admin-state enable
                local-ve {
                    name "HEAD-END"
                    id 8432
                }
                remote-ve "Hmc" {
                    id 3284
                }
            }
            sap 1/1/c12/1:1101 {
            }
        }
        ies "10" {
            admin-state enable
            customer "1"
            interface "public-100" {
                sap tunnel-1.public:2 {
                    ipsec-gateway "gw-vprn-100" {
                        admin-state enable
                        default-tunnel-template 2
                        ike-policy 2
                        pre-shared-key "HUWumavMAgAr6Q6r7PYdDEO1aJC8 hash2"
                        default-secure-service {
                            service-name "VPRN_100"
                            interface "Int-private-100"
                        }
                        local {
                            gateway-address 10.107.2.1
                        }
                    }
                }
                ipv4 {
                    primary {
                        address 10.107.2.0
                        prefix-length 31
                    }
                }
            }
        }
        vprn "VPRN_100" {
            admin-state enable
            service-id 100
            customer "1"
            autonomous-system 65001
            ipsec {
                security-policy 1 {
                    entry 10 {
                        local-ip {
                            any true
                        }
                        remote-ip {
                            any true
                        }
                    }
                }
            }
            interface "Int-private-100" {
                tunnel true
                sap tunnel-1.private:2 {
                }
            }
            interface "toGRT" {
                ipv4 {
                    primary {
                        address 200.200.200.2
                        prefix-length 30
                    }
                }
                sap pxc-1.a:200 {
                }
            }
            static-routes {
                route 100.100.100.0/24 route-type unicast {
                    description "to 7705 SAR-Hm series routers"
                    interface "Int-private-100" {
                        admin-state enable
                    }
                }
            }
        }
    }
...
Configuration IPsec SecGW and the E-pipe and VPRN services (classic CLI)
A:node-2>config>service$ info
...
        pw-template 3084 name "3084" auto-gre-sdp create
            allow-fragmentation
        exit
        ies 10 name "10" customer 1 create
            interface "public-100" create
            exit
        exit
        vprn 100 name "VPRN_100" customer 1 create
            interface "toGRT" create
            exit
            interface "Int-private-100" tunnel create
            exit
        exit
        ies 10 name "10" customer 1 create
            interface "public-100" create
                address 10.107.2.0/31
                tos-marking-state untrusted
                sap tunnel-1.public:2 create
                    ipsec-gw "gw-vprn-100"
                        default-secure-service name "VPRN_100" interface "Int-private-100"
                        default-tunnel-template 2
                        ike-policy 2
                        local-gateway-address 10.107.2.1
                        pre-shared-key "HUWumavMAgAr6Q6r7PYdDEO1aJC8" hash2
                        no shutdown
                    exit
                exit
            exit
            no shutdown
        exit
        vprn 100 name "VPRN_100" customer 1 create
            ipsec
                security-policy 1 create
                    entry 10 create
                        local-ip any
                        remote-ip any
                    exit
                exit
            exit
            autonomous-system 65001
            interface "toGRT" create
                address 200.200.200.2/30
                sap pxc-1.a:200 create
                exit
            exit
            interface "Int-private-100" tunnel create
                sap tunnel-1.private:2 create
                exit
            exit
            static-route-entry 100.100.100.0/24
                next-hop "Int-private-100"
                    no shutdown
                exit
            exit
            no shutdown
        exit
        epipe 10573 name "VLL-Hmc03" customer 1 create
            service-mtu 1614
            bgp 1
                route-distinguisher 65001:10573
                route-target export target:65001:10573 import target:65001:10573
                pw-template-binding 3084
                exit
            exit
            bgp-vpws
                ve-name "HEAD-END"
                    ve-id 8432
                exit
                remote-ve-name "Hmc"
                    ve-id 3284
                exit
                no shutdown
            exit
            sap 1/1/c12/1:1101 create
                no shutdown
            exit
            no shutdown
        exit
    exit
----------------------------------------------