
OAM monitoring and reporting
OAM fault and performance tools monitor and report information about the network infrastructure and the services that rely on that infrastructure.
Link measurement
Network elements use routing protocols to exchange information about local links. This information can influence routing decisions and typically consists of static interface attributes. Link measurement can supplement these attributes with dynamic, unidirectional delay measurements obtained using IP performance measurement protocols. A link measurement test measures and reports delay information for directly connected IP peers.
Link measurement supports the STAMP protocol (RFC 8762) and TWAMP-Light for
session-sender test packets. The protocol used for link measurement is selected in the
link measurement template using the oam link-measurement measurement-template
pdu-type command. STAMP is used by default when no protocol is explicitly
configured. To explicitly select a protocol, configure either the stamp
or twamp-light option.
By default, link measurement runs one test session for each configured IP interface. You can enable LAG micro-sessions on an interface to run a separate test session for each LAG member port when the IP subinterface is configured over a LAG. In this mode, link measurement measures and reports delay for each LAG member for operational and on-change telemetry. Threshold processing can report a single delay value to the routing engine based on the configured delay metric. When LAG micro-sessions are disabled, link measurement continues to use the original single-session model.
When LAG micro-sessions are enabled, the micro-session identifiers comply with RFC 9534
for STAMP or RFC 9533 for TWAMP-Light, depending on the configured
pdu-type.
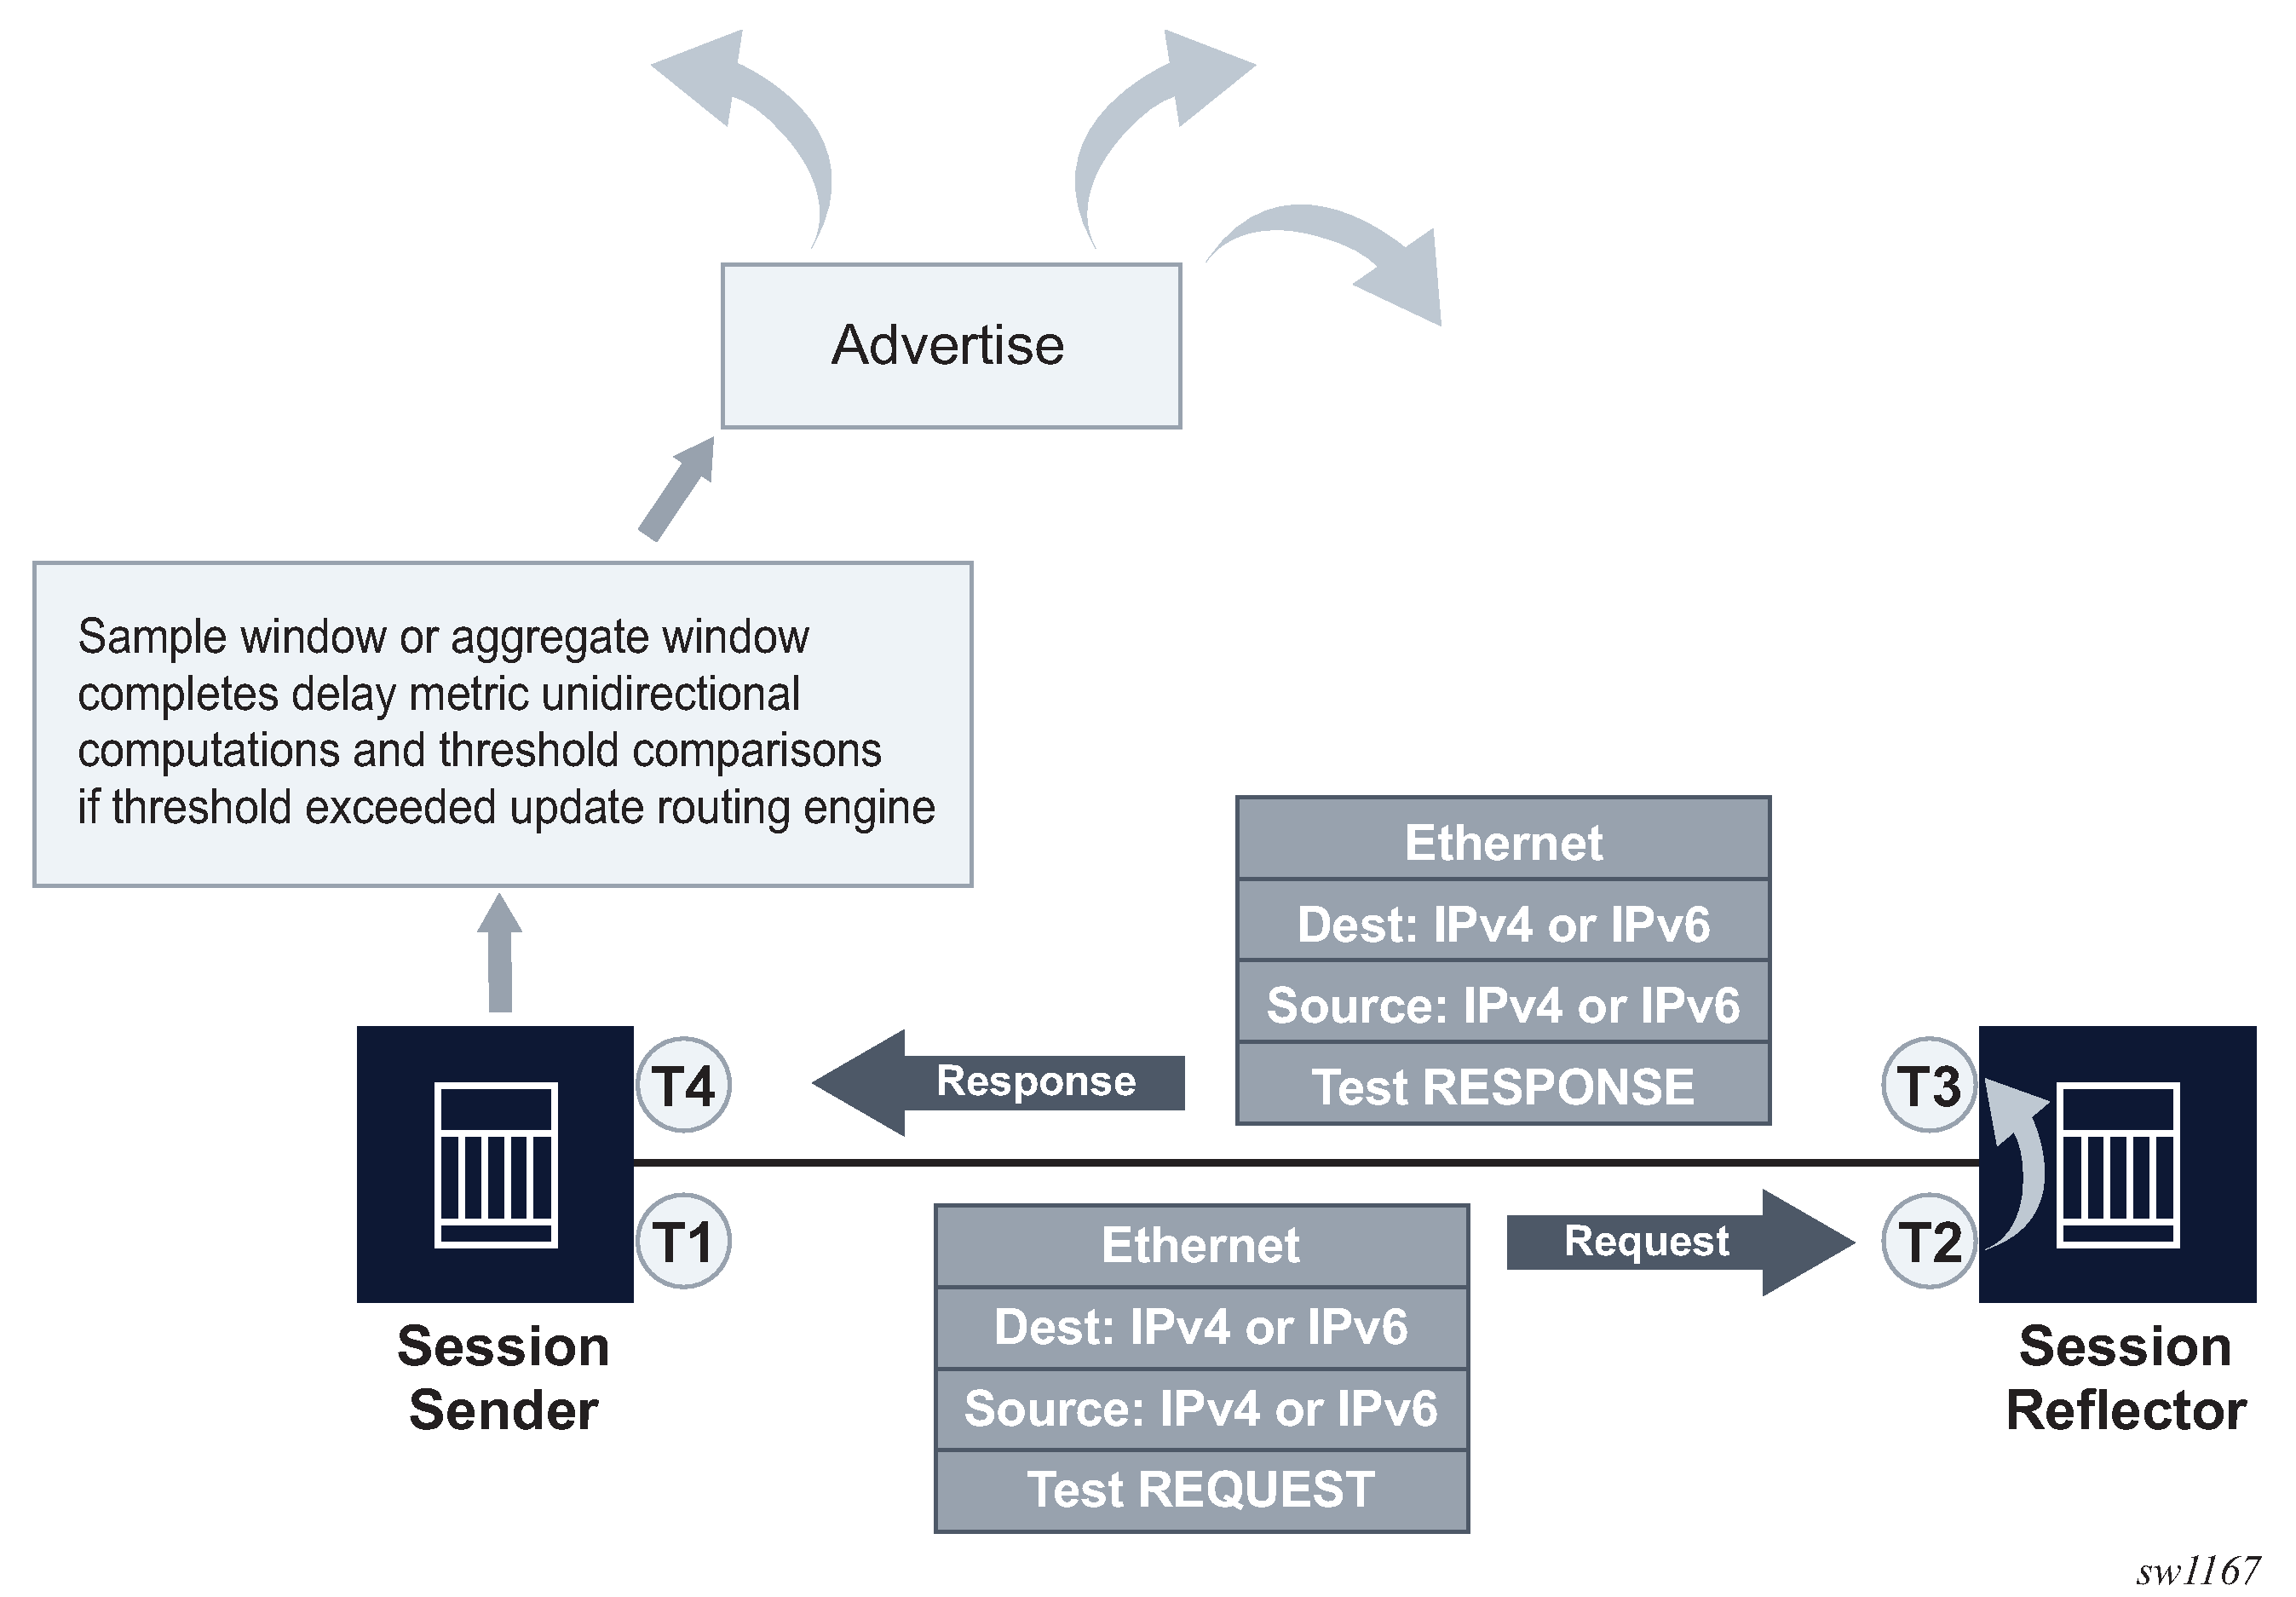
The following figure illustrates directly connected IP interfaces and the link measurement interaction.
Link measurement template
Creation of a link measurement template is the first step of a link measurement test. The link measurement template is created by configuring the common test parameters using the oam link-measurement command. After the measurement template is created, an SR Linux interface references the link measurement template using the oam link-measurement interface dynamic-measurement link-measurement-template command. When the association between the interface and the template is established, the interface executes a process to determine the operational state of the test and detect any defect conditions that may prevent test execution. If no underlying conditions are present, the IP interface delay measurements are collected in measurement windows, compared with the configured thresholds, and reported to the routing engine for further processing when required.
The sample-window and aggregate-sample-window
statistics are maintained separately for each test session. When LAG micro-sessions are
disabled, one test session is maintained for each link measurement interface. When LAG
micro-sessions are enabled on a LAG-based IP interface, each active LAG member has its
own test session and corresponding sample-window and
aggregate-sample-window history. Interface-level fields, such as
the last reported dynamic delay and the delay reported to the routing engine, reflect
threshold processing across all LAG members when LAG micro-sessions are enabled, as
described in Collection and
reporting.
Link measurement template parameters
The parameters that are configured using the oam link-measurement interface dynamic-measurement link-measurement-template command define the test criteria used by the test. Conceptually, the test criteria are divided into the following groups:
Modifying a link measurement template
SR Linux supports the modification of active link measurement templates. That includes administratively disabling a link measurement template that IP interfaces are actively referencing. Modifying existing parameters causes interface delay tests that reference the modified template to terminate the current sample, and aggregate measurement windows, and start new measurement windows using the updated template parameters. The previous historical results are maintained, but the state field of the measurement window coinciding with the change indicates Terminated. Changing the description or the last-reported-delay-hold configuration does not cause a termination of the current sample and aggregate measurement windows.
Deleting a link measurement template
A link measurement template cannot be deleted if interfaces are referencing that template.
General configuration
The general configurations included in the oam link-measurement measurement-template command influence probe frequency, the delay metric type to monitor, and retention of the delay measurement last reported.
-
The probe frequency, configured using the
intervalcommand, determines how frequently test packets are transmitted. Shorter intervals increase the aggregate packet transmission rate across all link-measurement sessions on the node. For platform limits on the link-measurement transmit rate, see Resource allocation and limits. -
The
delaycommand configures the delay metric used to compare measured values against configured thresholds. The selected metric applies to both the sample-window and aggregate-sample-window. Supported values are as follows.averagemax-of-minmin-of-maxmaximumminimum
When LAG micro-sessions are disabled, only one session participates in the comparison; therefore,
min-of-maxis equivalent tomaximum, andmax-of-minis equivalent tominimum. Themin-of-maxandmax-of-minmetrics are intended for deployments in which multiple LAG member sessions participate in the comparison. -
The unidirectional-measurement command specifies the method used to compute the unidirectional delay. If the clock synchronization between nodal clocks used by the OAM timestamp function is not synchronized to near exact accuracy, the derived option must be used. Specifying this option calculates the unidirectional measurement using the round trip delay divided by two computation. If synchronization can meet near exact accuracy, the actual option can be used. Specifying this option calculates the forward delay using the forward direction timestamps, T2-T1 computation.
-
When the operational state of the link measurement test transitions to down, the OAM function instructs the routing engine to clear the last reported delay value at the expiration of the last-reported-delay-hold value. A previously reported delay is considered valid for the duration of this period and is cleared if the timer reaches zero. If the operational state returns to up before the timer expires, no action is taken to clear the previous value. The counter is reset to the configured value, waiting for the next operational down event. If the last-reported-delay-timer is set to zero, previously reported delay values from that test are cleared when the operational state changes to down without any additional time.
An operational state is up for a test if:
-
the measurement template is administratively up
-
the source UDP port is available
-
an IPv4 or IPv6 protocol is administratively up
-
there are no internal errors that prevent the test from initializing
-
-
The aging timer does not start a count to zero for failure conditions that do not affect the interface delay test operational state. The delay measurement last reported is maintained when conditions external to the interface delay test, such as fault conditions on the port, IP interface, routing changes, and so on, occur.
Collection and reporting
The collection and reporting parameters define the following:
-
length of the sample-window and aggregate-sample-window. Two measurement windows are provided to support use cases that require a reporting hierarchy and both include the same configuration options.
-
thresholds that trigger reporting. The threshold values determine when the measurement window updates the reported delay value.
Multiplier
The measurement windows use the multiplier command to determine the length of time that the measurement window remains open. The sample window length is multiples of the interval. This window stores the results of individual test probes for a total length of the interval multiplied by the multiplier value. The aggregate sample window multiplier length is the number of sample windows. This window stores the number of results passed from individual sample windows. In the aggregate sample window, the minimum, maximum, and average calculations are based on the results received from the sample window. For example, if the delay metric of interest is the average, the aggregate sample is a collection of averages passed from the sample window. The reporting in the aggregate sample window is as follows:
-
The minimum is the minimum value for all the averages received.
-
The maximum is the maximum value from all the averages received.
-
The average is the average of all the averages received.
Window integrity
The comparison to thresholds and reporting decisions occurs at the end of the measurement window if it completes without termination and is deemed integral based on the window-integrity command configuration. Integrity is a percentage-based calculation that determines the number of samples that must be present in the measurement window for that window to be considered integral. If the number of samples in the window equals or exceeds the number of required samples, the result is treated as representative and follows normal post-measurement window processing. However, if the number of samples in the window does not achieve integrity, the result is not considered representative and is only recorded for historical purposes, but is otherwise ignored and not processed. By default, integrity checking is disabled and all results from a measurement window are treated as integral and compared to the configured thresholds.
Threshold
The following types of thresholds are supported.
-
absolute: a specified increase or decrease in microseconds. -
relative: a specified percentage increase or decrease.
When LAG micro-sessions are disabled, thresholding compares the completed measurement-window result for the interface’s single session with the delay measurement most recently reported at the end of a successful measurement window. Threshold evaluation and reporting occur a single time per threshold, per completed measurement window. If multiple thresholds are met for the same measurement window, only one threshold triggers an update to the routing engine.
When LAG micro-sessions are enabled, each LAG member session maintains its own sample-window and aggregate-sample-window. When a member’s sample window completes and meets the window-integrity requirements, its result is added to an internal comparison table containing the latest integral completed result for each member. The configured delay metric is then calculated across all entries currently in the table and used for threshold comparison. Member sample windows do not need to complete simultaneously.
Results that do not meet the requirements for an integral result are not added to the comparison table. Instead, the member’s entry is set to null. A null entry is used only for threshold comparison and does not, by itself, clear the delay measurement last reported to the routing engine.
A member’s comparison entry is set to null when any of the following conditions occur.
-
The configured window-integrity percentage is not achieved.
-
Window integrity is not configured and the member receives no responses.
-
The member meets the window-integrity requirement, but its LAG member port is operationally down when the sample window closes.
With LAG micro-sessions enabled, a completed sample window can later transition to a reported state, such as sw-reported, when a subsequent comparison identifies that window as the source of a new report. On-change telemetry notifies subscribers when the window state changes.
When a new delay value is reported to the routing engine for a link-measurement interface, the aggregate sample windows for that interface’s measurement context terminate and restart.
With LAG micro-sessions enabled, the routing engine continues to receive a single last-reported dynamic delay value per link-measurement interface. This value is derived from the configured delay metric applied across the LAG member sessions.
Reporting
Reporting is enabled by default and the routing engine is informed of threshold events. The notification process uses the reporting command and threshold configurations. At least one threshold must be configured to report to the routing engine. Disabling reporting allows the function to execute but prevents the reporting of threshold events to the routing engine. If this value is toggled and a value was previous reported, the reported value is cleared, and the process returns to the initial reporting phase.
Protocol
The oam link-measurement measurement-template pu-type choice selects the session-sender protocol. The stamp and twamp-light presence containers are available. If neither case is explicitly committed, the application uses STAMP as the default. The default is visible in state data but is not present in the candidate configuration until a case is committed. Deleting the committed case returns the configuration to the application default. The twamp-light container has no additional configuration leaves.
STAMP and TWAMP Light
Support for STAMP using the defined TLVs in RFC9534 and TWAMP Light RFC9533, only the definition of the micro-session-id fields is supported.
The session-reflector function supports STAMP and TWAMP Light processing. When the session sender transmits TWAMP Light PDUs for LAG micro-sessions configure the session reflector must be identify the corresponding fields.
On the session reflector, enable oam stamp session-reflector network-instance twamp-light-extensions lag-micro-sessions true to parse bytes 17–18 and 19–20 as RFC 9533 micro-session identifiers.
When LAG micro-sessions are enabled, each STAMP session uses a unique SSID for each LAG member. STAMP reflectors that support RFC 9534 process micro-session TLVs without additional reflector configuration.
Source UDP port
--{ + candidate shared default }--[  ]--
# info oam ippm
    oam {
        ippm {
            source-udp-port-pools {
                port 64374 {
                    application-assignment oam-pm-ip
                }
            }
        }
    }
IPv6 destination discovery
IPv6 destination address discovery allows the discovery of a single directly connected IPv6 peer. When this option is enabled, a bootstrap function using an ICMPv6 echo request with a destination ff02::2 is generated. When the directly-connected peer responds, the link measurement function uses the source address of the ICMPv6 echo response as the destination address for the link measurement test packets.
The process has four main components:
- Enabling the functions using admin-state command.
- Configuring the discovery-interval command. This is the initial timer used by the discovery process to discover the peer. This interval is used for the duration of the discovery-timer.
- Implementing the discovery phase. If the timer expires or the peer is discovered before the expiration of the discovery-timer, the process reverts back to the update-interval.
-
Implementing the update-interval. This is an optional maintenance component of the peer address that runs at a slower rate. This option is not required and can be disabled in environments where the peer address is unlikely to change. If the peer is not discovered during the discovery-timer and with the update-interval disabled, the peer fails to be discovered. Disable and then enable the IPv6 protocol to restart the discovery process.
Return path
By default, the session reflectors use routing to return the response packet to the session sender. There are instances when it may be beneficial to be selective about the IP interface used for the return path. For example, when multiple tests are executed on different interfaces between the same pair of nodes, and using non-directly connected interface addresses, and ECMP exists between the two nodes. In this case, the return-path link command can be configured as true. This includes the return path TLV and link sub TLV in the test packet. This configuration instructs the session reflector to send the response out to the same IP interface on which it was received. The destination IP address for the response packet must be installed in the forwarding table and reachable from that interface. If the routing engine determines that the prefix is not reachable from that interface, the response packet is dropped at the reflector.
Interface assignment
The test criteria for link measurement are configured in the link-measurement template. The delay test is executed from the network instance with type default and requires an interface that is part of the network instance and configured using the oam link-measurement interface command. The link-measurement template does not define interface-specific requirements, such as the IP protocol used to encapsulate the test packet or the IP source and destination addresses.
LAG micro-sessions
Configure the oam link-measurement interface dynamic-measurement link-measurement lag-micro-sessions true command to enable per-member sessions on a LAG. When enabled on an L3 subinterface of a LAG, the system creates one test session for each configured LAG member.
Removing a LAG member stops its session and deletes its measurement history. Adding a member starts a new session with new history.
If LAG micro-sessions are enabled but the L3 subinterface is not LAG-based, the configuration is accepted, but the system reports the operational failure interface-not-lag until the subinterface becomes LAG-based.
Sessions that cannot obtain the required link-measurement transmit resources are queued. Their operational state is down, with waiting-for-resource reported as the transmit-resource state. LAG members can therefore operate partially when resources are unavailable for one or more member sessions.
IP addressing
To enable dynamic measurements for the interface, configure a link measurement template and enable the test protocol using the oam link-measurement interface dynamic-measurement protocol ipv4 or oam link-measurement interface dynamic-measurement protocol ipv6 command. Only one protocol, IPv4 or IPv6, can be enabled for an interface delay test at any time. Interfaces defined as loopback do not support interface delay tests and are an invalid interface type.
IPv4 address auto-discovery
When the IPv4 protocol is enabled with no addressing configured, the source address is automatically assigned to the primary IPv4 address of the IP interface. The destination address is automatically assigned if the primary IPv4 address has a prefix length of 30 or 31. In other cases, such as shorter prefix lengths or unnumbered interfaces, the destination address cannot be resolved and must be configured manually. The source-ip and destination-ip commands take precedence over the auto-assigned addressing; the IPv4 addresses must be unicast.
IPv4 auto-assigned addressing is not updated for operationally up interface delay tests when the IP addressing associated with that interface is changed. Nokia suggests the following options to update the auto-assigned addressing:
-
administratively disable and enable the protocol used for the interface delay test
-
disable and enable the IP interface under which the IP address has changed
IPv6 address auto-discovery
oam link-measurement measurement-template ip ipv6-destination-discoveryTest initialization
When the link measurement template is assigned to an IP interface, the audit process determines the operational state of the test. The interface delay test transitions to operationally up if the following conditions are met:
-
the associated measurement template is administratively enabled
-
there is an administratively enabled test protocol configured using the ipv4 or ipv6 command
-
the system resources are available to start the test
Further validation determines if there are any underlying conditions that are considered detectable transmission errors, which are listed in the following table.
When all audit conditions successfully pass, the test begins. When no thresholds are configured, the test collects delay information as history, but without at least one configured threshold value, reporting updates to the routing engine are disabled. If at least one threshold is configured, the interface enters the first report phase. Because no previous delay value has been reported, the first measurement window with a configured threshold that completes with integrity triggers the delay measurement report. After this benchmark is set, all subsequent thresholds use the delay measurement last reported as the comparison.
History and results
Active interface delay tests retain up to 50 sample windows and 20 aggregate sample windows in history for each test session. When LAG micro-sessions are enabled, these histories are maintained separately for each LAG member.
The current measurement windows and historical results are not retained across CPM switchovers. The last-reported delay measurement is retained across an application warm restart. Sample-window and aggregate-sample-window contents may be lost during an ISSU, application warm restart, or HA event; only the last-reported delay value is retained.
When LAG micro-sessions are enabled, view per-member state under lag-micro-sessions in the output of info from state oam link-measurement interface.
Resource allocation and limits
Commit-time validation applies to the configured number of link-measurement templates and interfaces and transmission rate.
Exceeding the limit does not prevent the configuration from being committed; instead,
sessions that cannot obtain transmit resources are queued under oam
link-measurement resources with a state of
waiting-for-resources.
Allocating source UDP port to link measurement
To allocate a source UDP port to link measurement, you specify the UDP port number in the oam ippm source-udp-port-pools port command and select link-measurement option in the application-assignment parameter.
Allocating source USP port to link measurement
This example allocates a source UDP port to perform the link measurement test.
--{ + candidate shared default }--[  ]--
# info with-context oam ippm
    oam {
        ippm {
            source-udp-port-pools {
                port 64374 {
                    application-assignment link-measurement
                }
            }
        }
    }
Performing link measurement test
Perform the following steps to carry out the link measurement test:
-
Perform the following steps to create a link measurement template:
- Use the oam link-measurement measurement-template command to create a measurement template.
- Use the oam link-measurement measurement-template pdu-typecommand to selet the PDU type.
- Configure the parameters as shown in the example. See Creating a measurement template.
-
Perform the following steps to assign an interface to the link measurement
template:
- Use the oam link-measurement interface command to create an interface.
- Use the oam link-measurement interface interface-ref command to provide a reference to an interface and subinterface.
- Use the oam link-measurement interface dynamic-measurement link-measurement link-measurement-template command to assign the link measurement template.
- Use the oam link-measurement interface dynamic-measurement protocol command to configure the protocol and IP address of the source and destination, as shown in the example, Assigning an interface to the link measurement template.
- Use the oam link-measurement interface dynamic-measurement link-measurement lag-micro-sessions command to configure LAG interfaces requiring per-member measurement. See example, Configuring LAG micro-sessions for LAG interfaces.
- On TWAMP-Light peers, use the oam stamp session-reflector network-instance twamp-light-extensions lag-micro-sessions to enable TWAMP-Light LAG micro-sessions on the session reflector. See example, Enabling TWAMP-Light LAG micro-sessions on the session reflector.
- When the link measurement template is assigned to an IP interface, the audit process determines the operational state of the test. Further validation determines if there are any underlying conditions that are considered detectable transmission errors. When all audit conditions successfully pass, the delay collection begins.
-
Use the following commands to view the results of the link measurement:
- info from state with-context oam link-measurement interface - See Displaying link measurement test results.
- info from state with-context oam link-measurement resources. See Displaying link measurement resources.
- info from state oam link-measurement interface * | as table - See Displaying link measurement interface operation state table.
- info from state oam link-measurement interface * statistics aggregate-sample-window index * | as table - See Displaying link measurement interface statistics aggregate sample window table.
- info from state oam link-measurement interface * statistics sample-window index * | as table - See Displaying link measurement interface statistics sample window table.
- info from state with-context oam link-measurement interface lag-micro-sessions lag member. See Displaying link measurement LAG micro-session and resource state.
Creating a measurement template
This example creates a measurement template.
--{ + candidate shared default }--[  ]--
# info with-context oam link-measurement measurement-template link-1
    oam {
        link-measurement {
            measurement-template link-1 {
                admin-state enable
                sample-window {
                    multiplier 30
                    window-integrity 70
                    threshold {
                        absolute 50
                    }
                }
                ip {
                    destination-udp-port 862
                    ttl 1
                }
                pdu-type {
                    twamp-light {
                    }
                }
            }
        }
    }
Assigning an interface to the link measurement template
This example assigns an interface to the link measurement template.
--{ + candidate shared default }--[  ]--
# info with-context oam link-measurement interface lm01
    oam {
        link-measurement {
            interface lm01 {
                interface-ref {
                    interface ethernet-1/1
                    subinterface 1
                }
                dynamic-measurement {
                    link-measurement {
                        link-measurement-template link-1
                    }
                    protocol {
                        ipv4 {
                            admin-state enable
                            destination-ip 192.168.1.2
                            source-ip 192.168.1.1
                        }
                    }
                }
            }
        }
    }
Configuring LAG micro-sessions for LAG interfaces
--{ + candidate shared default }--[  ]--
# info with-context oam link-measurement interface lm01
    oam {
        link-measurement {
            interface lm01 {
                interface-ref {
                    interface lag1
                    subinterface 0
                }
                dynamic-measurement {
                    link-measurement {
                        link-measurement-template link-1
                        lag-micro-sessions true
                    }
                    protocol {
                        ipv4 {
                            admin-state enable
                            destination-ip 192.168.1.2
                            source-ip 192.168.1.1
                        }
                    }
                }
            }
        }
    }
Enabling TWAMP-Light LAG micro-sessions on the session reflector
--{ + candidate shared default }--[  ]--
A:root@srl1# info with-context oam stamp session-reflector network-instance default twamp-light-extensions
    oam {
        stamp {
            session-reflector {
                network-instance default {
                    twamp-light-extensions {
                        lag-micro-sessions true
                    }
                }
            }
        }
    }
Displaying link measurement test results
This example displays the results of the link measurement test.
--{ + candidate shared default }--[  ]--
# info from state with-context oam link-measurement interface lm01
    oam {
        link-measurement {
            interface lm01 {
                oper-state up
                detectable-transmit-error none
                operational-source-address 192.168.1.1
                source-ip-auto-assigned false
                operational-destination-address 192.168.1.2
                destination-ip-auto-assigned false
                in-use-source-udp-port 54000
                in-use-destination-udp-port 862
                stamp-session-identifier 10
                reporting true
                last-reported-dynamic-delay 50
                report-timestamp 2026-01-28T17:54:01.000Z
                report-triggered-by sample-threshold-absolute
                aggregate-newest-index 2
                sample-newest-index 2
                interface-ref {
                    interface ethernet-1/1
                    subinterface 1
                }
                dynamic-measurement {
                    link-measurement {
                        link-measurement-template link-1
                    }
                    protocol {
                        ipv4 {
                            admin-state enable
                            destination-ip 192.168.1.2
                            source-ip 192.168.1.1
                        }
                        ipv6 {
                            admin-state disable
                        }
                    }
                }
                statistics {
                    aggregate-sample-window {
                        index 1 {
                            end-timestamp-utc 2026-01-28T17:54:01.000Z
                            window-state sw-reported
                            sample-window-count 1
                            minimum 0
                            maximum 0
                            average 0
                            result 0
                            integrity false
                        }
                        index 2 {
                            end-timestamp-utc 1970-01-01T00:00:00.000Z
                            window-state in-progress
                            sample-window-count 0
                            minimum 0
                            maximum 0
                            average 0
                            result 0
                            integrity false
                        }
                    }
                    sample-window {
                        index 1 {
                            end-timestamp-utc 2026-01-28T17:54:01.000Z
                            window-state sw-reported
                            transmitted-packets 30
                            received-packets 30
                            minimum 50
                            maximum 68
                            average 56
                            result 50
                            integrity true
                            error-count 0
                            stamp-unrecognized-flag-count 0
                            stamp-malformed-flag-count 0
                            zero-or-negative-delay-count 0
                            duplicate-packet-count 0
                        }
                        index 2 {
                            end-timestamp-utc 1970-01-01T00:00:00.000Z
                            window-state in-progress
                            transmitted-packets 1
                            received-packets 1
                            minimum 0
                            maximum 0
                            average 0
                            result 0
                            integrity false
                            error-count 0
                            stamp-unrecognized-flag-count 0
                            stamp-malformed-flag-count 0
                            zero-or-negative-delay-count 0
                            duplicate-packet-count 0
                        }
                    }
                }
            }
        }
    }

    link-measurement {
        measurement-template link-1 {
            admin-state enable
            sample-window {
                multiplier 30
                window-integrity 70
                threshold {
                    absolute 50
                }
            }
            ip {
                destination-udp-port 862
                ttl 1
            }
            pdu-type {
                stamp {
                }
            }
        }
        interface lm01 {
            interface-ref {
                interface ethernet-1/1
                subinterface 1
            }
            dynamic-measurement {
                link-measurement {
                    link-measurement-template link-1
                }
                protocol {
                    ipv4 {
                        admin-state enable
                        destination-ip 192.168.1.2
                        source-ip 192.168.1.1
                    }
                }
            }
        }
    }
Displaying link measurement resources
--{ + candidate shared default }--[  ]--
# info with-context from state oam link-measurement resources
    oam {
        link-measurement {
            resources {
                template {
                    in-use 1
                }
                interface {
                    in-use 1
                }
            }
        }
    }
Displaying link measurement interface operation state table
This example shows the link measurement interface operation state table.
--{ + candidate shared default }--[  ]--
# info from state oam link-measurement interface * | as table
+-----+------+----------+----------+----------+-------------+----------+----------+-----------+
|Name |Oper- |Detectable|Stamp-    |Reporting |Last-reported| Report-  | Sample-  |Operational|
|     |state |transmit  |session-  |          |dynamic      | timestamp| newest-  |  failure  |
|     |      |error     |identifier|          |delay        |          |  index   |           |
+=====+======+==========+==========+==========+=============+==========+==========+===========+
|lm001| down | subinter |    0     | false    |    none     | 1970-01- |    0     | template  |
|     |      | face-    |          |          |             | 01T00:00 |          | -admin-   |
|     |      | down     |          |          |             | :00.000Z |          | down      |
|lm01 | up   | subinter |  1000    | false    |    none     | 1970-01- |   1249   |           |
|     |      | face-    |          |          |             | 01T00:00 |          |           |
|     |      | down     |          |          |             | :00.000Z |          |           |
+-----+------+----------+----------+----------+-------------+----------+----------+-----------+
Displaying link measurement interface statistics aggregate sample window table
This example shows the link measurement interface statistics aggregate sample window table.
--{ + candidate shared default }--[  ]--
# info from state oam link-measurement interface * statistics aggregate-sample-window index * |
as table
+---------+---------+----------+---------+---------+----+----+---------+---------+---------+
|Interface|  Index  | End-time | Window- | Sample- | Min| Max| Average | Result  |Integrity|
|         |         | stamp-   |  state  | window- |    |    |         |         |         |
|         |         |   utc    |         |  count  |    |    |         |         |         |
+=========+=========+==========+=========+=========+====+====+=========+=========+=========+
| lm01    |      89 |2025-01-  |completed|    0    |  0 |  0 |    0    |    0    | true    |
|         |         |27T19:4   |         |         |    |    |         |         |         |
|         |         |8:19.00 0Z|         |         |    |    |         |         |         |
| lm01    |      90 |2025-01-  |completed|    0    |  0 |  0 |    0    |    0    | true    |
|         |         |27T19:5   |         |         |    |    |         |         |         |
|         |         |0:19.00 0Z|         |         |    |    |         |         |         |
+---------+---------+----------+---------+---------+----+----+---------+---------+---------+
Displaying link measurement interface statistics sample window table
This example shows the link measurement interface statistics sample window table.
--{ + candidate shared default }--[  ]--
# info from state oam link-measurement interface * statistics sample-window index * | as table
+-------+-------+---------+---------+--------+-------+----+----+-------+-------+-------+-------+
| Inter | Index |End-time |Window   |Trans-  |Recei- | Min| Max|Average|Result | Integ | Error |
| face  |       |stamp-utc|state    |mitted- |ved-   |    |    |       |       | rity  |   -   |
|       |       |         |         |packets |packets|    |    |       |       |       | count |
+=======+=======+=========+=========+========+=======+====+====+=======+=======+=======+=======+
| lm01  |  1333 |2025-01  |completed|     0  |     0 |  0 |  0 |     0 |       | true  |     0 |
|       |       |27T20    |         |        |       |    |    |       |       |       |       |
|       |       |:32:2    |         |        |       |    |    |       |       |       |       |
|       |       |9.000 z  |         |        |       |    |    |       |       |       |       |
| lm01  |  1334 |2025-01  |completed|     0  |     0 |  0 |  0 |     0 |       | true  |     0 |
|       |       |27T20    |         |        |       |    |    |       |       |       |       |
|       |       |:32:3    |         |        |       |    |    |       |       |       |       |
|       |       |9.000 z  |         |        |       |    |    |       |       |       |       |
| lm01  |  1335 |2025-01  |completed|     0  |     0 |  0 |  0 |     0 |       | true  |     0 |
|       |       |27T20    |         |        |       |    |    |       |       |       |       |
|       |       |:32:4    |         |        |       |    |    |       |       |       |       |
|       |       |9.000 z  |         |        |       |    |    |       |       |       |       |
+-------+-------+---------+---------+--------+-------+----+----+-------+-------+-------+-------+
Displaying link measurement LAG micro-session and resource state
--{ + candidate shared default }--[  ]--
# info from state with-context oam link-measurement interface lm01 lag-micro-sessions lag lag1 member ether
net-1/2
    oam {
        link-measurement {
            interface lm01 {
                lag-micro-sessions {
                    lag lag1 {
                        member ethernet-1/2 {
                            oper-state up
                            aggregate-newest-index 17
                            sample-newest-index 202
                            stamp-session-identifier 0
                            detectable-transmit-error interface-down
                            sender-micro-session-id 1
                            reflector-micro-session-id 0
                            reflector-micro-session-id-change-count 0
                            frame-discards {
                                sender-micro-session-id-zero 0
                                reflector-micro-session-id-zero 0
                                sender-micro-session-id-mismatch 0
                            }
                            statistics {
                                aggregate-sample-window {
                                    index 1 {
                                        end-timestamp-utc 2026-10-05T16:39:34.000Z
                                        window-state completed
                                        sample-window-count 0
                                        minimum 0
                                        maximum 0
                                        average 0
                                        result 0
                                        integrity true
                                    }
                                    index 2 {
                                        end-timestamp-utc 2026-10-05T16:45:34.000Z
                                        window-state completed
                                        sample-window-count 0
                                        minimum 0
                                        maximum 0
                                        average 0
                                        result 0
                                        integrity true
                                    }
                                    index 3 {
                                        end-timestamp-utc 2026-10-05T16:51:34.000Z
                                        window-state completed
                                        sample-window-count 0
                                        minimum 0
                                        maximum 0
                                        average 0
                                        result 0
                                        integrity true
                                    }
snip----------

                                    index 202 {
                                        end-timestamp-utc 1970-01-01T00:00:00.000Z
                                        window-state in-progress
                                        transmitted-packets 0
                                        received-packets 0
                                        minimum 0
                                        maximum 0
                                        average 0
                                        result 0
                                        integrity false
                                        error-count 0
                                        stamp-unrecognized-flag-count 0
                                        stamp-malformed-flag-count 0
                                        zero-or-negative-delay-count 0
                                        duplicate-packet-count 0
                                    }
                                }
                            }
                        }
                    }
                }
            }
        }
    }
Performance monitoring
Performance monitoring encompasses a variety of tools and protocols designed to measure, report, analyze, and optimize network performance, allowing network administrators to detect and resolve issues proactively. This chapter provides information about delay and loss measurement as part of STAMP OAM performance monitoring.
STAMP OAM performance monitoring
The STAMP OAM performance monitoring architecture for gathering and computing Key Performance Indicators (KPIs) using standard protocols and a robust collection model consists of the following foundational components:
-
session: This is the overall collection of the test parameters, measurement intervals, thresholds and storage of results. It is the overall container that defines the attributes of the session.
-
standard performance monitoring packets: SR Linux supports STAMP to measure performance metrics such as delay and packet loss. See Session sender packet format and Session reflector packet format in the STAMP chapter for more information about STAMP test packets.
-
measurement interval: These are time-based non-overlapping windows that capture results that are received in that window of time.
-
data structures: These are the unique counters and measurement results that represent the specific protocol.
-
bin group: These are ranges in microseconds that count the results that fit into the range.
The following figure shows the hierarchy of the architecture. This figure intends to show the relationship between the components and not to depict all the details of the required parameters.
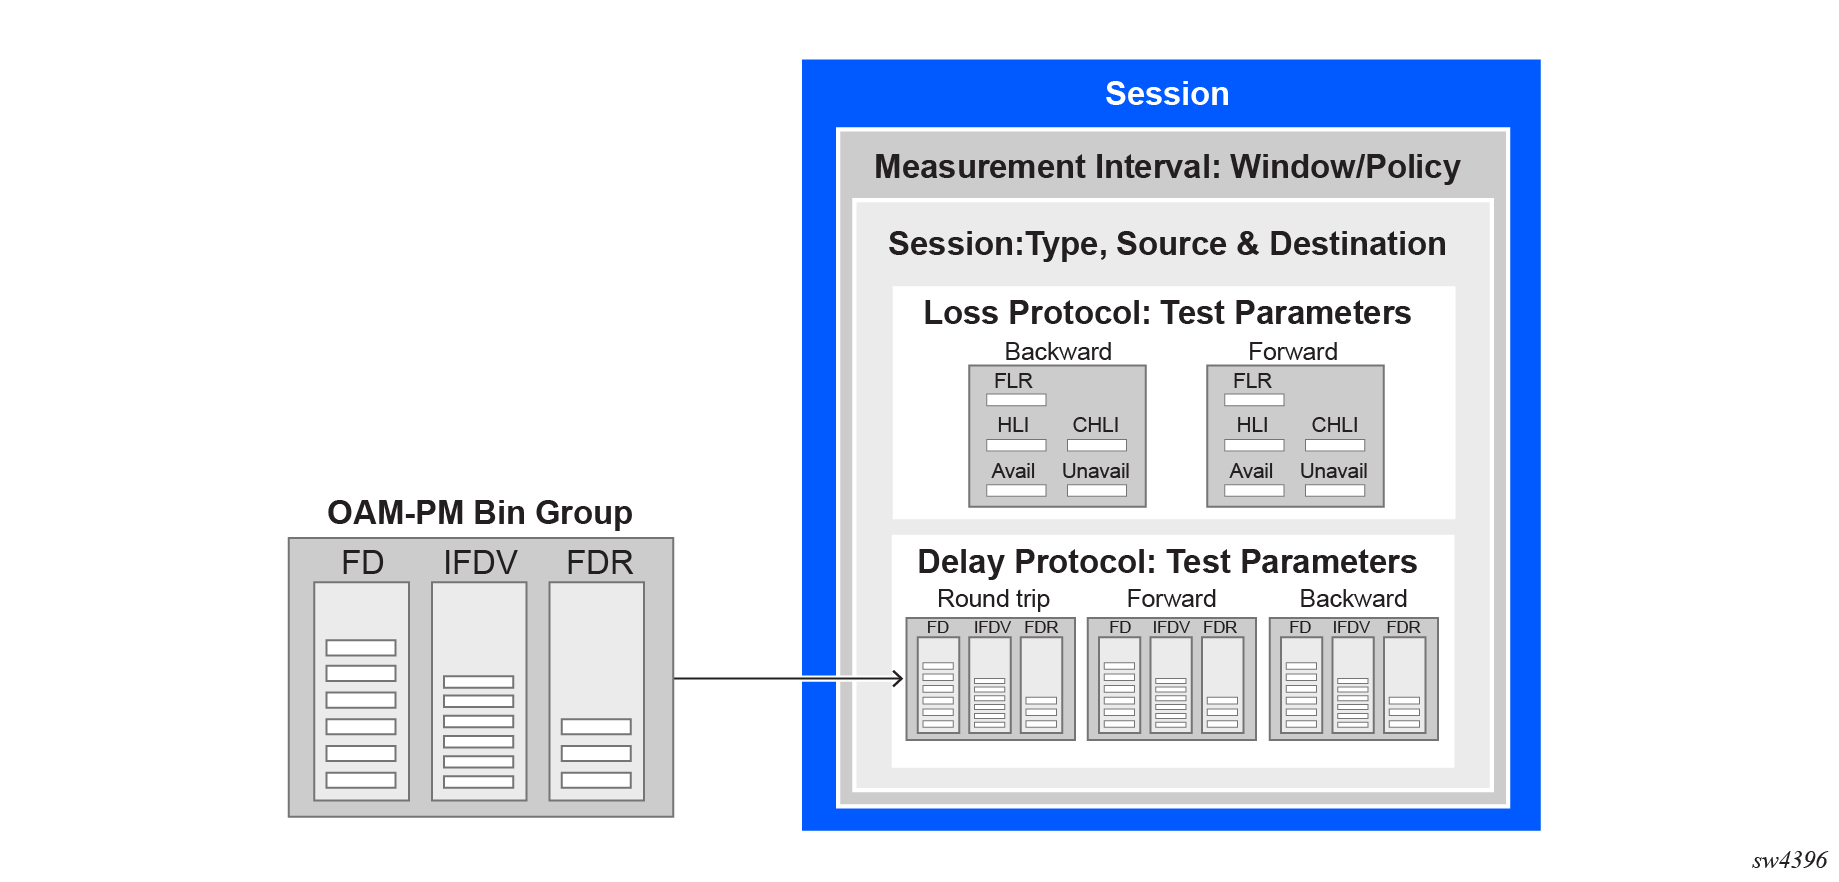
Session
The session is the overall collection of test information fields. The session can be viewed as the single container that combines all aspects of individual tests and the various OAM-PM components. The session command includes parameters such as:
-
session-type: The session type is either proactive or on-demand. The session type setting influences the individual test timing parameters.
-
test-id: The test identifier is a configured numerical value or using the auto keyword. An automatically assigned test-id is released when the test is deleted. Any action that causes the test to be deleted and recreated releases the original test identifier and allocates a new one. These test identifiers are not persistent and not maintained across CPM switchovers. New test identifiers are allocated in the case of CPM switchover.
-
test parameters: These include start time, stop time, ability to activate a test, and ability to deactivate a test.
-
measurement-interval: This is the assignment of collection windows to the session with the appropriate configuration parameters .
Session types and operational states
The operational state of a session is influenced by:
-
session type
-
session administrative state
In a proactive session, the operational state is up when the administrative state is enabled. The operational state is down when the administrative state is disabled. A proactive test session starts immediately after the oam performance-monitoring ip session stamp admin-state command is set to enable. A proactive test session stops immediately after the oam performance-monitoring ip session stamp admin-state command is set to disable. The operational state of a proactive session mirrors the administrative state of the session.
-
the completion of the test-duration configured using the oam performance-monitoring ip session session-type on-demand stamp test-duration command
-
the execution of the tools oam performance-monitoring ip session on-demand-action stop command
Standard PM packets
-
session sender packet: test request packets that the session sender transmits to the session reflector.
-
session reflector packet: test response packets that the session reflector sends to the session sender.
Data structures
There are two main metrics that are the focus of OAM performance monitoring: delay and loss.
Delay metrics
-
Frame Delay (FD): This measures the time taken for a packet to traverse the network. Any negative FD values are set to zero for binning purposes.
-
Frame Delay Range (FDR): This represents the difference between the FD and the lowest FD recorded within a measurement interval. For the first interval, the minimum delay is set to zero. For subsequent intervals, the minimum delay of the previous measurement interval is used as the reference. Negative FD values are set to zero before calculating FDR.
-
Inter-Frame Delay Variation (IFDV): Also known as jitter, IFDV measures the variation in delay between adjacent test frames. The absolute difference between the current and previous delay values is calculated, even if the previous delay was negative.
By default, the average for all delay metrics includes all the results within the measurement interval. However, it is possible to exclude the measurements using exclude-from-average for a specified direction. The results are binned but the delay values included in the exclude option are not included in the average computation.
Loss metrics
SR Linux supports the following loss metrics:
-
out loss: This metric measures the difference between the packets that the session reflector receives and those that the session sender transmits.
-
in loss: This metric calculates the difference between the packets that the session sender receives and those that the session reflector transmits.
-
Frame Loss Ratio (FLR): This percentage metric represents the ratio of lost packets during times of availability. FLR is not incremented during periods of unavailability.
-
available: The number of delta-ts that are recorded as available. These delta-ts do not exceed the FLR threshold and do not follow an unavailable state. If the available delta-ts follow an unavailable state, they need to fill the availability window before transitioning to available.
-
unavailable: The number of delta-ts that are recorded as unavailable. These delta-ts exceed the FLR threshold and do not follow an available state. If the unavailable delta-ts follow and available state, they need to fill the unavailability window before transitioning to unavailable.
-
undetermined availability: This counter increments when packets are lost and there is no explicit information about the fate of the packet. This occurs after timeouts and follows an available state.
-
undetermined unavailability: Similar to undetermined availability, this counter increments after packet timeouts following an available state when there is no explicit information about the fate of the packet.
-
High Loss Interval (HLI): This increments when individual delta-ts reach or exceed the FLR configuration. By default, this is calculated during the availability periods. Executing the oam performance-monitoring ip session stamp loss hli-force-count command and configuring the true option increments the HLI regardless of the availability state.
-
Consecutive High Loss Interval (CHLI): This increments when consecutive HLI intervals meet or exceed a specified threshold within the sliding window. CHLI increments only a single time for each availability window.
Measurement intervals
A measurement interval is a window of time that compartmentalizes the gathered measurements for an individual test that has occurred during that time. Allocation of measurement intervals, which equates to system memory, is based on the metrics being collected. This means that when both delay and loss metrics are collected, they allocate their own set of measurement intervals.
Duration
The measurement interval durations are as follows:
-
1-min
-
5-min
-
15-min
-
1-hour
-
1-day
Boundary type
The boundary-type parameter defines the start of the measurement interval and can be aligned to the local time-of-day clock, with or without an optional offset. By default, the start boundary is clock-aligned without an offset. When this configuration is deployed, the measurement interval establishes non-overlapping time-based windows which complete at the specified time. The boundary-type parameter can be aligned using the test-aligned option, which means that the start of the measurement interval coincides with the activation of the test and the length of the measured interval determines the completion.
Clock aligned
When a boundary is clock-aligned and clock-offset option is configured, a specified amount of time is applied to the measurement interval. Offsets are configured on a per-measurement interval basis and only applicable to clock-aligned measurement intervals. Only offsets less than the measurement interval duration are allowed. The following table lists examples of the start times of each measurement interval.
| Offset | 1-min | 15-min | 1-hour | 1-day |
|---|---|---|---|---|
|
0 (default) |
0, 1, 2, 3, ... |
00, 15, 30, 45 |
00 (top of the hour) |
midnight |
|
10 minutes |
rejected |
10, 25, 40, 55 |
10 min after the hour |
10 min after midnight |
|
30 minutes |
rejected |
rejected |
30 min after the hour |
30 min after midnight |
|
60 minutes |
rejected |
rejected |
rejected |
01:00 AM |
Test aligned
Although test-aligned approaches may seem beneficial for simplicity, there are some drawbacks that need to be considered. The goal of the time-based and well-defined collection windows allows for the comparison of measurements across common windows of time throughout the network and for relating different tests or sessions. On-demand tests are typically used for troubleshooting or short term monitoring that does not require alignment or comparison to other PM data and may make better use of the test-aligned boundary.
Intervals stored
The statistical data collected and the computed results from each measurement interval are maintained in volatile system memory . The number of intervals stored is configurable per measurement interval. Different measurement intervals have different defaults and ranges. The interval-stored parameter defines the number of completed individual test runs to store in volatile memory. There is an additional allocation to account for the active measurement interval.
If the retained test data for a measurement interval consumes the final entry, any subsequent entries cause the removal of the oldest data.
Threshold events
The following are the two types of threshold events:
-
stateless. The stateless threshold events are:
-
autonomous. Each measurement interval operates independently without carrying forward any information about events from previous intervals.
-
self-contained. The events are evaluated and triggered within the confines of a single measurement interval.
-
enacted when clear-threshold is unset.
-
-
stateful. The stateful threshold events are:
-
persistent. The events remain active until specific clear-threshold conditions are met at the end of a subsequent interval.
-
-
enacted when the clear-threshold is set within the configured range. A value of zero indicates the event clears if no results fall within the specified range in a subsequent interval.
-
Delay event
-
Frame Delay (FD)
-
Frame Delay Range (FDR)
-
Inter-Frame Delay Variation (IFDV)
Each of these delay threshold events are raised a single time in a measurement interval immediately after the threshold is reached.
Loss events
The types of loss events are as follows:
-
Counter-based events. These are simple counts that compare to the raise-threshold for raising and the clear-threhsold for clearing. The standard directions, forward and backward as well as a mathematical aggregate that is computed by summing the forward and backward values, are supported. Each of these loss threshold events are raised a maximum of one time in a measurement interval when the count in the specified bins reach the raise-threshold.
-
High Loss Interval (HLI) event
-
Consecutive High Loss Interval (CHLI) event
-
unavailability event
-
undetermined availability event
-
undetermined unavailability event
-
-
Average Frame Loss Ratio (Avg-FLR) event. Unlike other loss events, the Avg-FLR event is raised only at the end of the measurement interval. This event does not support aggregated computation. It supports forward and backward directions.
Loss event template
The loss event template is created using the oam performance-monitoring ip loss loss-events-template command. All of the loss events are configured using this template. During loss measurement, the loss event template is referenced by a performance monitoring session.
The following considerations apply to loss event templates:
-
A loss event template cannot be deleted if it is referenced by a performance monitoring session.
-
A loss event template can be modified even if it is referenced by a performance monitoring session without disrupting the ongoing session.
-
The reference changes that include, adding a new reference or deleting an existing reference within a loss test session can be done without impacting the performance monitoring session or the loss test session.
-
The configuration changes made to loss event templates affect only the loss event function ensuring that performance monitoring continues seamlessly.
-
The operational states of the loss events transition based on the configuration changes and the timing of measurement intervals.
Bin group
A bin group is a collection of bins where each bin represents a range of delay values. When a delay measurement is performed, the delay results are stored in appropriate bins based on its value. This process is known as binning and it allows for a structured and aggregated view of delay performance over time. Bin groups are created using the oam performance-monitoring ip delay bin-group command and referenced by the session using the oam performance-monitoring ip session stamp delay bin-group command.
Bin type
There are three types of binnable delay metrics:
-
frame delay (FD)
-
inter-frame delay variation (IFDV)
-
frame delay range (FDR)
All bin types are available in the forward, backward, and round-trip directions. Each of these metrics can have up to ten bin groups configured to group the results.
Bin boundary
Bin groups are configured by indicating a lower boundary. Bin 0 has a lower boundary that is always zero and is not configurable. The microsecond range of the bins is the difference between the adjacent lower boundaries.
-
bin 0 captures all frame delay statistics results between 0 and 1 ms
-
bin 1 captures all results above 1 ms and below the bin 2 lower boundary, bin 2 is not shown
The last bin configured represents the bin that collects all the results at and above that lower-bound value. Not all ten bins have to be configured.
Each delay type requires their own values for the bin groups. It is not possible to configure a bin with different values for round-trip, forward, and backward. Consider the configuration of the boundaries that represent the important statistics for that specific requirement.
Bin group 1 is the default bin group. Every session requires a bin group to be assigned. By default, bin group 1 is assigned to every performance monitoring session that does not have a bin group explicitly configured. Bin group 1 cannot be modified. Bin group 1 is an automatically crated object and not visible in the configuration. If the bin-group 1 is added to the configuration only the mandatory default configuration values may be added. It bin-group 1 is added to the configuration its behavior will non default bin-groups.
Bin group behaviour
-
bin groups cannot be deleted if referenced by a performance monitoring session
-
bin groups cannot be disabled if referenced by a delay test with the admin-state parameter set to enable
- bin groups can be modified even if referenced by a delay test regardless of the admin-state parameter setting. Delay results for the performance monitoring session referencing a changed bin-group will be deleted and a new set of bins will start recording results.
-
bin group that is excluded from average can be modified even if referenced by a delay test with the admin-state parameter set to enable
- any changes to the attributes of the oam performance-monitoring ip delay bin-group bin-type delay-event command do not affect the performance monitoring session or test sessions
Configuring a STAMP OAM-PM session
To configure a STAMP OAM performance monitoring session, use the oam performance-monitoring ip session command and configure the parameters as shown in Configuring a STAMP OAM performance monitoring session.
A range of source UDP ports is allocated to STAMP. These must be assigned to the appropriate STAMP application before they can be configured under the application.
To allocate a source UDP port to the OAM STAMP application, use the oam ippm source-udp-port-pools port 64374 application-assignment oam-pm-ip command and configure the parameters as shown in the example, Allocating source UDP port to OAM PM application. Configuration of the source UDP port should only be used when explicitly required. If not configured, the source UDP port is dynamically allocated from the dynamic UDP port range by the OAM performance monitoring application.
Configuring a STAMP OAM performance monitoring session
This example configures a STAMP OAM performance monitoring session.
--{ + candidate shared default }--[  ]--
# info with-context oam performance-monitoring ip session session1
    oam {
        performance-monitoring {
            ip {
                session session1 {
                    description test
                    session-type proactive
                    destination-ip 10.2.1.2
                    destination-udp-port 862
                    source-ip 10.2.1.1
                    network-instance default
                    dscp CS6
                    profile in
                    ttl 255
                    measurement-interval 1-minute {
                        clock-offset 0
                        intervals-stored 32
                        threshold-alerts {
                            loss-event disable
                            delay-event disable
                        }
                    }
                    stamp {
                        admin-state enable
                        interval 1s
                        delay {
                            bin-group gp1
                        }
                        loss {
                            flr-threshold 10
                            hli-force-count true
                            timing {
                                frames-per-delta-t 10
                                consecutive-delta-t 5
                                chli-threshold 2
                            }
                        }
                    }
                }
            }
        }
    }
Allocating source UDP port to OAM PM application
This example allocates a source UDP port to the OAM PM application.
--{ + candidate shared default }--[  ]--
# info with-context oam ippm source-udp-port-pools
    oam {
        ippm {
            source-udp-port-pools {
                port 64374 {
                    application-assignment oam-pm-ip
                }
            }
        }
    }
Performing STAMP OAM-PM delay measurement
Perform the following steps to measure STAMP OAM-PM packet delay:
-
To configure a bin group, use the oam performance-monitoring ip delay
bin-group command and specify the parameters as shown in the
following example.
Configuring a bin group
--{ + candidate shared default }--[  ]--
# info with-context oam performance-monitoring ip delay bin-group gp1
    oam {
        performance-monitoring {
            ip {
                delay {
                    bin-group gp1 {
                        admin-state enable
                    }
                }
            }
        }
    }
-
To configure the bin type, use the oam performance-monitoring ip delay
bin-group bin-type command. Specify the delay event and exclude
from average parameters.
Configuring a bin type
--{ + candidate shared default }--[  ]--
# info with-context oam performance-monitoring ip delay bin-group gp1
    oam {
        performance-monitoring {
            ip {
                delay {
                    bin-group gp1 {
                        admin-state enable
                        bin-type fd {
                            bin 1 {
                                lower-bound 1000
                            }
                            bin 2 {
                                lower-bound 2000
                            }
                            bin 3 {
                                lower-bound 3000
                            }
                            bin 4 {
                                lower-bound 5000
                            }
                            bin 5 {
                                lower-bound 7000
                            }
                            bin 6 {
                                lower-bound 10000
                            }
                            bin 7 {
                                lower-bound 13000
                            }
                            bin 8 {
                                lower-bound 16000
                            }
                            bin 9 {
                                lower-bound 20000
                            }
                        }
                        bin-type ifdv {
                            bin 1 {
                                lower-bound 100
                            }
                            bin 2 {
                                lower-bound 200
                            }
                            bin 3 {
                                lower-bound 300
                            }
                            bin 4 {
                                lower-bound 400
                            }
                            bin 5 {
                                lower-bound 500
                            }
                            bin 6 {
                                lower-bound 600
                            }
                            bin 7 {
                                lower-bound 700
                            }
                            bin 8 {
                                lower-bound 800
                            }
                            bin 9 {
                                lower-bound 900
                            }
                        }
                    }
                }
            }
        }
    }
-
Perform one of the following:
-
To enable STAMP and configure the delay measurement parameters, use the
info oam performance-monitoring ip session stamp command
and specify the parameters as shown in the example.
Configuring STAMP parameters for delay measurement
--{ + candidate shared default }--[  ]--
A:srl1# info with-context oam performance-monitoring ip session session1
    oam {
        performance-monitoring {
            ip {
                session session1 {
                    destination-ip 192.0.2.1
                    destination-udp-port 862
                    source-ip 192.0.2.2
                    source-udp-port 64374
                    network-instance default
                    measurement-interval 1-minute {
                        boundary-type clock-aligned
                        clock-offset 0
                    }
                    stamp {
                        admin-state enable
                        test-id auto
                        interval 1s
                        delay {
                            bin-group gp1
                        }
                    }
                }
            }
        }
    }
-
Perform one of the following:
-
Perform one of the following:
Performing STAMP OAM-PM loss measurement
Perform the following steps to measure STAMP OAM-PM packet loss:
-
To configure a loss events template, use the oam
performance-monitoring ip loss loss-events-template command and
specify the loss event parameters as shown in the following example.
Configuring a loss events template
--{ + candidate shared default }--[  ]--
A:srl1# info with-context oam performance-monitoring ip loss loss-events-template temp1
    oam {
        performance-monitoring {
            ip {
                loss {
                    loss-events-template temp1 {
        avg-flr-event forward {
                            raise-threshold 3.000
                            clear-threshold 0.000
                        }
                        hli-event aggregate {
                            raise-threshold 10
                            clear-threshold 0
                        }
                    }
               }
            }
        }
    }
-
Perform one of the following:
-
To enable STAMP and configure the delay measurement parameters, use the
info oam performance-monitoring ip session stamp command
and specify the parameters as shown in the following example.
Configuring STAMP parameters for loss measurement
--{ + candidate shared default }--[  ]--
A:srl1# info with-context oam performance-monitoring ip session session1 stamp
    oam {
        performance-monitoring {
            ip {
                session session1 {
                    stamp {
                        admin-state enable
                        test-id auto
                        interval 1s
                        delay {
                            bin-group gp1
                        }
                        loss {
                            flr-threshold 10
                            hli-force-count true
                            loss-event temp1
                            timing {
                                frames-per-delta-t 10
                                consecutive-delta-t 5
                                chli-threshold 2
                            }
                        }
                    }
                }
            }
        }
    }
-
Perform one of the following:
-
Perform one of the following:
Displaying STAMP OAM-PM delay and loss measurement results
To display the results of STAMP OAM-PM delay and loss measurement, use the following commands:
- info from state oam performance-monitoring ip session - See Displaying the results of delay and loss measurement.
- info from state oam performance-monitoring ip session * | as table - See Displaying OAM-PM IP session information with session-type
- info from state oam performance-monitoring ip session * stamp delay measurement-result * index * | as table - See Displaying OAM-PM IP session state detailed information with transmit and receive
- info from state oam performance-monitoring ip session * stamp delay measurement-result * index * statistics bin-type * | as table- See Displaying OAM-PM IP session delay statistics
- info from state oam performance-monitoring ip session * stamp loss measurement-result * index * statistics | as table - See Displaying OAM-PM IP session loss statistics
Displaying the results of delay and loss measurement
The following example shows the results of delay and loss measurement.
--{ + candidate shared default }--[ ]--
# info from state with-context oam performance-monitoring ip session session1
oam {
performance-monitoring {
ip {
session session1 {
session-type proactive
destination-ip 192.0.2.1
destination-udp-port 862
source-ip 192.0.2.2
network-instance default
dscp CS6
profile in
ttl 255
measurement-interval 1-minute {
boundary-type clock-aligned
clock-offset 0
intervals-stored 32
threshold-alerts {
loss-event disable
delay-event disable
}
}
stamp {
admin-state enable
oper-state up
detected-tx-error none
test-id auto
test-id-in-use 2147483649
pad-tlv-size 0
interval 1s
statistics {
stamp-unrecognized-flag-received 0
stamp-malformed-flag-received 0
}
delay {
bin-group gp1
bin-group-binning active
measurement-result 1-minute {
newest-index 2
index 1 {
oper-state in-progress
suspect-status true
start-time 2024-06-21T19:02:22.000Z
elapsed-time 37
statistics {
frames-transmitted 37
frames-received 37
bin-type fd {
forward {
minimum 8
maximum 10
average 9
}
backward {
minimum 8
maximum 10
average 9
}
round-trip {
minimum 17
maximum 20
average 19
}
bin 0 {
forward-measurements 37
backward-measurements 37
round-trip-measurements 37
}
bin 1 {
forward-measurements 0
backward-measurements 0
round-trip-measurements 0
}
}
bin-type ifdv {
forward {
minimum 0
maximum 2
average 1
}
backward {
minimum 0
maximum 3
average 1
}
round-trip {
minimum 0
maximum 4
average 1
}
bin 0 {
forward-measurements 37
backward-measurements 37
round-trip-measurements 37
}
bin 1 {
forward-measurements 0
backward-measurements 0
round-trip-measurements 0
}
}
}
}
loss {
flr-threshold 10
hli-force-count true
loss-event temp1
timing {
frames-per-delta-t 10
consecutive-delta-t 5
chli-threshold 2
}
measurement-result 1-minute {
newest-index 2
index 1 {
oper-state in-progress
suspect-status true
start-time 2024-06-21T19:02:22.000Z
elapsed-time 37
statistics {
frames-transmitted 37
frames-received 37
forward {
out-loss 0
available 3
unavailable 0
undetermined-available 0
undetermined-unavailable 0
high-loss-intervals 0
consecutive-high-loss-intervals 0
minimum-frame-loss-ratio 0
maximum-frame-loss-ratio 0
average-frame-loss-ratio 0
}
backward {
in-loss 0
available 3
unavailable 0
undetermined-available 0
undetermined-unavailable 0
high-loss-intervals 0
consecutive-high-loss-intervals 0
minimum-frame-loss-ratio 0
maximum-frame-loss-ratio 0
average-frame-loss-ratio 0
}
}
}
}Displaying OAM-PM IP session information with session-type
The following example shows the OAM-PM IP session information.
--{ + candidate shared default }--[  ]--
# info from state oam performance-monitoring ip session * | as table
+------------+------------+------------+----------+------------+---------------+------------+
|  Session-  |  Session-  |   Stamp    |  Stamp   |   Stamp    |   Stamp       |   Stamp    |
|    name    |    type    |admin state |oper-state| detected-  |stamp session- | delay bin- |
|            |            |            |          |  tx-error  | identifier    |   group    |
+============+============+============+==========+============+===============+============+
| session1   | proactive  | enable     |    up    | none       |    1005       | gp1        |
|            |            |            |          |            |               |            |
+------------+------------+------------+----------+------------+---------------+------------+
Displaying OAM-PM IP session state detailed information with transmit and receive
The following example shows the OAM-PM IP session state detailed information with transmit and receive.
--{ + candidate shared default }--[  ]--
# info from state oam performance-monitoring ip session * stamp delay measurement-result
* index * | as table
+---------+---------+-----+---------+--------+---------------+-------+-----------+------------+
| Session | Measure |Index|  Oper-  |Suspect | Start time    |Elapsed|Statistics | Statistics |
|         |  ment-  |     |  state  |-status |               | -time |frames     | frames-    |
|         | result  |     |         |        |               |       |transmitted| received-  |
+=========+=========+=====+=========+========+===============+=======+===========+============+
|session 1|1- minute|  21 |completed| false  |2025-01-29T20:4|  60   |    0      |    0       |
|         |         |     |         |        |7:00.00 OZ     |       |           |            |
|session 1|1- minute|  22 |completed| false  |2025-01-29T20:4|  60   |    0      |    0       |
|         |         |     |         |        |8:00.00 OZ     |       |           |            |
|session 1|1- minute| 23  |completed| false  |2025-01-29T20:4|  60   |    0      |    0       |
|         |         |     |         |        |9:00.00 0Z     |       |           |            |
+---------+---------+-----+---------+--------+---------------+-------+-----------+------------+
Displaying OAM-PM IP session delay statistics
The following example shows the OAM-PM IP session delay statistics.
--{ + candidate shared default }--[  ]--
# info from state oam performance-monitoring ip session * stamp delay measurement-result
* index * statistics bin-type * | as table
+---------+------+------+------+------+------+------+------+------+------+------+------+------+
| Session | Meas | Index| Bin- | Forw | Forw | Forw | Back | Back | Back | Roun | Roun | Roun |
|         | urem |      | metr | ard  | ard  | ard  | ward | ward | ward |  d-  |  d-  |  d-  |
|         | ent- |      |  ic  | mini | maxi | aver | mini | maxi | aver | trip | trip | trip |
|         | resu |      |      | mum  | mum  | age  | mum  | mum  | age  | mini | maxi | aver |
|         |  lt  |      |      |      |      |      |      |      |      | mum  | mum  | age  |
+=========+======+======+======+======+======+======+======+======+======+======+======+======+
|session 1| 1-   |    1 | fdr  |    0 |    0 |    0 |    0 |    0 |    0 |    0 |    0 |    0 |
|         | minu |      |      |      |      |      |      |      |      |      |      |      |
|         | te   |      |      |      |      |      |      |      |      |      |      |      |
|session 1| 1-   |    1 | ifdv |    0 |    0 |    0 |    0 |    0 |    0 |    0 |    0 |    0 |
|         | minu |      |      |      |      |      |      |      |      |      |      |      |
|         | te   |      |      |      |      |      |      |      |      |      |      |      |
|session 1| 1-   |    2 | fdr  |    0 |    0 |    0 |    0 |    0 |    0 |    0 |    0 |    0 |
|         | minu |      |      |      |      |      |      |      |      |      |      |      |
|         | te   |      |      |      |      |      |      |      |      |      |      |      |
+---------+------+------+------+------+------+------+------+------+------+------+------+------+
Displaying OAM-PM IP session loss statistics
The following example shows the OAM-PM IP session loss statistics.
--{ + candidate shared default }--[  ]--
# info from state oam performance-monitoring ip session * stamp loss measurement-result * index * statistics | as table
+-------+--------+-----+-------+-------+----+-------+-------+-------+-----+-----+-----+-------+
|Session|Measu-  |Index|Frames-|Frames-|For-|Forward|Forward|Forward|Back-|Back-|Back-|Back-  |
|       |rement- |     |transm-|recei- |ward|minimum|maximum|average|ward-|ward-|ward |ward   |
|       |result  |     |itted  |ved    |out |frame  |frame  |frame  |in-  |min  |max  |average|
|       |        |     |       |       |loss|loss   |loss   |loss   |loss |frame|frame|frame  |
|       |        |     |       |       |    |ratio  |ratio  |ratio  |     |loss |loss |loss   |
|       |        |     |       |       |    |       |       |       |     |ratio|ratio|ratio  |
+=======+========+=====+=======+=======+====+=======+=======+=======+=====+=====+=====+=======+
| ip-1  |1-minute| 1   |    37 |    30 |  0 |     0 |     0 |     0 |   0 |   0 |   0 |     0 |
| ip-1  |1-minute| 2   |    60 |    60 |  0 |     0 |     0 |     0 |   0 |   0 |   0 |     0 |
| ip-1  |1-minute| 3   |    60 |    60 |  0 |     0 |     0 |     0 |   0 |   0 |   0 |     0 |
| ip-1  |1-minute| 4   |    60 |    60 |  0 |     0 |     0 |     0 |   0 |   0 |   0 |     0 |
| ip-1  |1-minute| 5   |    60 |    60 |  0 |     0 |     0 |     0 |   0 |   0 |   0 |     0 |
| ip-1  |1-minute| 6   |    60 |    60 |  0 |     0 |     0 |     0 |   0 |   0 |   0 |     0 |
+-------+--------+-----+-------+-------+----+-------+-------+-------+-----+-----+-----+-------+