Call trace
The cMAG-c supports call trace, an advanced debugging feature that supports tracing of CP packets and events during the lifetime of a session.
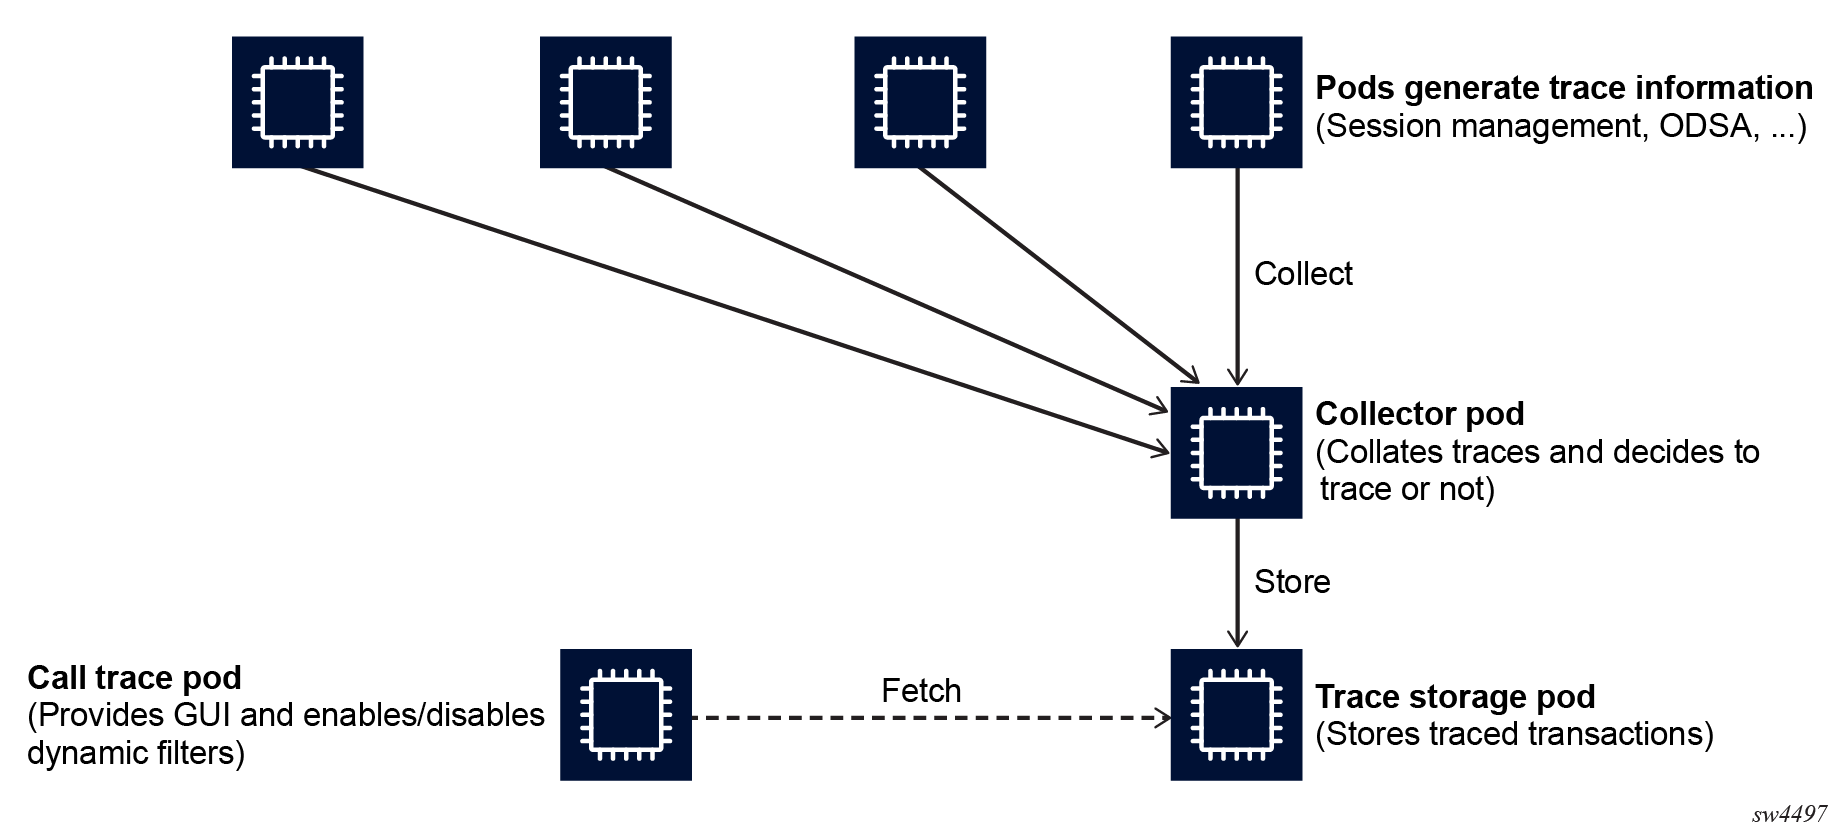
Call trace is an advanced debugging tool that provides detailed inspection of all the transactions of single sessions. It correlates multiple protocols and internal events in a single interface. All the pods that process call trace sessions decide whether a specific packet or event is traced. At a high-level, call trace consists of the following major elements:
- Pods, including the session management, ODSA, and so on, generate trace information.
- One or more collector pods collect the individual trace candidates and correlate them to a single transaction and session. When a transaction finishes, the pod makes the final decision about whether to trace or discard the transaction.
- A trace storage pod (tempo) stores all the traced transactions.
- The call trace pod provides a GUI to inspect the traced transactions and manage the capture filters.
The following figure shows the high-level elements for call tracing.
Always-on tracing
All the pods that participate in the processing of session transactions assess each transaction to determine whether it is subject to tracing. To ensure that every transaction is automatically subject to tracing, the always-on tracing mode is enabled by default. The user can change the configuration of this mode to conserve resources, as needed.
Every pod that participates in processing a session transaction must decide whether the transaction is potentially subject to tracing. The easiest way to accomplish this is to use the default always-on enabled tracing mode. This mode automatically assumes that every transaction is potentially subject to tracing.
Always-on tracing enabled
# info from running /subscriber-management call-trace always-on
    enabled {
    }
The benefit of always-on tracing is the traces are only evaluated upon finalizing a transaction. This allows advanced tracing capabilities such as the following:
- Trace transactions based on parameters that are not available in each packet, such as a username or subscriber name. See Managing session tracing filters for more information.
-
Trace any transaction that is considered failed, regardless of the point at which the failure occurs. See Enabling automatic tracing based on error conditions for more information.
The disadvantage of always-on tracing is it consumes resources to send transactions to the collector pods. If enough resources are available, Nokia recommends to keep always-on tracing enabled. However, if insufficient resources are available, you can completely disable always-on tracing.
Use the following CLI to disable always-on tracing. With this option, only the always-available filters are subject to tracing; see Managing session tracing filters.
Always-on tracing disabled
# info from running /subscriber-management call-trace always-on
    disabled
The always-on disable option only has an effect if a transaction does not match an always-available filter, as described in Managing session tracing filters. If a transaction matches an always-available filter, it is traced regardless of the enabled or disabled state of the always-on configuration.
Packet tracing
You can use the cMAG-c CLI to manage the configuration of the default call trace packet-tracing options.
By default, the cMAG-c captures packets as part of all the traced transactions. You can use the commands in the following context to change the packet-tracing properties.
subscriber-management call-trace packet-tracingThe following are examples of reasons you may want to disable packet capturing for traced transactions, and the properties to use to do so:
-
If you need to lower the resource impact of always-on tracing, use the packet-tracing default-off property. This disables the default packet-tracing functionality, while allowing session filters to explicitly enable packet tracing using the CLI or the GUI tool.
subscriber-management call-trace packet-tracing default-offSee Managing session tracing filters for information about how to configure call trace filters for specific sessions.
-
If you need to fully disable packet tracing to manage privacy or regulatory requirements, use the packet-tracing disallowed property. This disables all packet tracing, and prevents individual session filters from enabling it.
subscriber-management call-trace packet-tracing disallowed
Enabling automatic tracing based on error conditions
The cMAG-c provides the ability to configure automatic tracing based on error conditions, when always-on tracing is enabled. For example, it is possible to automatically trace any session transaction that leads to a failure, and to manage the duration of tracing transactions.
Enabling automatic tracing based on any error
When always-on tracing is enabled, it is possible to configure the tracing functionality to automatically trace any session transaction that leads to a failure. To enable tracing based on any error condition, set the any-error property to true.
subscriber-management call-trace any-error trueWhen any-error is enabled, the system traces any transaction that does not lead to an expected result, as internally determined by the cMAG-c; for example, a PFCP or RADIUS communication times out or is rejected.
Any-error tracing configuration
# info from running /subscriber-management call-trace
    any-error true
    always-on {
        enabled {
        }
    }
Configuring automatic tracing based on maximum duration
Maximum transaction duration configuration
# info from running /subscriber-management call-trace
    max-duration 5000
    always-on {
        enabled {
        }
    }
Managing session tracing filters
The cMAG-c provides session filters with configurable options for matching the sessions to trace. You can use the CLI or the cMAG-c Call Trace GUI tool to manage filters for session tracing.
It is possible to always trace specific sessions, whether they fail or not. To do this, use the CLI or the GUI tool to enable the applicable filters. Filters provisioned using the CLI are referred to as static filters, while filters provisioned using the GUI tool are referred to as dynamic filters. Static filters cannot be modified using the GUI and dynamic filters cannot be modified using the CLI.
A filter provides the following configurable properties for matching the sessions to trace:
- options that are always available:
- MAC address
- UP node ID
- Layer 2 access ID
- C-VLAN
- S-VLAN
- options that are only available when the always-on property is
enabled:
- subscriber name
- username
The configuration may include multiple options that must all match (logical AND) for a transaction to match the filter. A filter is considered always available only if all its configured options are always available. If even one option requires always-on tracing, the entire filter requires always-on tracing.
To administratively disable a static filter entry without removing it, specify the disable option for the admin-state command.
subscriber-management call-trace filter admin-state disableYou can use the GUI tool to administratively disable dynamic filters.
- Navigate to the cMAG-c Call Trace Configuration window in the GUI tool.
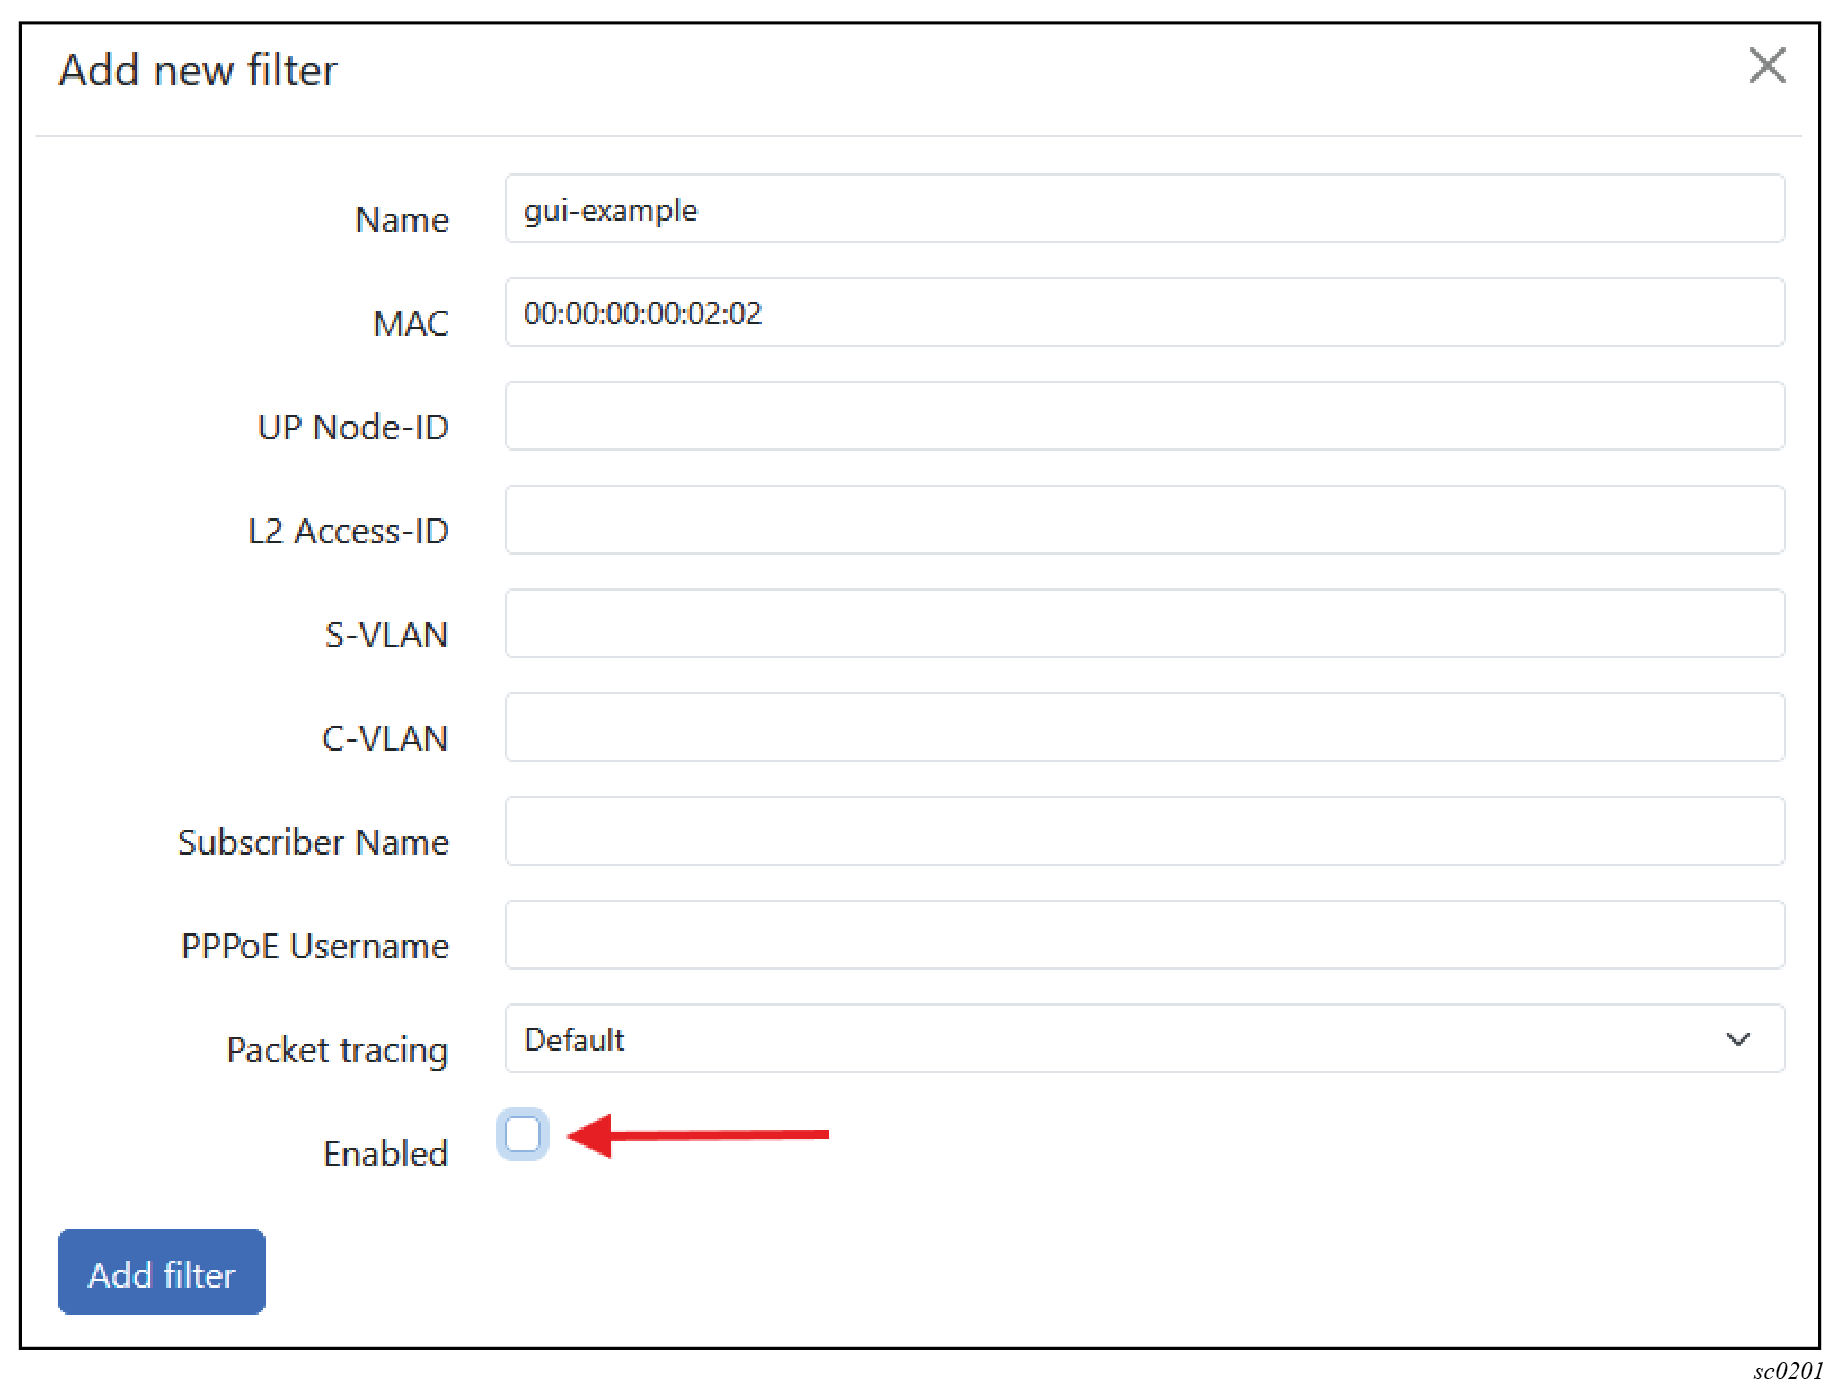
- Under Dynamic filters, select the edit icon beside the filter.
- Uncheck the Enabled check box in the Add new filter window; see the following figure.
Managing static filters using the CLI
See Managing session tracing filters to learn about managing specific session filters, if needed.
You can enable, modify, or delete a static call trace filter using the CLI.
-
Create or navigate to a filter entry.
subscriber-management call-trace filter namesubscriber-management call-trace filter example -
Specify the match options under the new filter entry.
The following example shows a configuration to capture transactions for sessions with a specific MAC address.
# info from running /subscriber-management call-trace filter example mac 00:00:00:00:01:01 - Commit the configuration.
- Optional:
If you want to delete a specific filter entry, use the following CLI to remove
it from the configuration.
subscriber-management call-trace delete filter example
Managing dynamic filters using the Call Trace GUI tool
See Managing session tracing filters to learn about managing specific session filters.
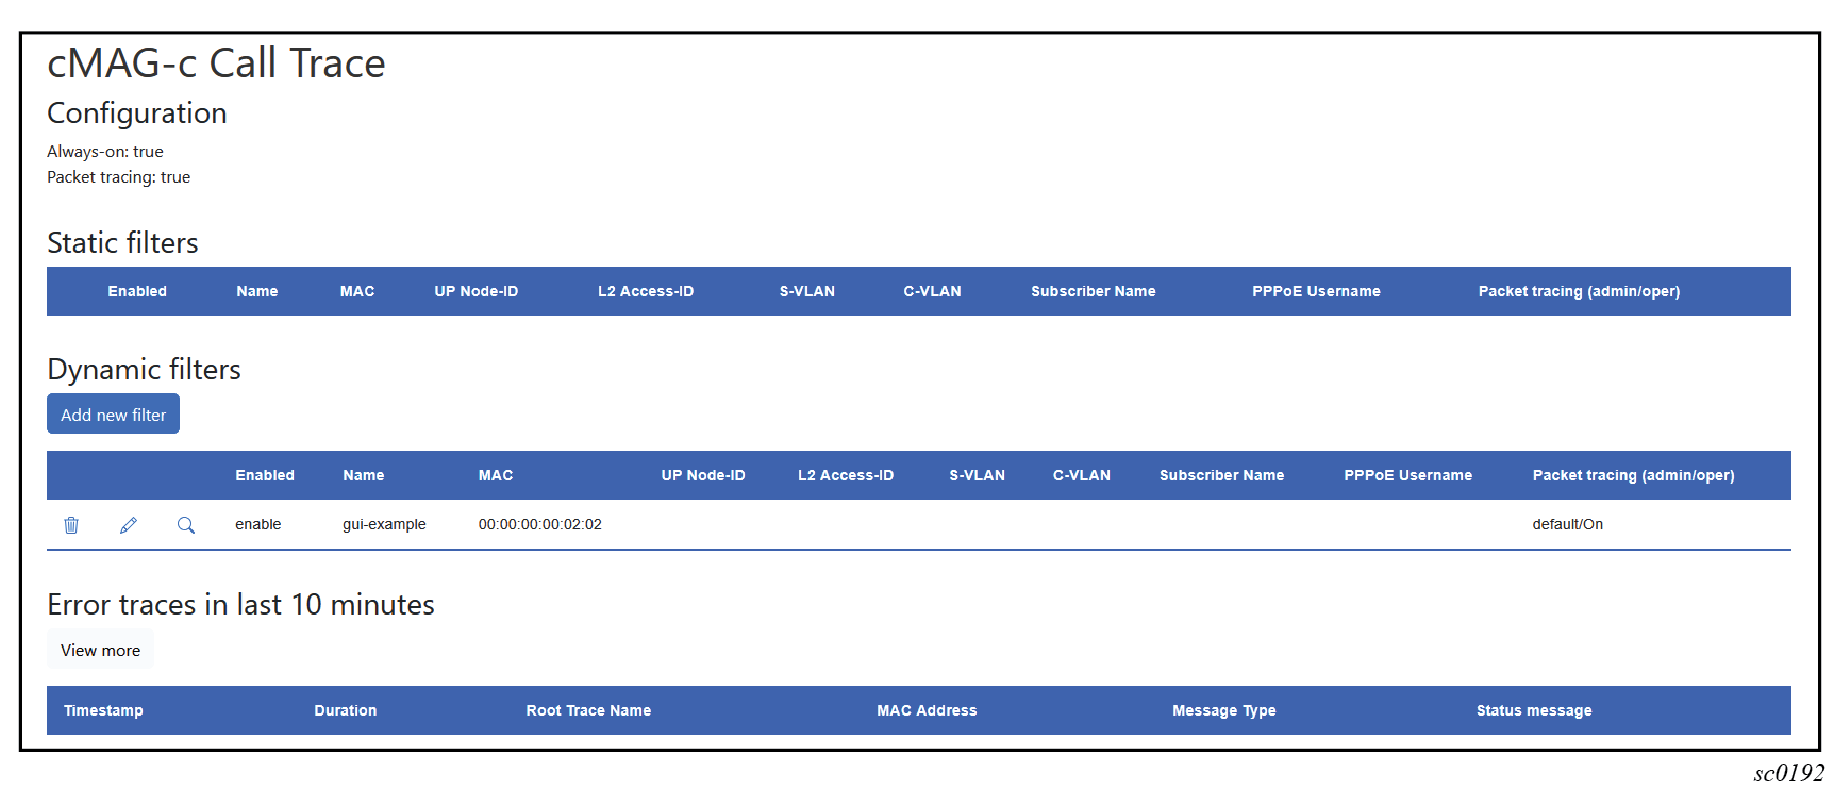
You can use the cMAG-c Call Trace GUI tool to create, modify, or delete dynamic call trace session filters.
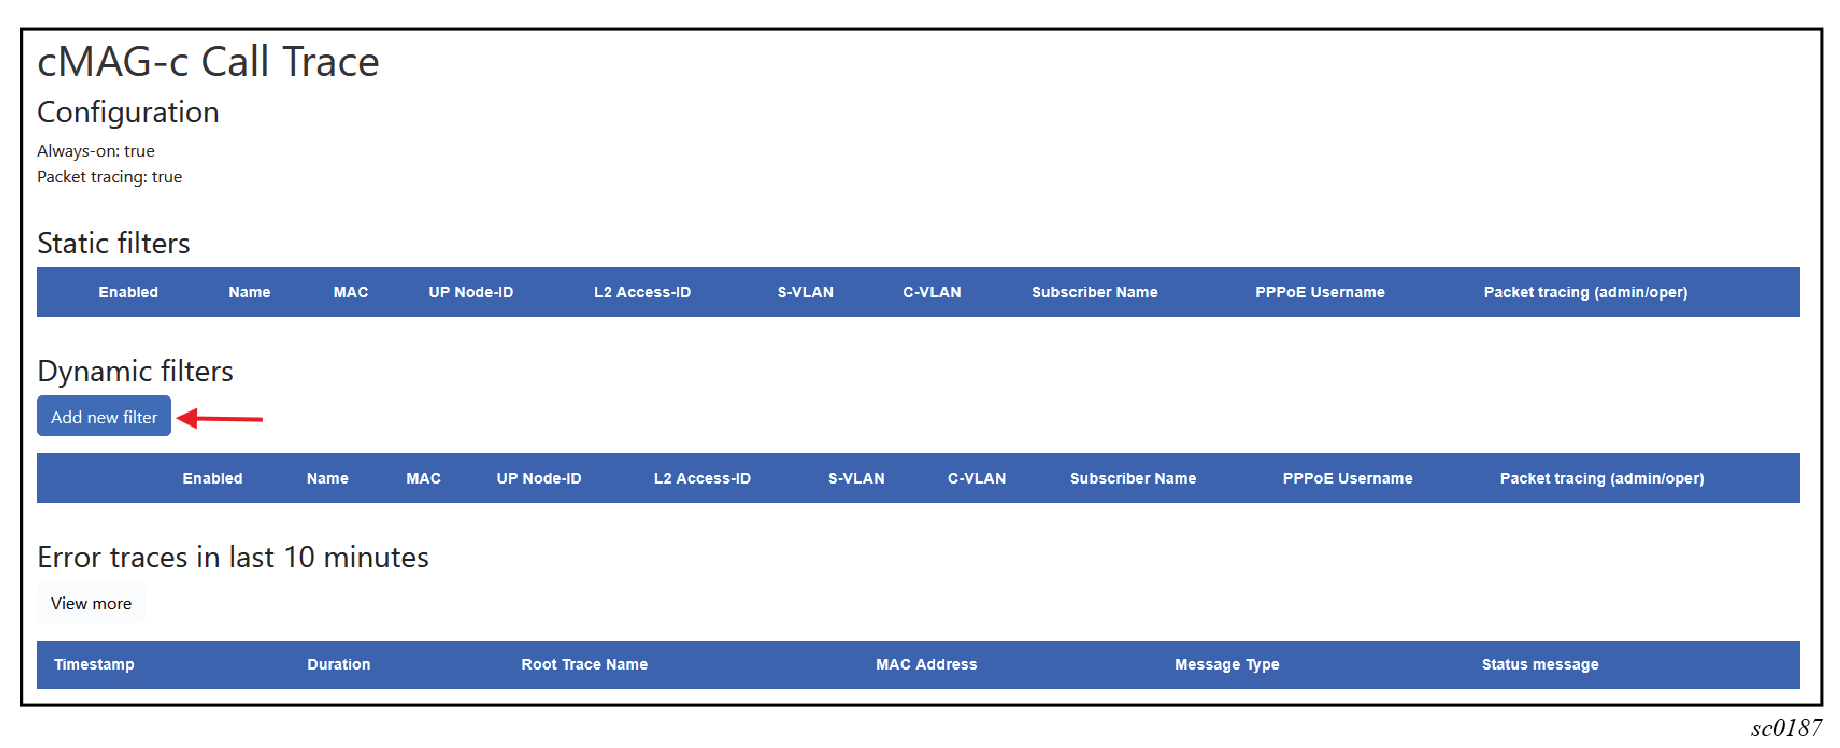
- Navigate to the cMAG-c Call Trace Configuration window in the GUI tool.
-
To add a new filter, use the following steps.
-
Under Dynamic filters, click the Add
new filter button.
-
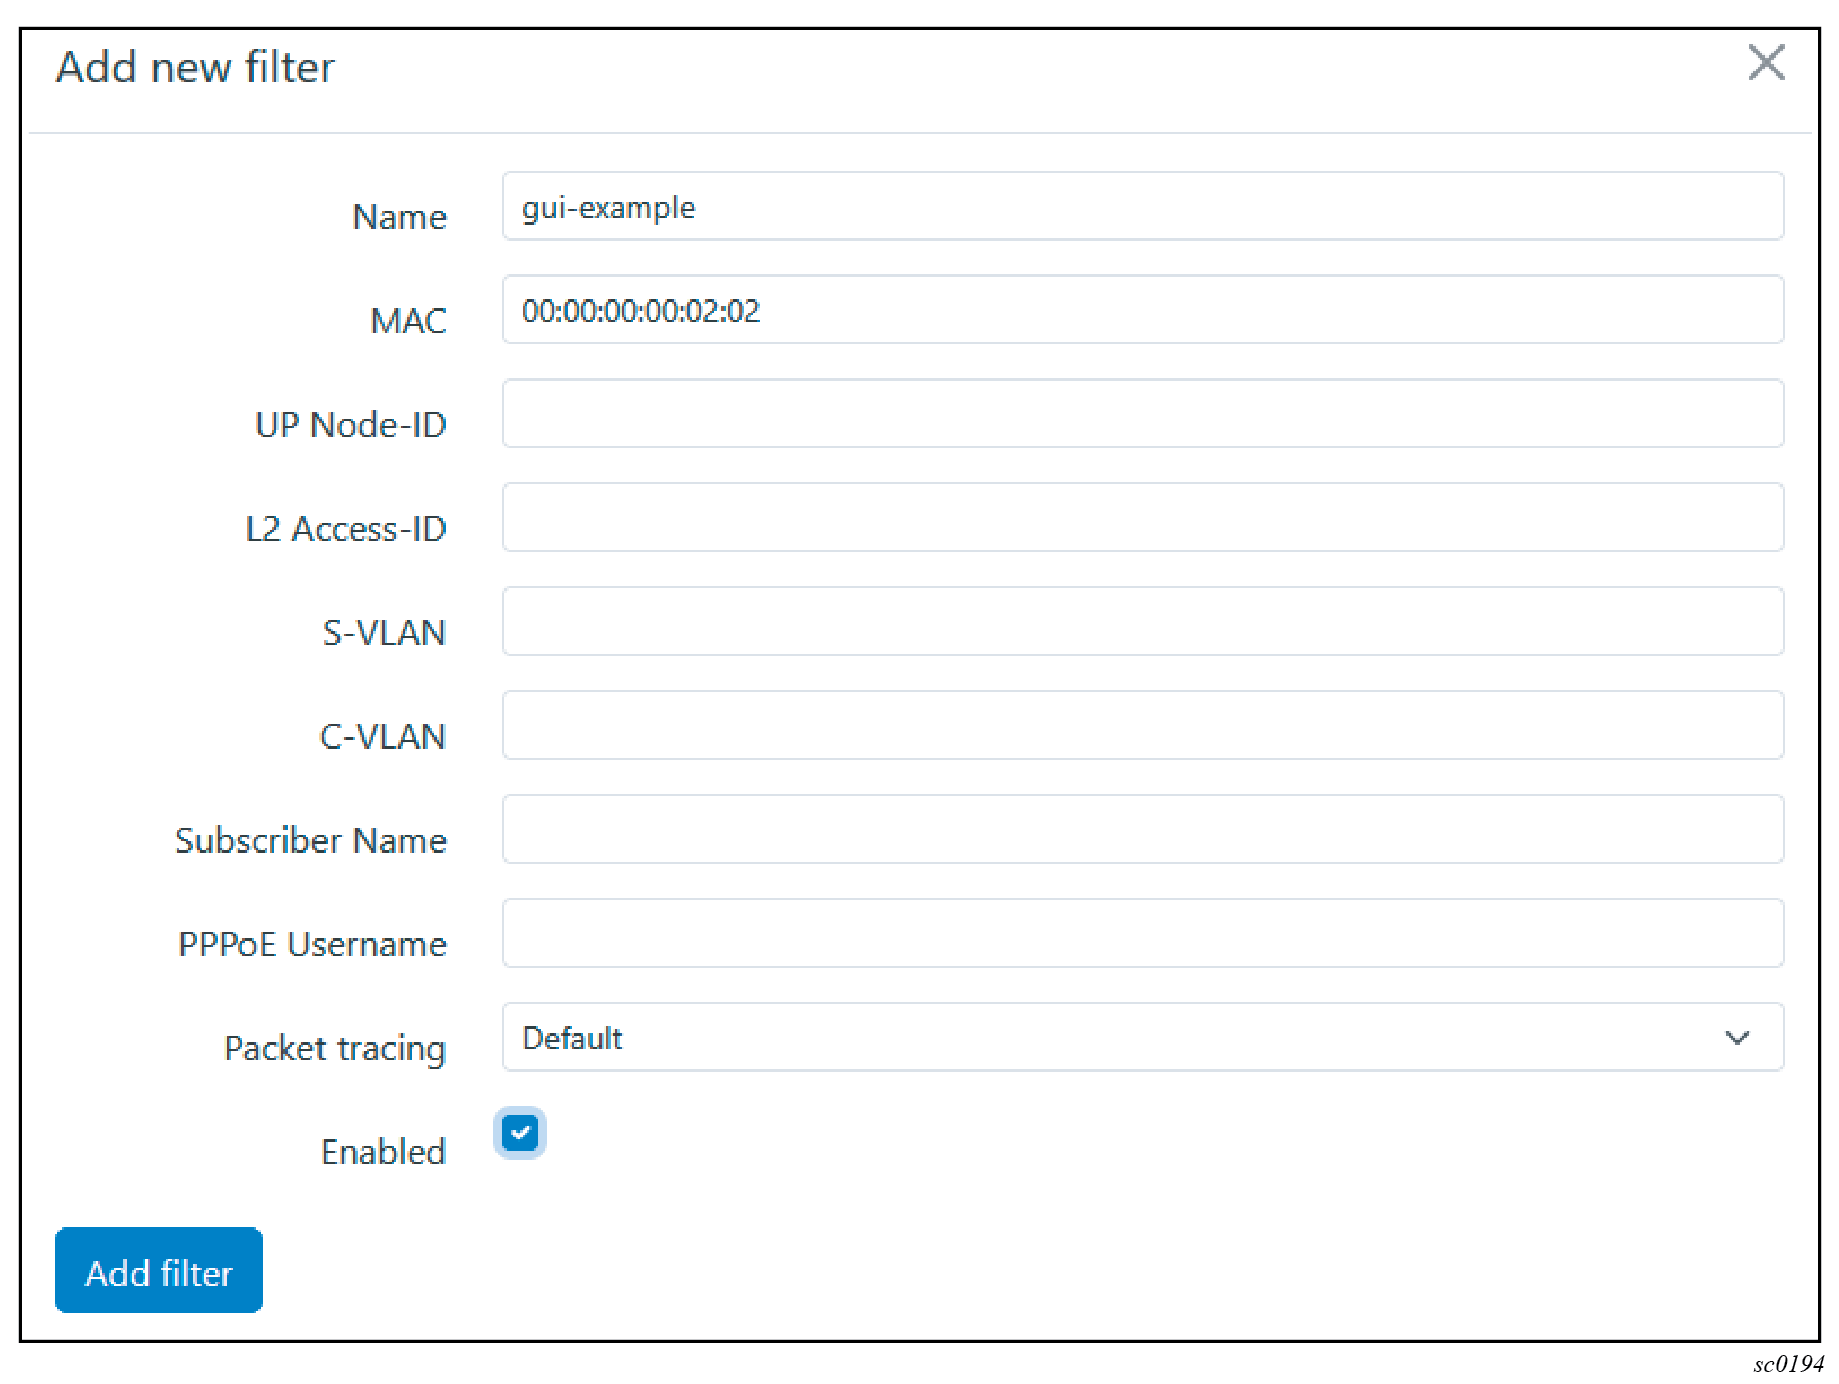
Enter the filter name in the form and at least one filter
parameter.
The subscriber name and username can only be entered if the always-on mode is enabled.
-
Click the Add filter button to create the new
filter entry.
The dynamic filter becomes visible in the list of filter entries.
-
Under Dynamic filters, click the Add
new filter button.
-
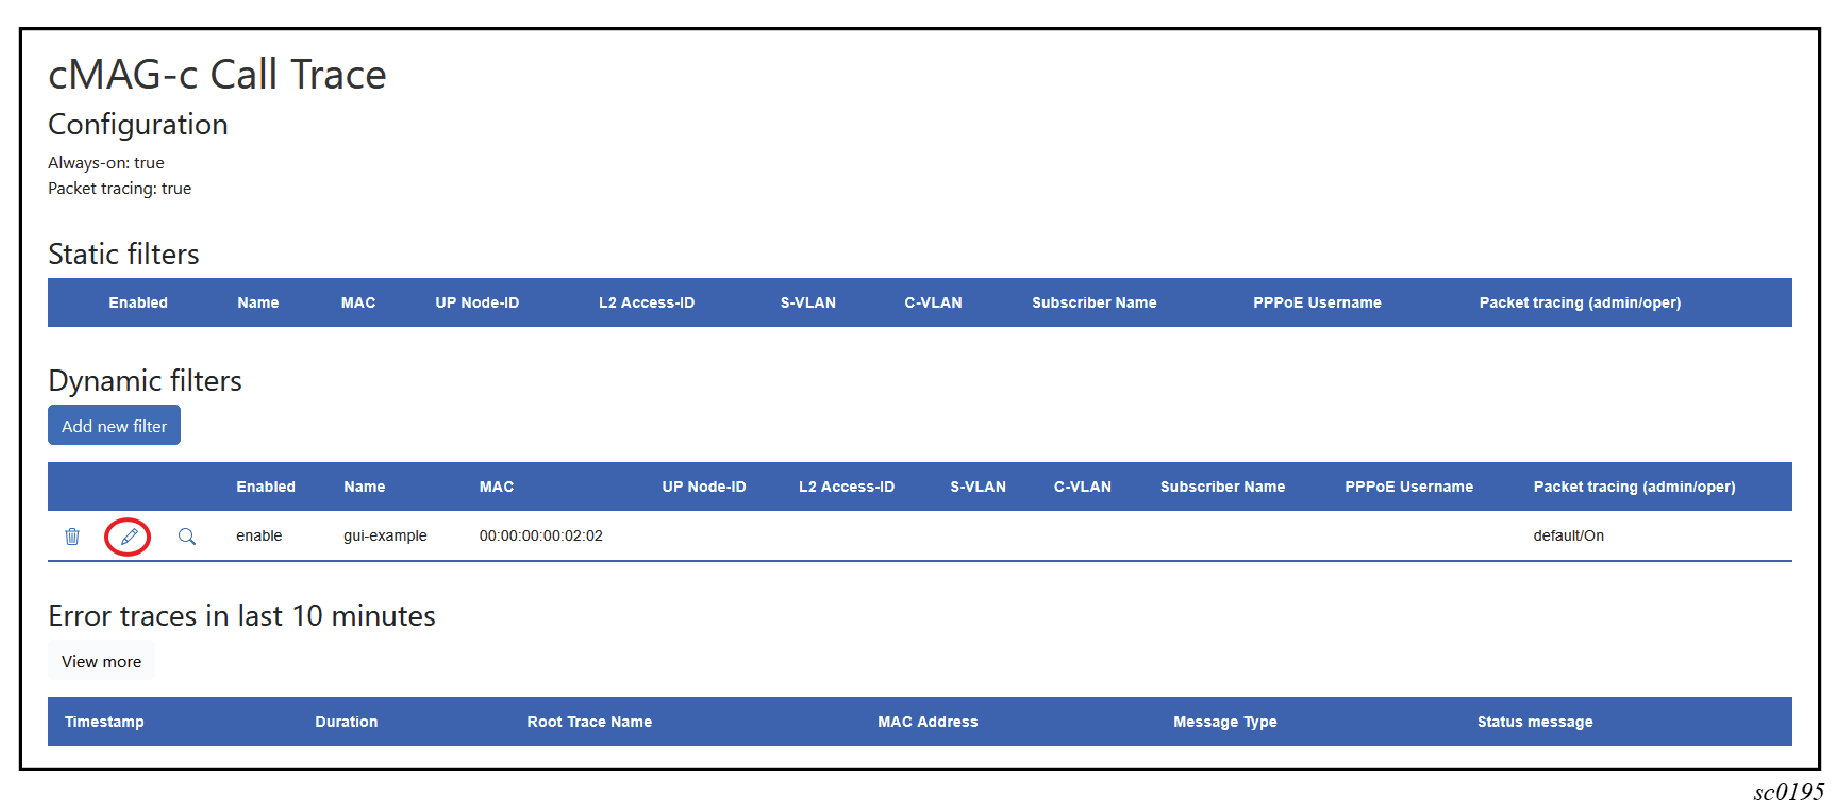
To modify an existing filter, use the following steps:
-
Select the edit icon next to the filter entry.
-
Change the filter information as needed and click the Add
filter button.
-
Select the edit icon next to the filter entry.
-
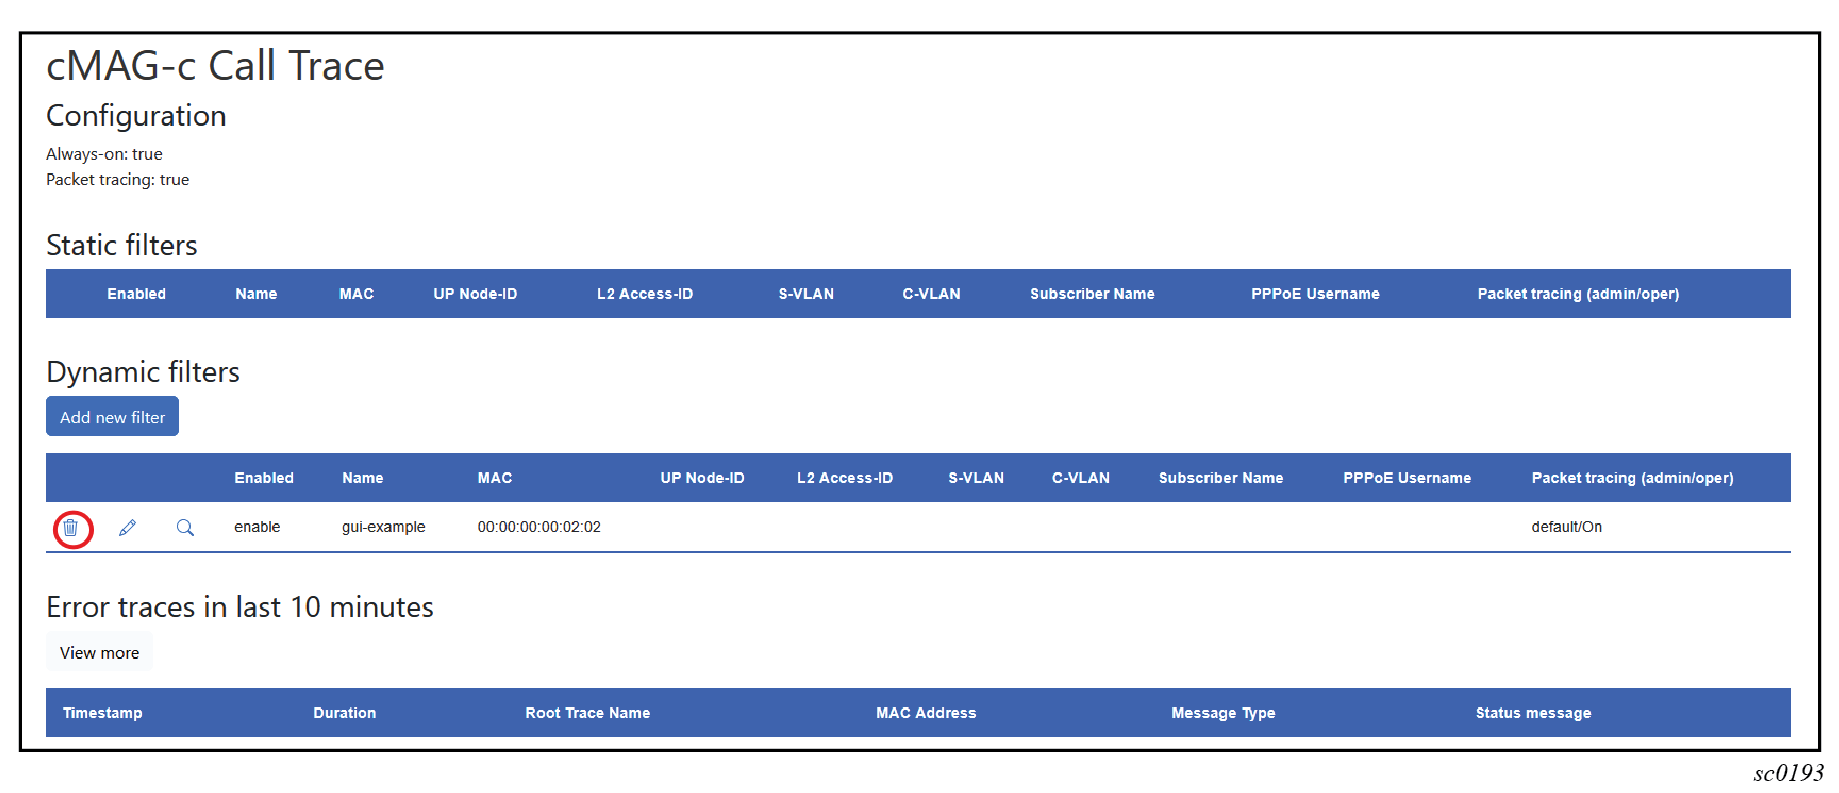
To delete a filter, do the following steps:
-
Select the delete icon beside the filter entry.
-
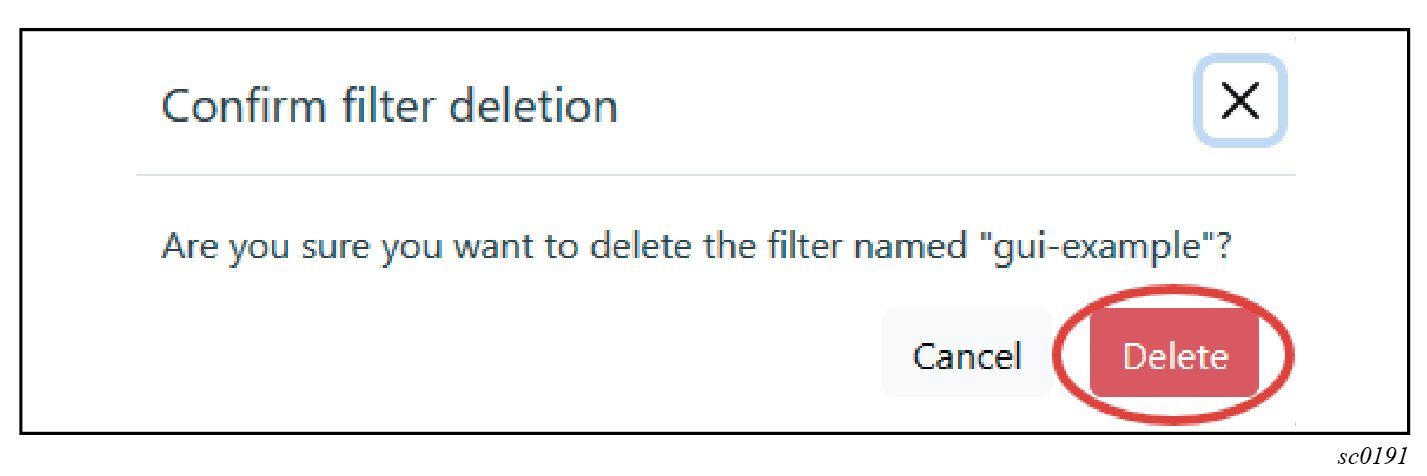
Select Delete to confirm that you want to
proceed with the deletion.
The following are examples of the conditions when an existing dynamic filter could become inconsistent with the base call trace configuration in CLI:
- The dynamic filter in the GUI is set to enable packet capture, while the CLI configuration is changed to always disallow packet capture.
- The dynamic filter in the GUI specifies a match criterion that requires always-on tracing, while the CLI configuration is changed to disable always-on tracing.
In cases such as these, the cMAG-c automatically disables the filters and no longer captures new transactions. However, the filters are not removed from the system and you can still inspect the previously-captured transactions.
-
Select the delete icon beside the filter entry.
Inspecting call trace captures
Use the Nokia Call Trace GUI tool to inspect the details of call trace captures.
Searching for session traces
Use the cMAG-c Call Trace GUI tool to locate and perform analysis of the call-trace captures for a session.
- Navigate to the Call Trace GUI tool.
-
Select the magnifying glass icon next to the filter to see all traces for the
filter.
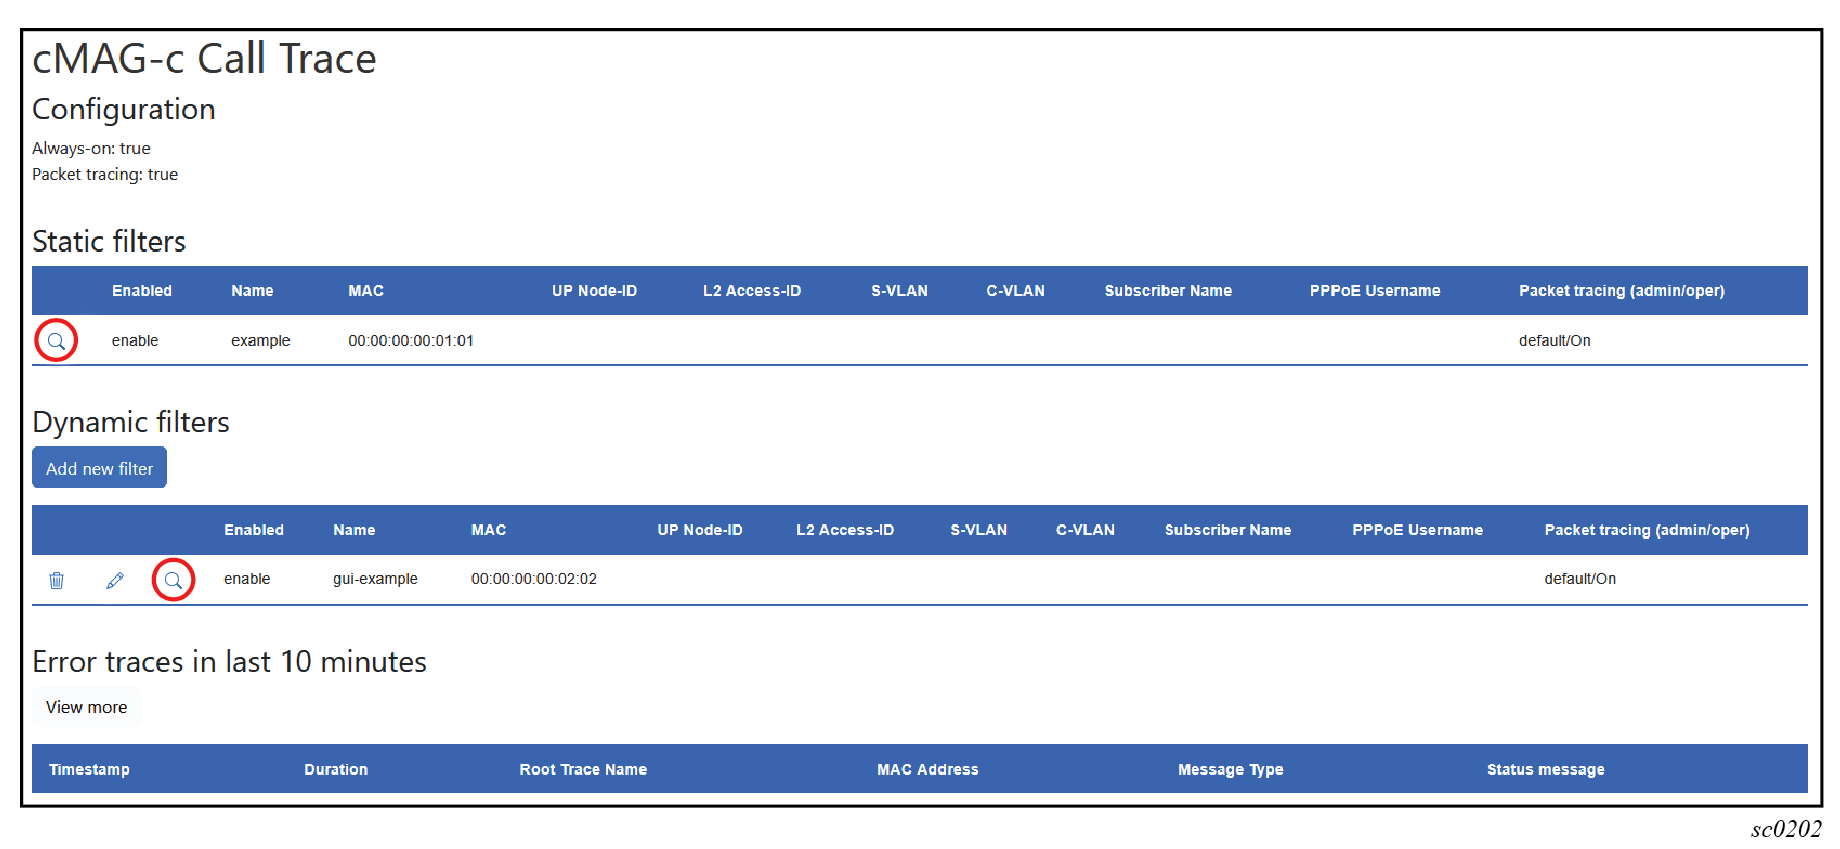 The GUI tool displays a list of captured transactions for the session with the following information:
- capture timestamp
- duration of the captured transaction
- incoming service that started the capture
- name of the captured procedure
- message type that initiated the transaction
- if the transaction was faulty or not, with an applicable error message if faulty
- Optional:
If you want to display more traces, do one of the following:
- Use the drop-down menu to change the maximum-trace age.
- Use the slider to change the maximum number of traces.
Note: By default, the tool only shows a limited number of recent traces.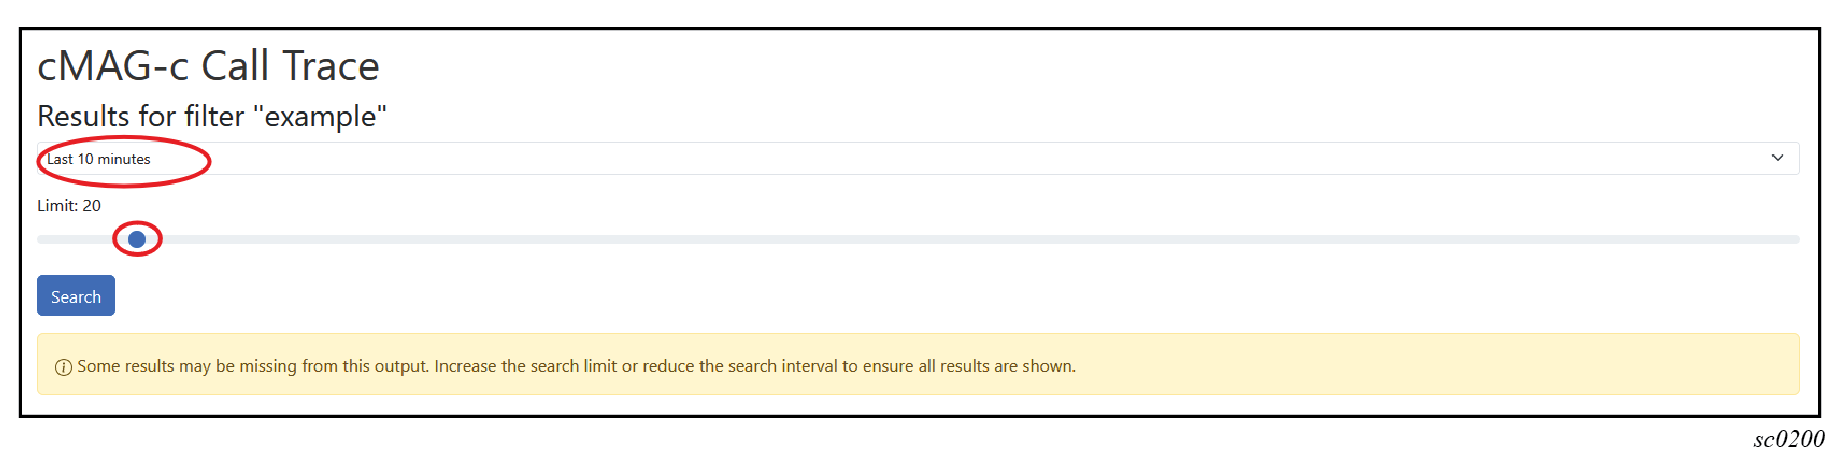
-
From the list of traces, select the timestamp for a specific trace to display
detailed information about it.
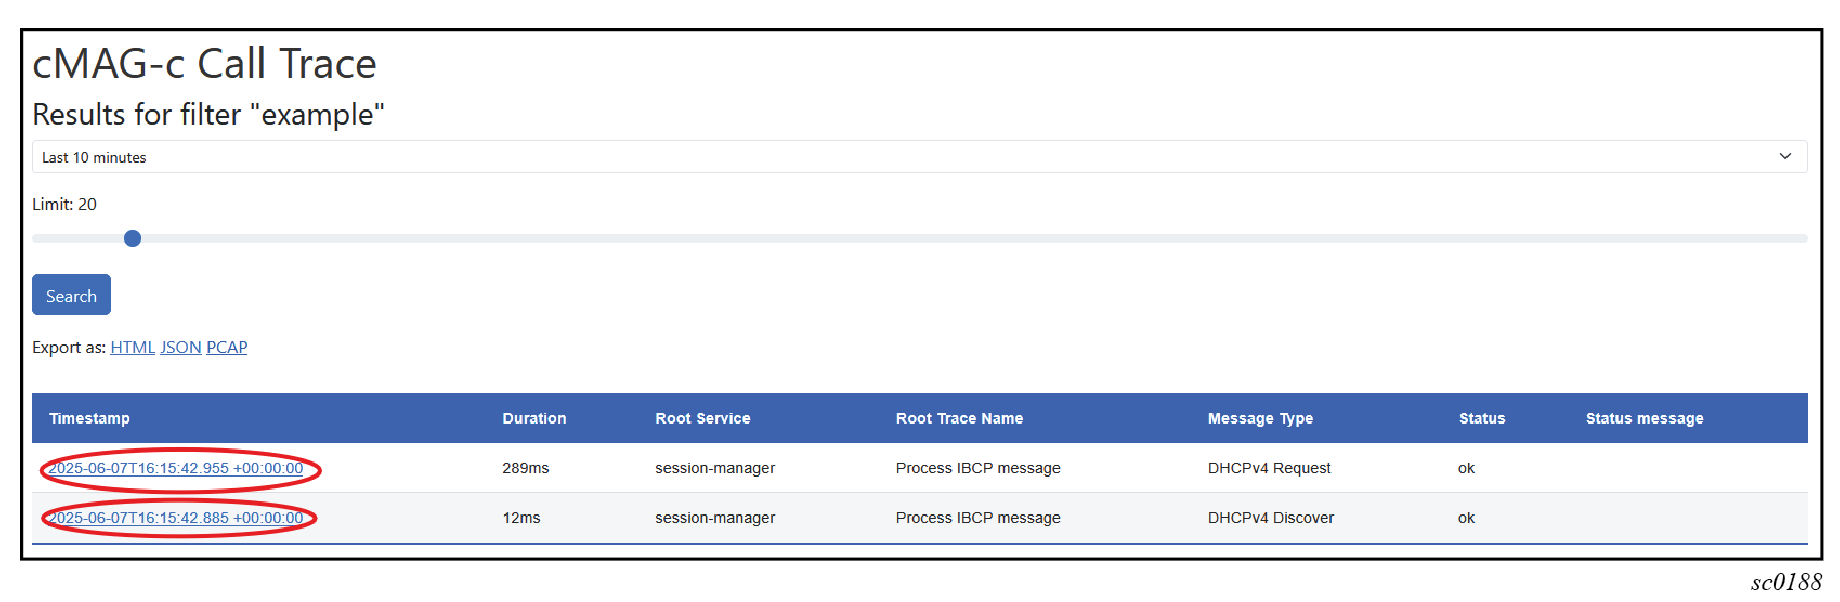
The following example shows the details of a specific traced transaction, including packet captures, if enabled; see Enabling automatic tracing based on error conditions.
See Reviewing the details of a trace for more information about the trace details.
Reviewing the details of a trace
After navigating to a detailed trace as described in Searching for session traces, the detailed view of the trace events is displayed.
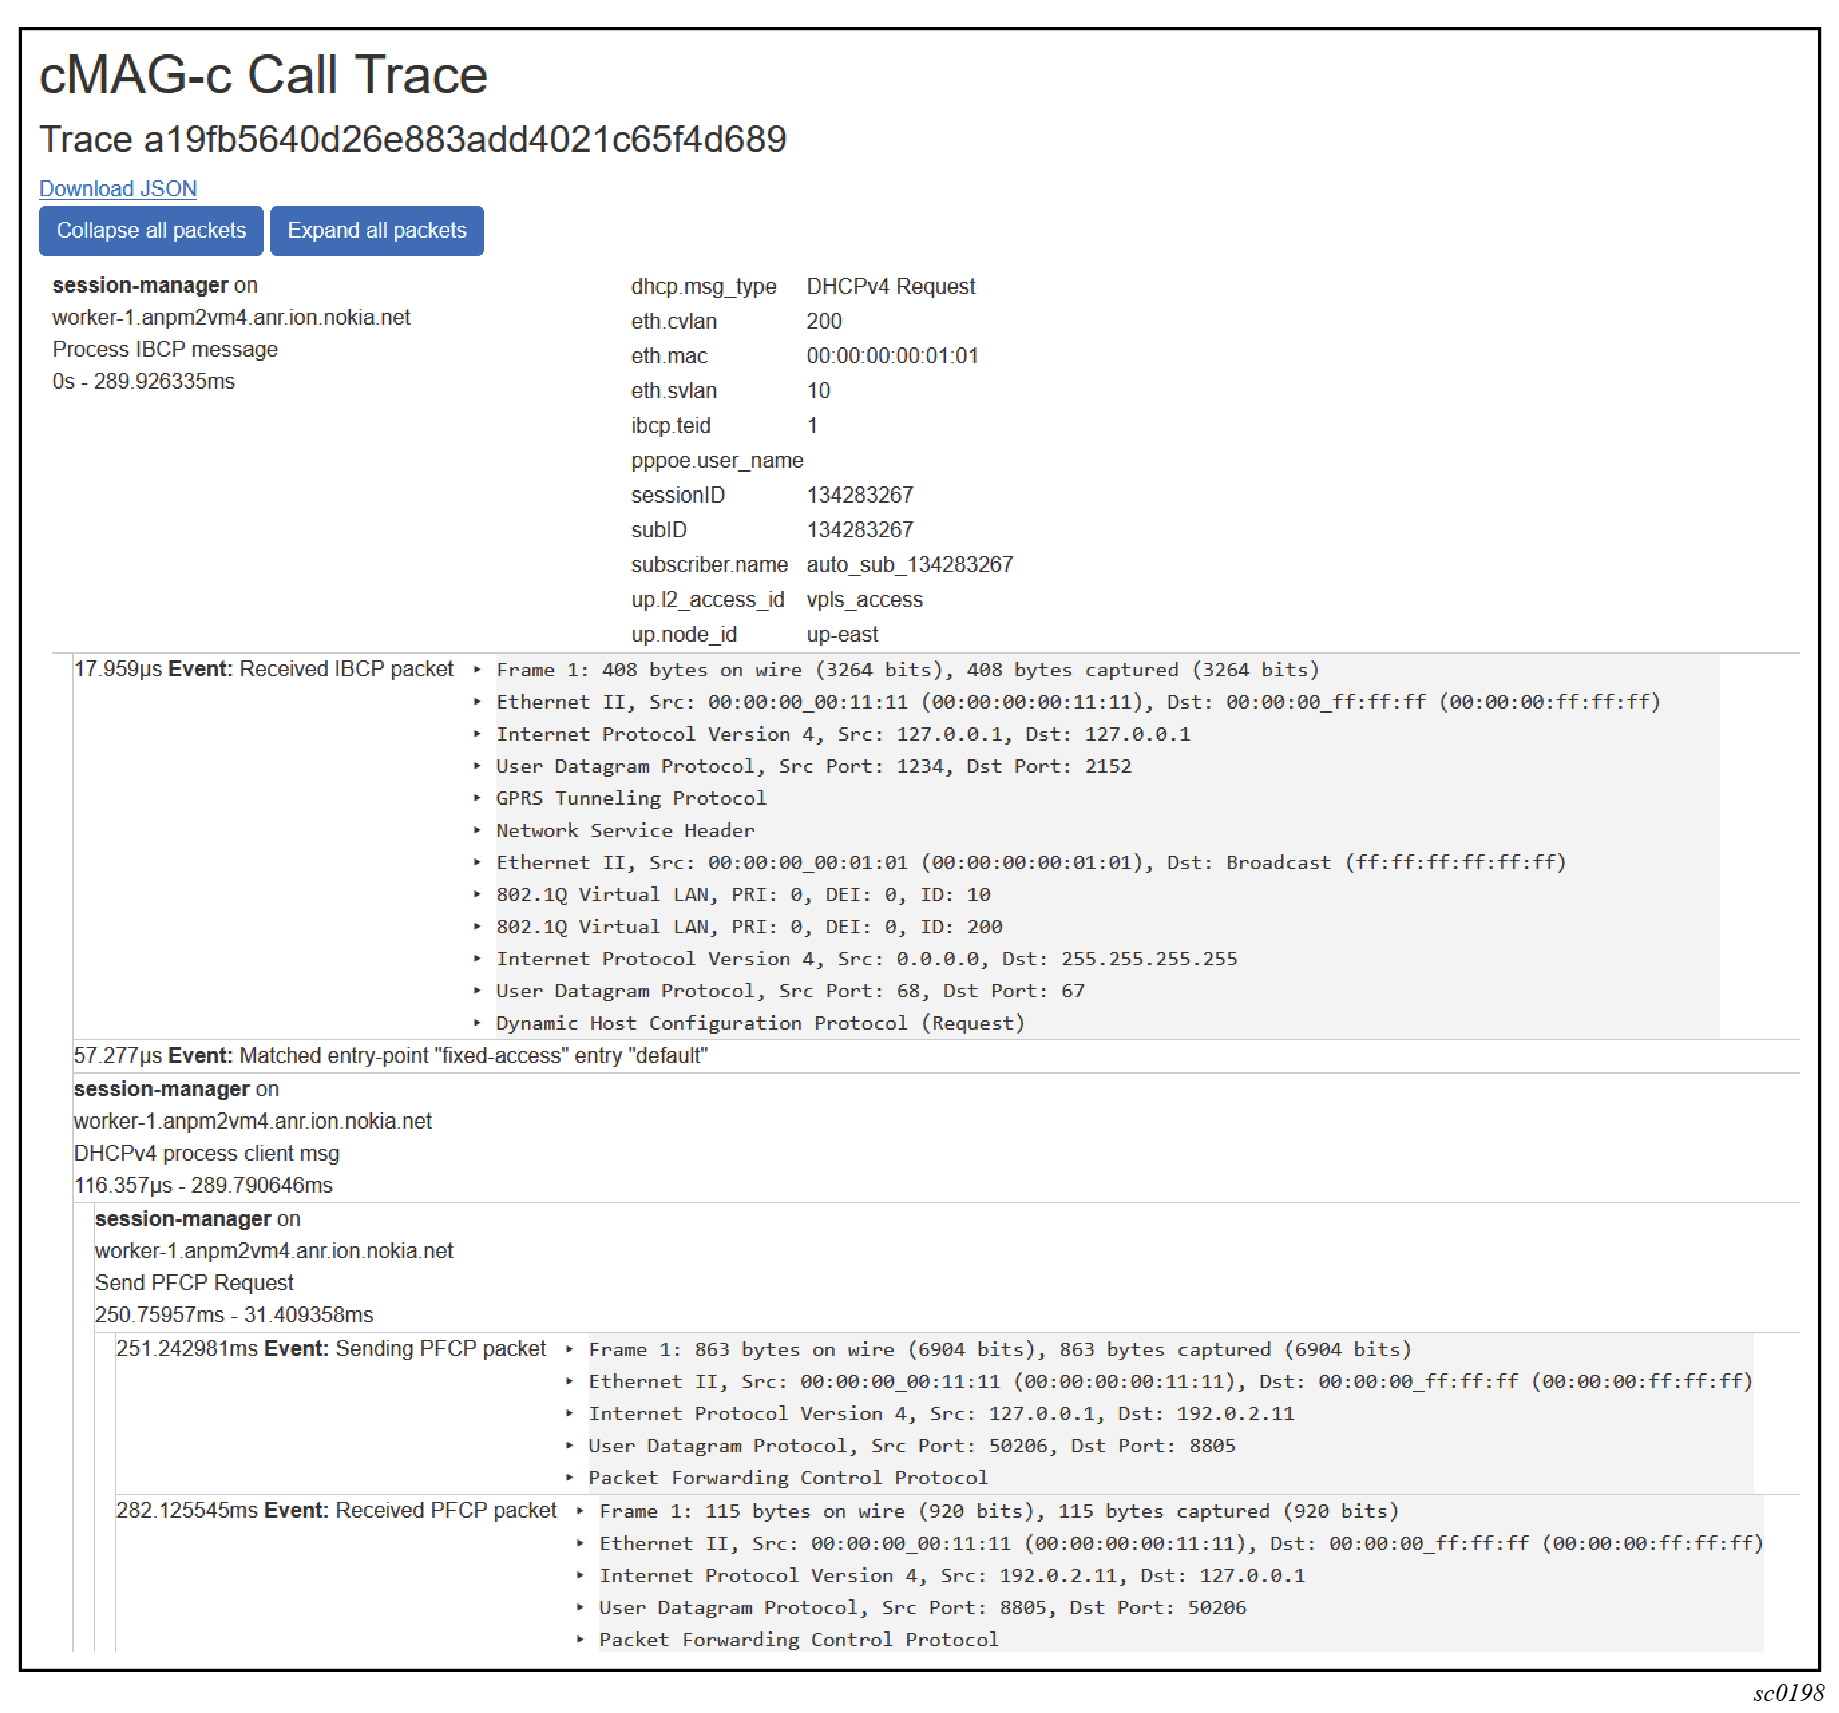
The trace details include relevant information for each captured event, such as the following:
- event timestamp within the trace and the optional duration
- the relevant packets for the event
- the pods handling the event
Each trace usually consists of one initial event with a series of sub-events. For example, the trace shown in the following figure has one main event, traced by the session manager, detailing the session data and the captured procedure (IBCP processing). The trace in the figure further consists of multiple sub-events:
- The first event shows the details of a received IBCP packet (DHCP Request).
- The second event shows an entry point lookup was done for an entry named “default”.
- The third event shows further processing of the DHCP request within the session management pod. For illustration purposes, the event shows the first of multiple sub-events. The first sub-event shows handling of a PFCP Session Establishment transaction that also consists of two sub-events, one for sending the outgoing PFCP request message, and one for handling the incoming PFCP response message. Both sub-events also show the PFCP packet details.
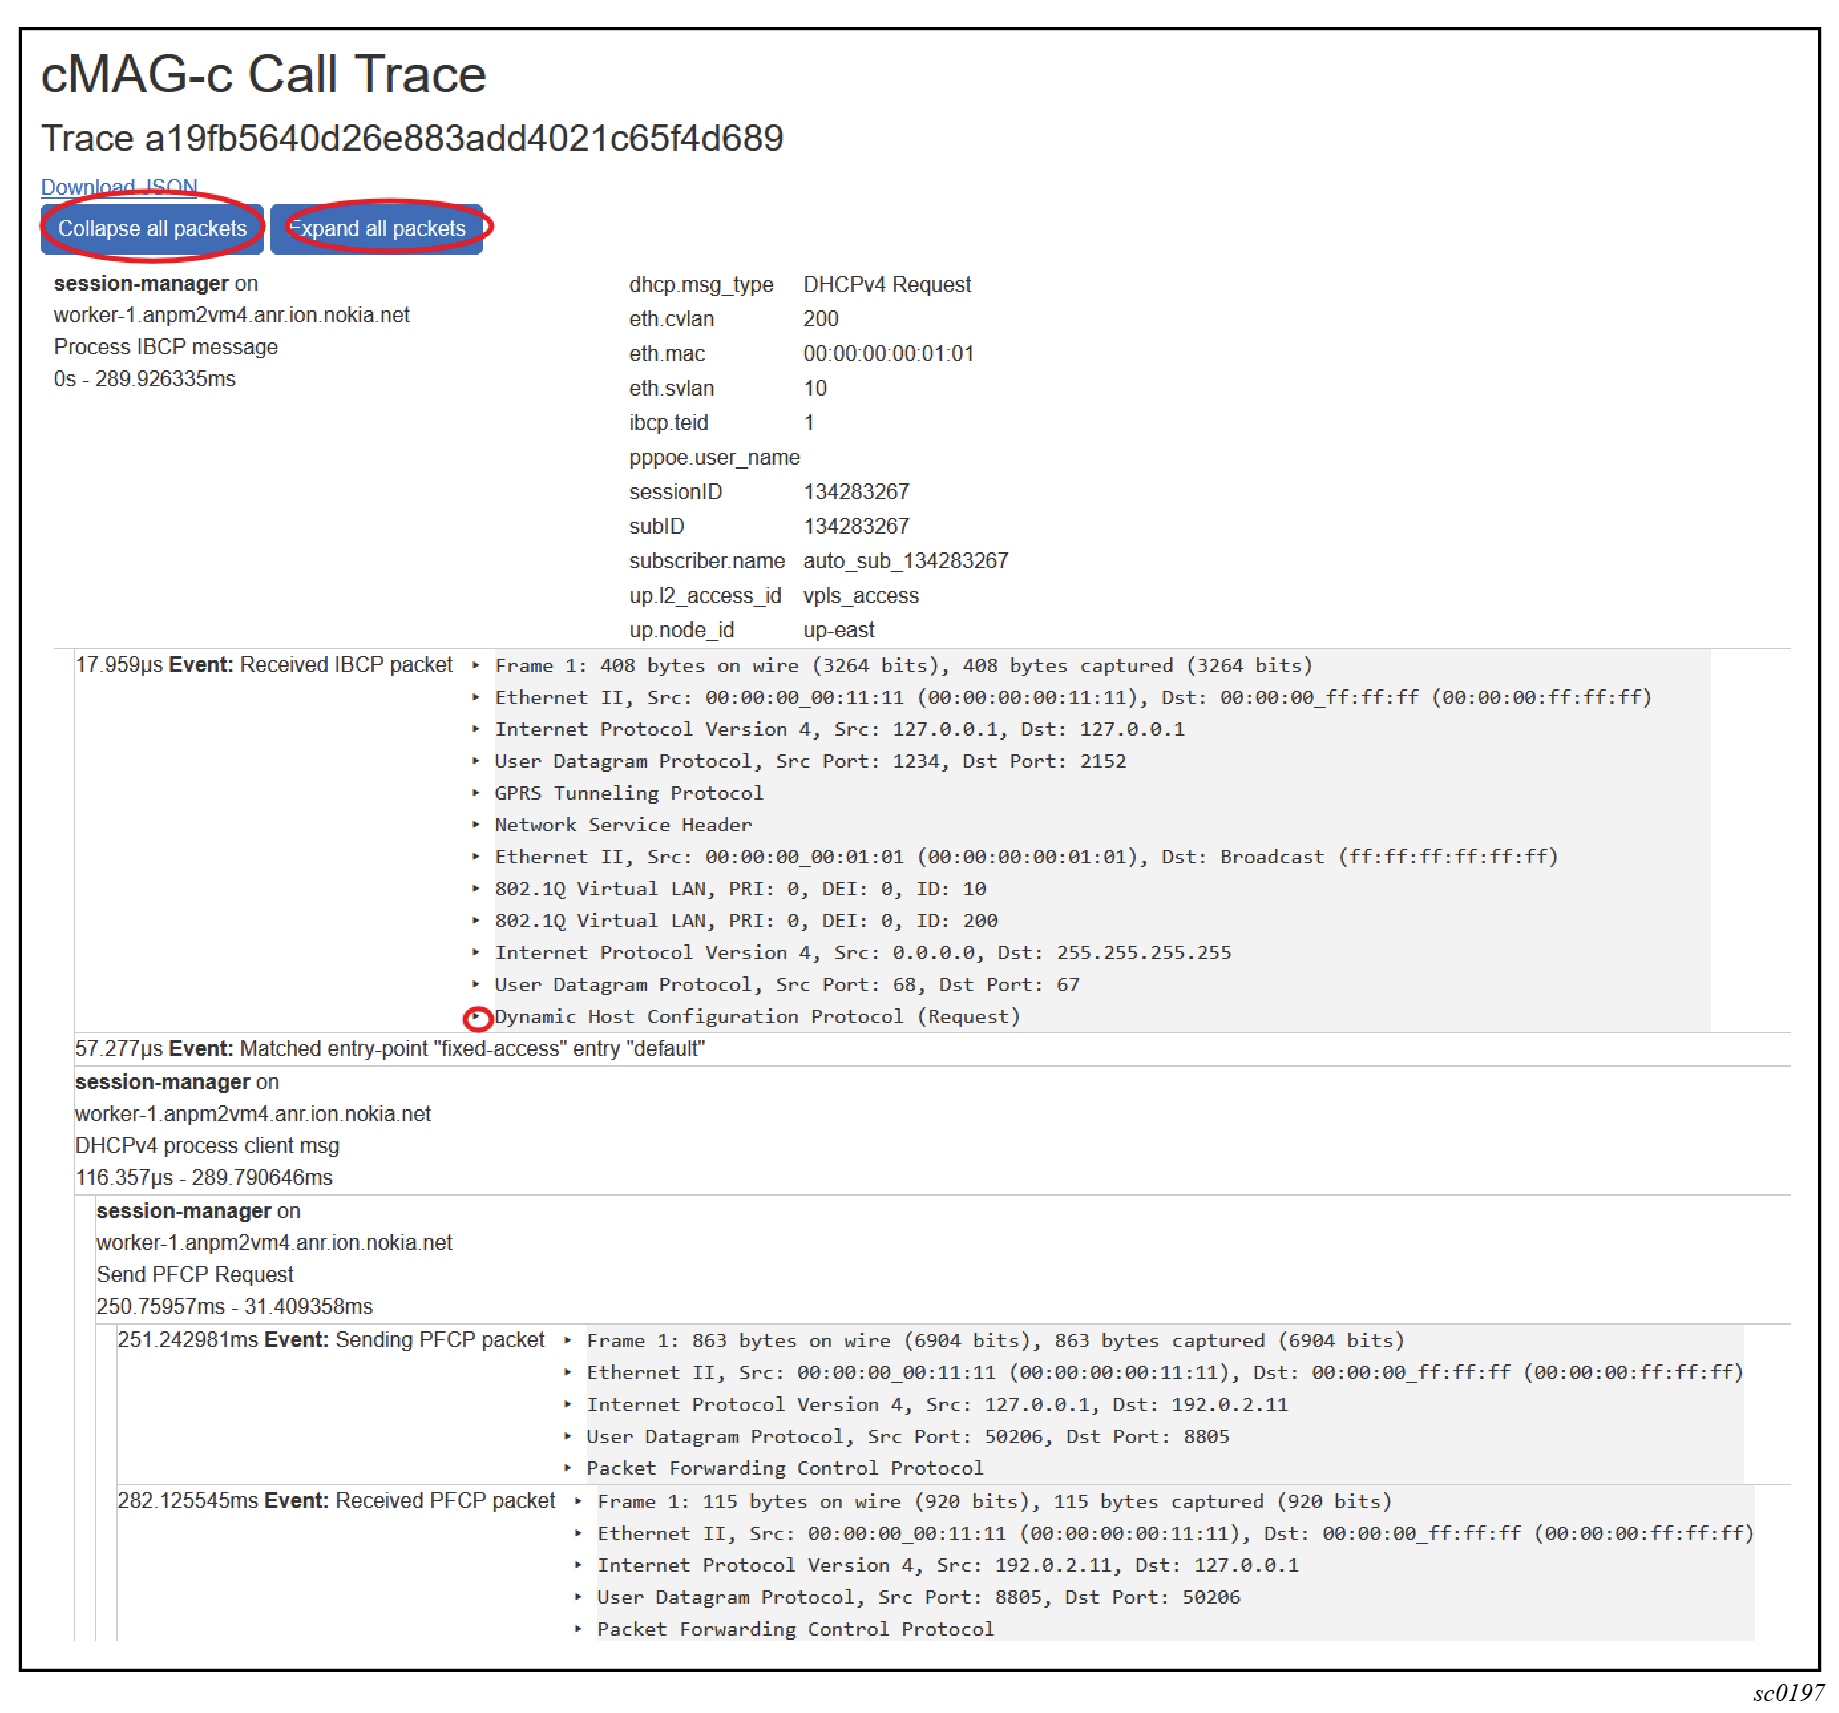
By default, only a summary of each protocol layer in a traced packet is displayed. To expand the details for all the traced packets:
- For a specific layer, select the arrow next to it.
- For all layers of all packets, click the Expand all packets button.
To collapse the details of all layers of all packets, click the Collapse all packets button.