Operations views
To help you assess the overall health of your fabrics, the Fabric Services System includes some high-level perspectives on the current status of all managed regions and fabrics. These views are intended to help you assess at a glance what is working and what is not, what is configured or misconfigured, and to understand what other related objects could be affected by an unhealthy entity.
From these high-level views that begin at the regions level, you can drill down to see the health of individual fabrics, nodes, and links within a region.
Health is a reflection of the operational state of nodes, links, and any node-based alarms within the set of managed fabrics. Although health alarms are distinct from intent deviations and deployment status, they may be related.
 Operation and
Health Insights from the system's main menu. The resulting page includes
two main overlays:
Operation and
Health Insights from the system's main menu. The resulting page includes
two main overlays:-
Health, which displays information about objects subject to
alarms, and their operational state (Up, Down, or Missing Hardware)
 Operational Deviation, which indicates where there are
errors within the physical topology of a fabric.
Operational Deviation, which indicates where there are
errors within the physical topology of a fabric.
In each case, this information is conveyed through a combination of graphical display for overall status, and the information panel on the right side of the page that provides more details.
| # | Description |
|---|---|
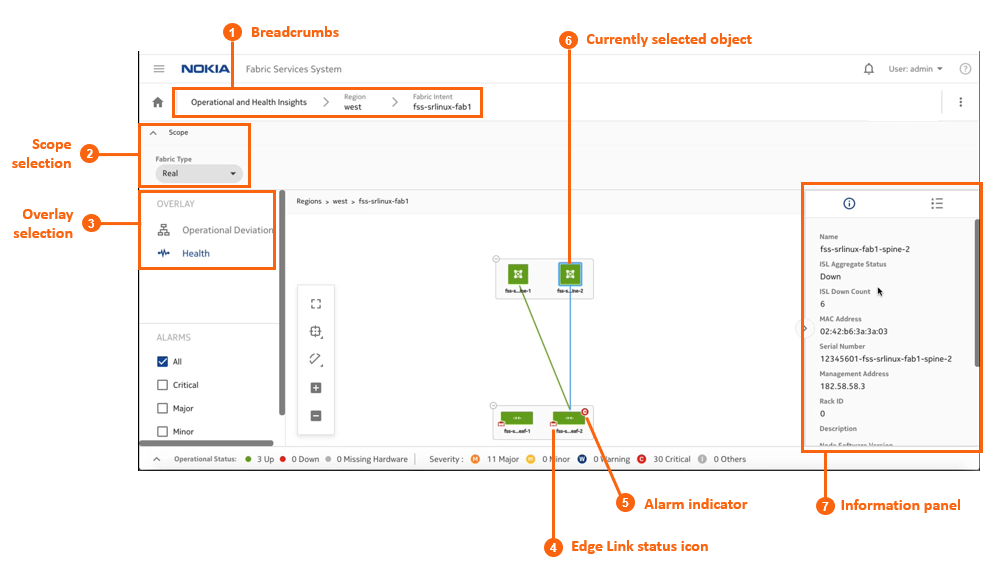
| 1 | Breadcrumbs: as you drill down into a region, this displays the level of your current view and the sequence of objects between that view and the region level. |
| 2 | Scope selection: use this drop-down to control whether the view displays Real objects, or simulated Digital Sandbox objects. |
| 3 | Overlay selection: use this panel to select one of the available views, either Health or Operational Deviations. |
| 4 | Edge Link status icon: this icon is only present on Leaf nodes, and indicates the presence (and status) of edge links leading to customer assets. Possible statuses are Up (green) or Down (red). |
| 5 | Alarm indicator: this icon indicates the aggregate alarm level for an object. If absent, there are no alarms on the object or its child objects. If present, it indicates (by its color and letter) the single highest-level severity of any alarms that are active on the object or any of its children. |
| 6 | Currently selected object: a light blue outline indicates the currently selected object within the view. The same light blue is superimposed on any ISLs associated with that object. |
| 7 | Information panel: open this panel by clicking the a the right of the
page. The panel displays information about the currently selected
object. Of particular interest are the aggregate status and count
indicators:
|
The Health overlay
- Health, which displays information about:
- which objects that are subject to alarms
- for parent objects, the single highest-severity alarm on any of its child objects
- which nodes and links are down
- for parent objects the proportion of immediate child objects that are up or down
-
Operational Deviation, which indicates where there are
errors within the physical topology of a fabric. A deviation in this context
represents:
- a port that should be connected to another port, but is not
- a port that should not be connected to another port, but is
- a port that should be connected to a specific other port, but is connected to a different port instead
Displays on the Health overlay follow the conventions for other maps in the Fabric Services System UI. The possible states that can be displayed vary depending on whether you are looking at the Health page or the Operational Deviations page.
| Information type | Display |
|---|---|
| Operational states (Health) | |
| Operational states (Deviations) | |
| Alarm severities | 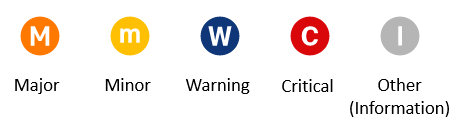 |
The Operational Deviation overlay
The Operational Deviation overlay indicates where there are errors within the physical topology of a fabric. A deviation in this context represents:
- a port that should be connected to another port, but is not
- a port that should not be connected to another port, but is
- a port that should be connected to a specific other port, but is connected to a different port instead
Any object that is the subject of deviations is shaded orange in the overlay topology.
Viewing the operational topology
-
From the main menu, select
Operational and Health Insights.
The Operational and Health Insights page displays, showing a map of all configured regions. (This is currently limited to a single region.)
-
In the OVERLAY drop-down, select
Health.
-
Optionally, select the type of fabrics to display by making a selection in the
Fabric Type drop-down list.
The drop-down supports two fabric types:
- Real (default)
- Digital Sandbox
-
To learn more about any region on the map, do the following:
-
Click the region icon to select it, then click the
 icon at the right of the page to open the
information panel.
The information panel displays more information about the selected region, including the number of fabrics and number of links it contains.
icon at the right of the page to open the
information panel.
The information panel displays more information about the selected region, including the number of fabrics and number of links it contains.
-
Click the region icon to select it, then click the
-
To learn more about the fabrics within the region, do the following:
-
Select a fabric and, if the information panel is not open, click the
icon at the right of the page to open the
information panel.
The information panel displays more information about the selected fabric. Pay particular attention to the following values:
- Node Aggregate Status: this summarizes the overall state of nodes within the fabric.
- Node Down Count: this is the number of nodes within the fabric that are currently operationally Down.
- Interface Down Aggregate Status: this provides some information about the proportion of interfaces within with the fabric that are experiencing operational issues.
- Interface Down Count: this is the number of interfaces within the fabric that are experiencing operational issues.
-
Select a fabric and, if the information panel is not open, click the
-
To navigate to another view to learn more about an individual fabric,
right-click the fabric on the map and select one of the following from the
resulting contextual menu:
- Open Fabric Design to open the fabric intent's Design view
- Open Fabric Inventoryto open the fabric intent's Inventory view
- Show Intent Alarms to open the Alarms List.
The selected view displays, replacing the Regions and Health view. The new view adopts the context of the fabric whose row you selected. -
To learn more about the spine nodes within a single fabric, do the
following:
-
Select an individual spine node within the expanded group and, if the
information panel is not open, click the icon at the right of the page to open the
information panel.
The information panel displays more information about the selected node. Pay particular attention to the following values:
- ISL Aggregate Status: this provides some information about the proportion of ISLs associated with the selected node that are experiencing operational issues.
- ISL Down Count: this is the precise number of ISLs associated with the selected node that are experiencing operational issues.
-
Select an individual spine node within the expanded group and, if the
information panel is not open, click the
-
To learn more about a leaf nodes within a single fabric, do the
following:
-
Select an individual leaf node within the expanded group and, if the
information panel is not open, click the icon at the right of the page to open the
information panel.
The information panel displays more information about the selected node. Pay particular attention to the following values:
- Edge Link Aggregate Status: this provides some information about the proportion of edge links associated with the selected node that are experiencing operational issues.
- Edge Link Down Count: this is the precise number of edge links associated with the selected node that are experiencing operational issues.
- ISL Aggregate Status: this provides some information about the proportion of ISLs associated with the selected node that are experiencing operational issues.
- ISL Down Count: this is the precise number of ISLs associated with the selected node that are experiencing operational issues.
-
Select an individual leaf node within the expanded group and, if the
information panel is not open, click the
Viewing operational insights
-
From the main menu, select
Operational and Health Insights.
-
Optionally, select the type of fabrics to display by making a selection in the
Fabric Type drop-down.
The drop-down supports two fabric types:
- Real (default)
- Digital Sandbox
-
In the OVERLAY drop-down, select
Operational Deviation.
-
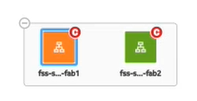
Expand the region icon.
The region icon expands to show all of the fabrics it contains. Fabrics that contain nodes that are the subject of deviations are shaded orange.
-
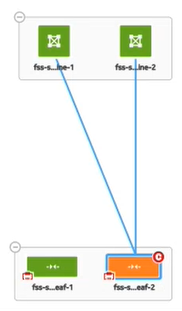
Double-click a fabric icon on the Operations and Health
Insights map.
The expanded fabric cluster shows the individual nodes within that cluster. Nodes that are the subject of deviations are shaded orange.