The dashboard
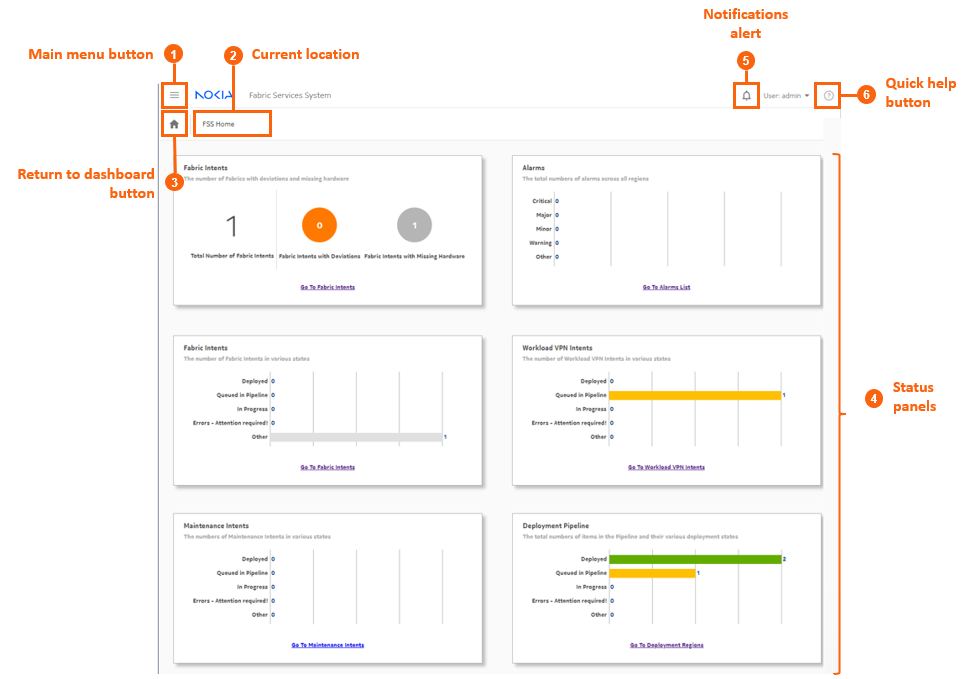
The Fabric Services System dashboard shows high-level information about the fabric intents, workload VPN intents, and maintenance intents in the system, as well as information about the deployment pipeline.
Here you can see important status information about the intents and deployment pipeline at a glance, and the display can immediately guide you to critical issues that need your attention.
From the dashboard, you can navigate to anywhere within the system.
|
# |
Description |
|---|---|
|
1 |
The Main menu button opens the navigation panel on the left side of the display. See The main menu for more information about this menu. |
|
2 |
The Current location indicator displays the name of the current page. |
|
3 |
The Return to dashboard button takes you directly back to the dashboard. This button displays on all screens within the UI. |
|
4a |
The first Fabric Intents status panel displays a summary of the fabrics that are:
A link at the bottom of the panel opens the Fabric Intents page, which shows a list of all fabric intents from which you can view full details about each intent in the list. Fabric intents are fully described in Fabric intents. |
|
4b |
The Alarms panel indicates the number of current alarms of each possible severity level (Critical, Major, Minor, Warning, Other). A link at the bottom of the panel opens the Alarms List page, which shows a list of all alarms and from which you can view full details about each alarm in the list. Alarms are fully described in Alarms. |
|
4c |
The second Fabric Intents panel displays a chart showing the number of fabric intents in each of the following states.
A link at the bottom of the panel opens the Fabric Intents page, which shows a list of all fabric intents from which you can view full details about each intent in the list. Fabric intents are fully described in Fabric intents. |
|
4d |
The Workload VPN Intents panel displays a chart showing the number of workload VPN intents in each of a series of states as described for fabric intents. A link at the bottom of the panel opens the Workload VPN Intents page, which shows a list of all workload VPN intents and from which you can view full details about each intent in the list. Workload intents are fully described in Workload VPN intents. |
|
4e |
The Maintenance Intents panel displays a chart
showing the number of maintenance intents in the same states described
for fabric intents. A link at the bottom of the panel opens the Maintenance Intents page, which shows a list of all maintenance intents and from which you can view full details about each intent in the list. Maintenance intents are fully described in Maintenance intents. |
|
4f |
The Deployment Pipeline panel displays a chart showing the number of intents that are currently in the system's deployment pipeline and are in each of the states described for fabric intents. A link at the bottom of the panel opens the Deployment Regions page, from which you can view the complete list of intents in the pipeline with additional details. Deployment regions, and the deployment pipeline, are fully described in Deployment regions. |
|
5 |
The Notification alert indicates whether there are active notifications pertaining to the Fabric Services System. When it is active, click this icon to see the active notifications. |
|
6 |
The Quick Help ( |
|
7 |
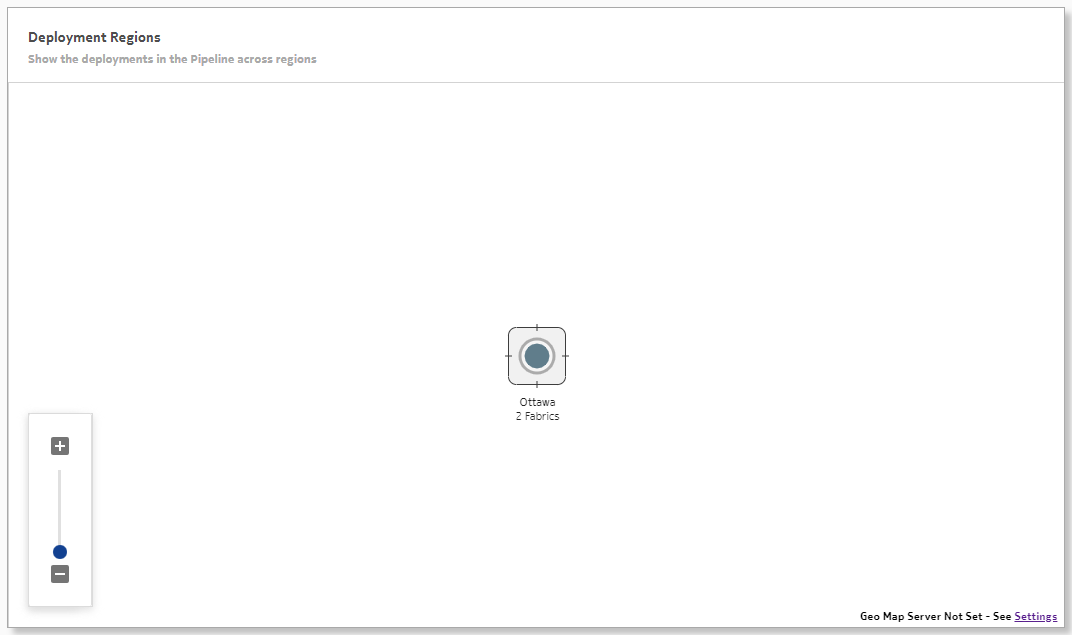
Deployment regions map: below the information panels, the system displays a geographic map showing the existing deployment regions. The Fabric Services System supports the creation of only one deployment region. Double-click a region icon to open the Regions page. From there, you can view more information about the selected region. This map works identically to the region map described in Deployment regions. |
 ) button displays help
topics pertaining to the current screen.
) button displays help
topics pertaining to the current screen.Notifications
Notifications are alerts generated by different subsystems within the Fabric Services System. When a new notification is raised, the bell icon at the upper right of the UI displays a red circle. A counter beside the icon indicates how many new notifications have accumulated since you last viewed the list of individual items.
Clicking the bell icon displays the list of individual notifications. Hovering over a notification in the list displays additional details about that item.
Clicking on the notification takes you to the page in the UI that corresponds to the subsystem that triggered the notification. For example, in the illustration below, the inventory subsystem has triggered a notification when the status of a node changed from READY to NOT_READY. The link in the notification takes you to the global inventory page.
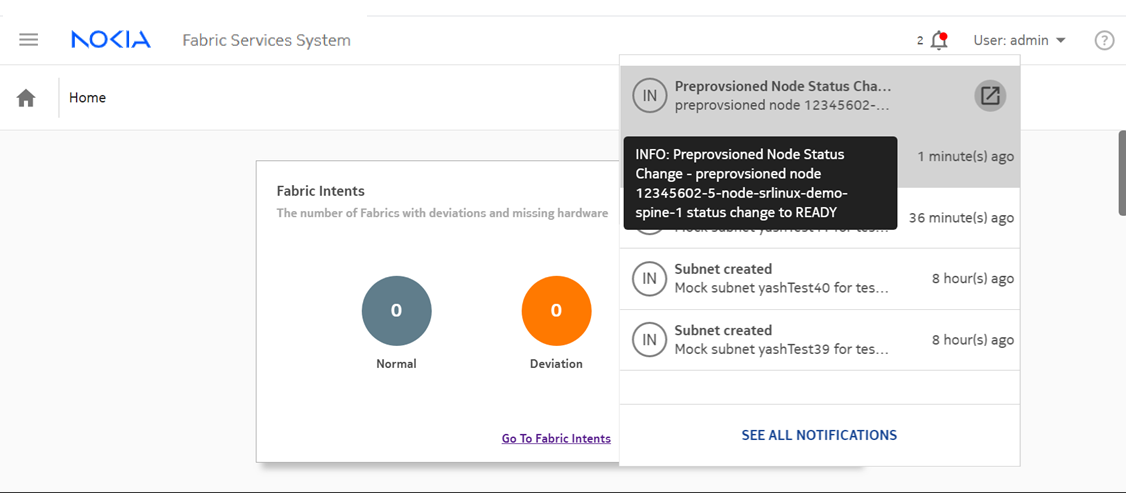
Within the notifications list, items are sorted by order of occurrence with the most recent notifications displayed at the top of the list.
Notification types
The system currently generates a notification for any device that changes its status to Not Ready.
Notification severity
The system currently supports a single severity level: Alert.