The region map
The region map is a graphical representation of all regions managed by the system, superimposed over a map image.
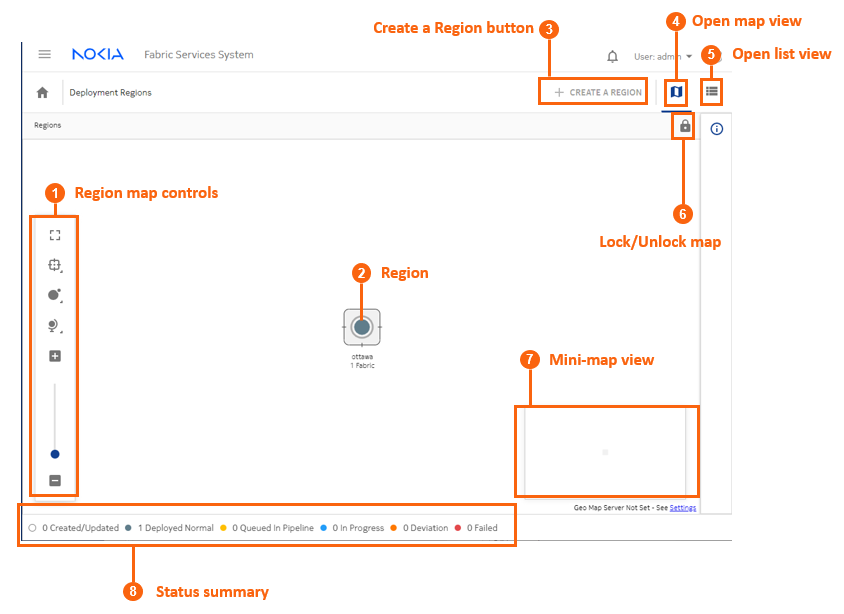
You can change the arrangement of regions on the map, unless the administrator has chosen to lock the map for all users. The region map display is user-specific; your changes to the map persist the next time you log in with the same user account.
Administrators can manage their own versions of the map, and periodically deploy it so that the latest version is available to other users.
The background image displayed for the region map is determined by the system's Geomap Tile Server setting. To view or change this setting, go to .
After you select an image, it displays the next time you open the region map. You can control the opacity and transparency of the image using the region map manipulation controls.
Viewing and using the region map
-
Click
 to open the main menu.
-
In the main menu, select Deployment Regions. The
deployment regions page opens, showing a graphical representation of region already
created.
From this map, you can do the following:
- Lock the region icon in its current position by clicking the Lock button
(
 ). This
replaces the button with an Unlock button (
). This
replaces the button with an Unlock button ( ).
). - View the set of fabric, workload, and maintenance deployments currently pending for a region by right-clicking on the region and selecting Show Deployment Pipeline from the contextual menu.
- View the list of Fabric Intents within a region by right-clicking on the region and selecting Show Fabric Intent List from the contextual menu.
- View and optionally edit details about a region by right-clicking on a region and selecting Edit Details... from the contextual menu.
- View information about DHCP settings by selecting View DHCP Configuration... from the contextual menu.
- Delete the region by right-clicking on the region and selecting
Delete... from the contextual menu.
You cannot delete a region that contains one or more fabrics.
- Lock the region icon in its current position by clicking the Lock button
(
Viewing and using the region list
To view a region list instead of a map:
- Open the Regions map.
-
Click the Regional List (
 ) button. The system replaces the map display with a list
showing the single region already configured.
From this list you can access most of the options available from the region map by clicking on the More actions icon (
) button. The system replaces the map display with a list
showing the single region already configured.
From this list you can access most of the options available from the region map by clicking on the More actions icon ( ) at the right of the row in the region list and selecting one of the
following:
) at the right of the row in the region list and selecting one of the
following:- Show Deployment Pipeline to view the set of fabric, workload, and maintenance deployments currently pending for the region
- Show Fabric Intent List to view the list of Fabric Intents within the region
- Edit Details... to view and optionally
edit details about a region.
For information about the consequences of such edits, see Implications of modifying a region.
- View DHCP Configuration to view the region’s DHCP settings.
- Delete to delete the region.
You cannot delete a region that contains one or more fabrics.
-
To return to the map view from the list view, click the
Regional Map (
 ) button.
Region map manipulation
In addition to being able to drag the region within the map (unless the map has been locked), several controls allow you to manipulate the way elements are displayed on the regions map.
Icon |
Description |
|---|---|
Lock: prevents you from changing the position of regions on the Regions map. When clicked, the button toggles to Unlock. |
|
Unlock: restores the ability to move regions on the Regions map. When clicked, the button toggles to Lock. |
|
Fit to screen: adjusts the magnification setting for the topology display so that the entire topology diagram fits inside the current window. |
|
Clustering controls:
|
|
|
Vertex controls: adjusts the size of the vertices to either small, medium, large, or extra large. |
|
Map controls: adjusts the following:
|
|
Zoom in, zoom out: increases or decreases the magnification for the topology diagram. |