Service Availability Details report
Service Availability Details report overview
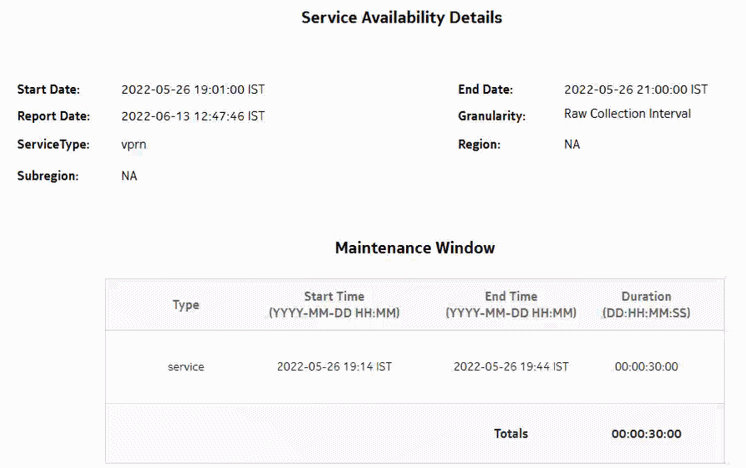
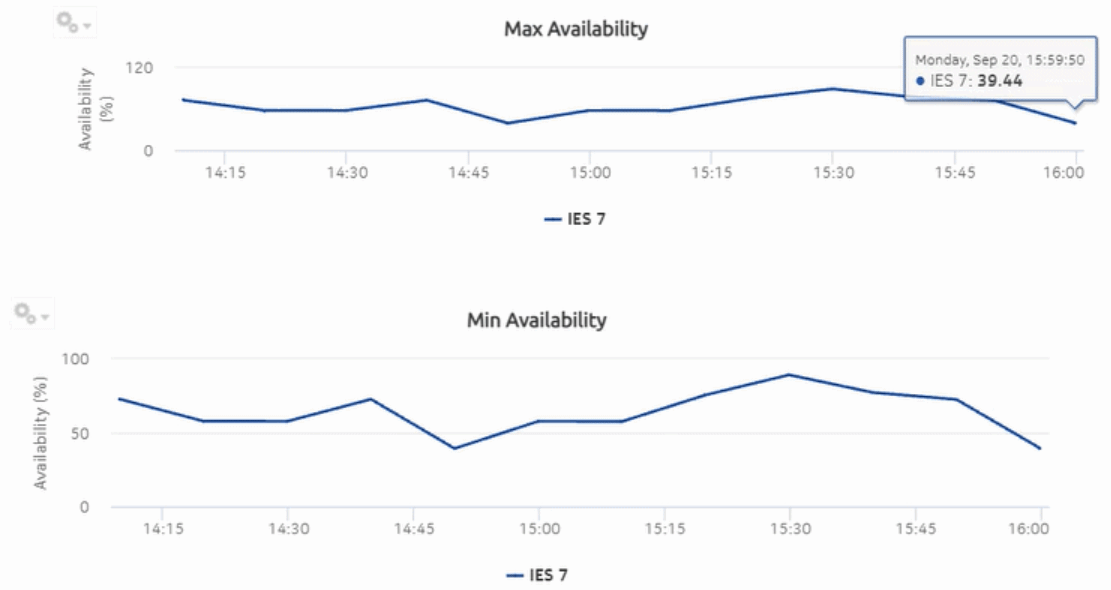
The Service Availability Details report shows the availability details of services. The report provides graphs showing the maximum, minimum, and average availability of services.
Use cases
Service level agreement—Use the report to validate that service availability meets agreed targets.
Troubleshooting—Use the report to determine if a service is currently, or has previously, been unavailable.
Prerequisites
To create the report, service availability must be determined. An availability framework computes periodic outage time and outage counts from state change records contained in the auxiliary database data dictionary. These periodic values are aggregated to determine the availability of a service over a period of time. A periodic table tracks the activity state and availability of a service. The report does not consider the site, but instead uses the operational state of a service to provide the availability. Only the Up service is considered for Uptime; Partially Down and Down states are considered as downtime. The availability framework supports the creation of an availability table that aggregates the data in the periodic table based on the periodic synchronization time configured on the system. The object synchronization interval for tables registered for periodic calculation can be configured to run every 15 min (separate from the regular object synchronization task) by configuring analyticsMODictPeriodicSyncTime in the nms-server.xml file. See How do I synchronize the Analytics data dictionary table data with the NFM-P? for information about synchronizing the Analytics data dictionary table with the NFM-P.
Populate the maintenance window table in the auxiliary database with details of NE and Service maintenance; see Analytics maintenance window table. The report will run if the table is not created or empty; however, maintenance windows are treated as down time when availability is calculated.
Report characteristics
The following table lists the principal report characteristics.


