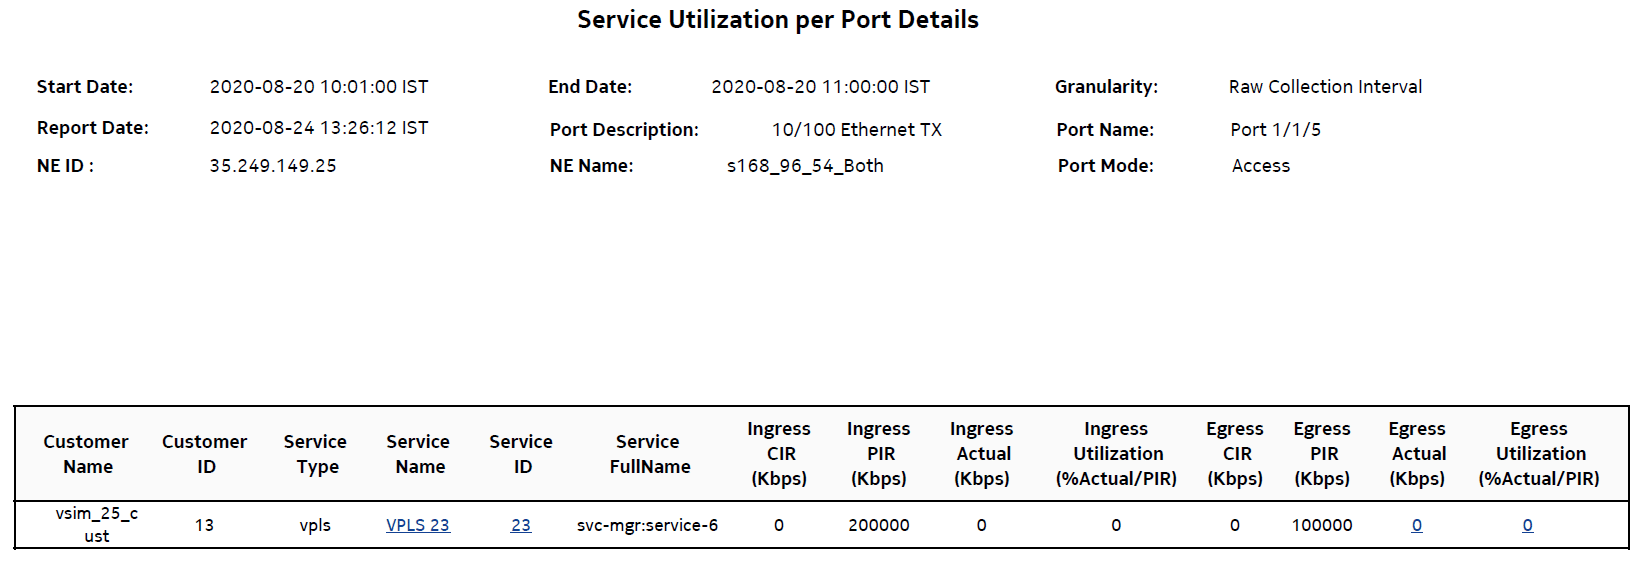
Service Utilization per Port Details report
Service Utilization per Port Details report overview
The Service Utilization per Port Details report shows the utilization of individual services for a selected access port. It is used to identify what services are consuming the majority of the bandwidth on a particular port. This report can be launched on its own or as a drill-down of the Port Throughput Summary report.
The default display is a table showing average ingress and egress utilization. By default the table is sorted by average utilization in decreasing value order (worst first), regardless of ingress or egress direction.
For SR variants, 7705 SAR-Hm, and 7705 SAR-Hmc, the report supports QoS policies, virtual schedulers, queue overrides, policer overrides, and the egress aggregate rate limit.
For the 7210 SAS, the report supports QoS policies, queue/meter overrides, and the egress aggregate rate limit.
For the 7705 SAR, the report supports QoS policies and the egress aggregate rate limit.
The report supports the port limit and local limit, which are the CIR and PIR values configured as percentages.
It is not mandatory to configure QoS for this report since the default QoS settings apply.
Use cases
Capacity planning—Use the report to examine utilization patterns for planning future capacity requirements.
Fault impact analysis—If the port is down or suffering performance issues, use this report to quickly identify the impacted services.
The Rate (kbps) rate type, Percent Port, and Percent Local rate types are supported for this report.
Limitations
Minimum and maximum throughput aggregation cannot be compared with the minimum and maximum throughput values generated from raw granularity.
Prerequisites
The following table describes the aggregation rules that must be enabled and the accounting policies that must be configured for the NEs on which statistics are to be collected; see the NSP NFM-P Statistics Management Guide for information about configuring an accounting policy. The accounting policy must be assigned to the SAPs that belong to services for which the Utilization reports will be created. For the report to be created as a drill-down from a Port Throughput Summary report, the Port Throughput prerequisites must also be in place; see Port Throughput Summary report. To view the report for granularities other than raw data, the aggregation rules must be enabled; see How do I configure analytics aggregation?.
Table 14-19: Service Utilization per Port Details report prerequisites
|
Aggregator name |
Monitored object class |
Statistics class |
Statistics collection |
Details |
NE types |
|---|---|---|---|---|---|
|
SAP Interface Stats Aggregator Egress |
service.AccessInterface |
service.CompleteServiceEgressPacketOctets |
Accounting, file, and log policies |
completeSvcInEg policy |
7705 SAR 7705 SAR-H 7705 SAR Hm 7750 SR Note: esat ports are not supported |
|
SAP Interface Stats Aggregator Ingress |
service.AccessInterface |
service.CompleteServiceIngressPacketOctets |
Accounting, file, and log policies |
completeSvcInEg policy |
7250 IXR-R6 7705 SAR 7705 SAR-H 7705 SAR Hm 7750 SR |
|
Service Egress Octets Aggregator |
service.AccessInterface |
service.ServiceEgressOctets |
Accounting, file, and log policies |
svcEgressOctet policy |
7210 SAS-D 7210 SAS Dxp 7210 SAS-K 7210 SAS-M 7210 SAS-Mxp 7210 SAS-R 7210 SAS-S/Sx 7210 SAS-T 7210 SAS-X 7705 SAR-H Note: 7210 SAS-E and 7210 SAS-S/Sx are not supported due to NE limitations. |
|
Service Ingress Octets Aggregator |
service.AccessInterface |
service.ServiceIngressOctets |
Accounting, file, and log policies |
svcIngressOctet policy |
7210 SAS-D 7210 SAS Dxp 7210 SAS-K 7210 SAS-M 7210 SAS-Mxp 7210 SAS-R 7210 SAS-S/Sx 7210 SAS-T 7210 SAS-X 7705 SAR-H |
Report characteristics
The following table lists the principal report characteristics.
Table 14-20: Service Utilization per Port Details report characteristics
|
Characteristic |
Value | |||||
|---|---|---|---|---|---|---|
|
Data type |
Statistics | |||||
|
Source database |
Auxiliary database | |||||
|
Report inputs |
Prompt |
Notes | ||||
|
End date |
Calendar date or relative date (for example, two days ago) and time | |||||
|
Granularity |
Aggregation types: | |||||
|
Report range |
Length of time to be reported, in minutes (minutes, min), hours (hours, h), days (days, d), or months (months, m) | |||||
|
NE Types |
Search using partial names or wildcard (%). Select individual items or click Select All. | |||||
|
NE Name (or NE Pattern) | ||||||
|
NEs | ||||||
|
Port Name (or Port Name Pattern) |
Search using partial names or wildcard (%). Select individual items or click Select All. | |||||
|
Port/ LAG | ||||||
|
Display Service Full Name |
Select the check box to show the full names of the services in the table. | |||||
|
Percentile |
Identify a percentile of interest between 1 and 99. | |||||
|
Logo Resource ID |
The logo to add to the report. Enter the Resource ID of the logo image in the Images folder. The default is the Nokia logo. To create the report without a logo, leave the Logo Resource ID field blank. | |||||
|
Logo Position |
Choose Left, Middle, or Right. The logo appears on the left on the first page of the report if you choose Left or Middle. | |||||
|
Show report output on one page |
Select the check box to enable pagination. Note: Using the Show report output on one page option when creating reports as drill-downs may impact report rendering time. Nokia recommends disabling the Show report output on one page option when creating reports. | |||||
|
Drill-down support |
Yes:
The drill-down from the Service Utilization per Port Details report is only supported when the Service Utilization report is performed on a service that is supported by the target report: | |||||
