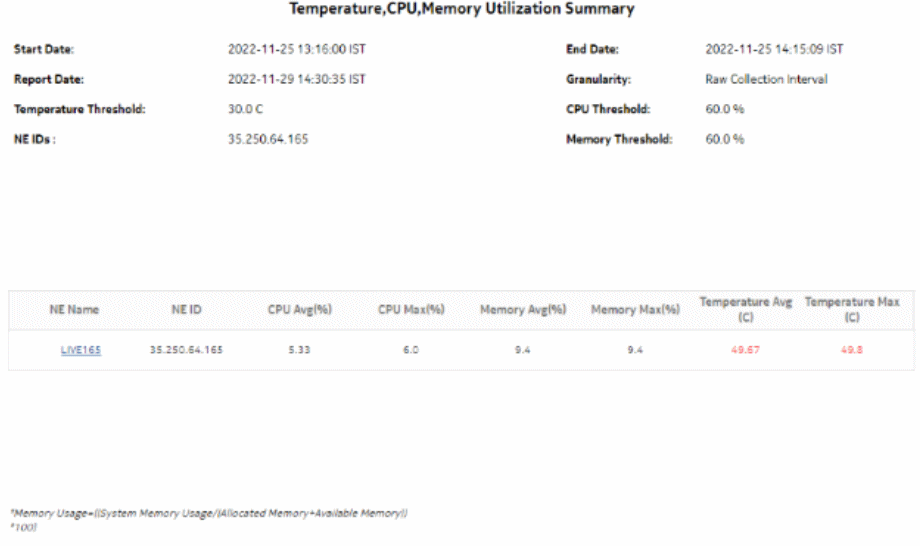
Temperature, CPU, Memory Utilization Summary report
Temperature, CPU, Memory Utilization Summary report overview
The Temperature, CPU, Memory Utilization Summary report shows the maximum and average temperature and memory and CPU usage for selected NEs. The report displays a detailed table that is sorted according to the NE Name column. Table sorting is enabled for the CPU Memory Average and Maximum columns.
To generate meaningful average temperature data, Nokia recommends using raw or hourly interval statistics.
Memory Usage is computed in the report using the following formula:
[memory in use / (allocated memory + available memory) * 100]
The calculation is displayed at the footnote section of the reports.
If no telemetry subscriptions are enabled for CPU, Memory, and Temperature, the report shows -1 values for CPU and Memory and N/A for Temperature.
Utilization results are colored red when utilization reaches or exceeds user-defined thresholds. Thresholds are defined separately. The default value for the temperature threshold is 30°C. The default value for the memory and CPU thresholds is 60%.
The following temperatures can be reported by the NE when no temperature sensor is available. These temperatures are invalid and will not be displayed in the report.
Note: For 7705 SAR-Hm and 7705 SAR-Hmc NEs, negative temperatures can be valid. Temperatures reported by 7705 SAR-Hm and 7705 SAR-Hmc NEs are always displayed.
Limitations
Report limitations include:
-
When the report is exported to the ODS file type, the report may not be properly aligned, and some table columns may not appear.
-
Minimum and maximum throughput aggregation cannot be compared with the minimum and maximum throughput values generated from raw granularity.
Prerequisites
The following table describes the aggregation rules that must be enabled and the accounting policies that must be configured for the NEs on which statistics are to be collected; see the NSP NFM-P Statistics Management Guide for information about configuring an accounting policy. To view the report for granularities other than raw data, the aggregation rules must be enabled; see How do I configure analytics aggregation?.
See information in the NSP NFM-P Statistics Management Guide about creating or modifying a specific MIB statistics policy using a bottom-up method.
Table 14-43: Temperature, CPU, Memory Utilization Summary report prerequisites
|
Aggregator name |
Monitored object class |
Statistics class |
Statistics collection |
Details (MIB name) |
NE types |
|---|---|---|---|---|---|
|
System CPU Usage Stats Aggregator |
equipment.SystemStatsHolder |
equipment.SystemCpuStats |
Performance statistics |
TIMETRA-SYSTEM-MIB.sgiCpuUsage |
7210 SAS 7250 IXR 7705 SAR 7705 SAR-H 7705 SAR Hm 7750 SR |
|
System Memory Stats Aggregator |
equipment.SystemStatsHolder |
equipment.SystemMemoryStats |
Performance statistics |
TIMETRA-SYSTEM-MIB.sgiMemoryUsed |
7210 SAS 7250 IXR 7705 SAR 7705 SAR-H 7705 SAR Hm 7750 SR |
|
Allocated Memory Stats Aggregator |
equipment.SystemStatsHolder |
equipment.AllocatedMemoryStats |
Performance statistics |
TIMETRA-SYSTEM-MIB.sgiMemoryPoolAllocate |
7210 SAS 7250 IXR 7705 SAR 7705 SAR-H 7705 SAR Hm 7750 SR |
|
Available Memory Stats Aggregator |
equipment.SystemStatsHolder |
equipment.AvailableMemoryStats |
Performance statistics |
TIMETRA-SYSTEM-MIB.sgiMemoryAvailable |
7210 SAS 7250 IXR 7705 SAR 7705 SAR Hm 7750 SR Note: 7705 SAR-H is not supported. Memory Usage is as follows: Memory Usage =(systemMemoryUsageInKb/(allocatedMemoryInKb+availableMemoryInKb)*100 For SAR-H NEs, the available memory statistics are not supported; the calculation is as follows: Memory Usage =(systemMemoryUsageInKb/(allocatedMemoryInKb)*100 |
|
Hardware Temperature Stats Aggregator |
equipment.BaseCard equipment.CardSlot equipment.CCM equipment.FanTray equipment.ControlProcessor equipment.DaughterCard equipment.MCMCard equipment.PowerSupplyTray equipment.Shelf equipment.SwitchFabricProcessor equipment.XiomCard |
equipment.Hardware Temperature |
Performance statistics |
TIMETRA-CHASSIS-MIB.tmnxHwEntry |
7210 SAS 7250 IXR 7705 SAR 7705 SAR-H 7705 SAR Hm 7750-SR Omnisystem NEs |
|
Card Health Stats Aggregator |
equipment.CardSlot |
equipment.CardHealth Stats |
Performance statistics |
ALCATEL-IND1-HEALTH-MIB.healthModuleEntry |
7705 SAR-H Omnisystem NEs and their variants |
Report characteristics
The following table lists the principal report characteristics.
Table 14-44: Temperature, CPU, Memory Utilization Summary report characteristics
|
Characteristic |
Value | |||||
|---|---|---|---|---|---|---|
|
Data type |
Statistics NE configuration information | |||||
|
Source database |
Auxiliary database | |||||
|
Report inputs |
Prompt |
Notes | ||||
|
End date |
Calendar date or relative date (for example, two days ago) and time | |||||
|
Granularity |
Aggregation types: | |||||
|
Report range |
Length of time to be reported, in minutes (minutes, min), hours (hours, h), days (days, d), or months (months, m) | |||||
|
Node Type |
Select individual NE types or click Select All. Search using partial names or wildcard (%). | |||||
|
Site (or Site Name Pattern) |
Search using partial names or wildcard (%). | |||||
|
Sites |
Select individual sites or click Select All. Search using partial names or wildcard (%). | |||||
|
Temperature unit (C/F) |
Default is Celsius | |||||
|
Temperature threshold |
Data at or above thresholds will display in red. | |||||
|
CPU threshold | ||||||
|
Memory threshold | ||||||
|
Logo Resource ID |
The logo to add to the report. Enter the resource ID for the logo image uploaded to the Images folder, if any. If no logo ID is provided, the logo area will be blank. | |||||
|
Logo Position |
Choose Left, Middle or Right. The logo will be placed on the left of the first page of the report for both the left and middle options. | |||||
|
Show report output on one page |
Select the check box to enable pagination. Note: Using the Show report output on one page option when creating reports as drill-downs may impact report rendering time. Nokia recommends disabling the Show report output on one page option when creating reports. | |||||
|
Drill-down support |
Yes—Open the Temperature, CPU, Memory Details report for the selected NE. | |||||
