OAM and SAA
This chapter provides information about the Operations, Administration, and Management (OAM) and Service Assurance Agent (SAA) commands available in the CLI for troubleshooting services.
OAM overview
Delivery of services requires a number of operations occur correctly and at different levels in the service delivery model. For example, operations such as the association of packets to a service, must be performed correctly in the forwarding plane for the service to function correctly. To verify that a service is operational, a set of in-band, packet-based Operation, Administration, and Maintenance (OAM) tools is required, with the ability to test each of the individual packet operations.
For in-band testing, the OAM packets closely resemble customer packets to effectively test the customer forwarding path, but they are distinguishable from customer packets so they are kept within the service provider network and not forwarded to the customer.
The suite of OAM diagnostics supplement the basic IP ping and traceroute operations with diagnostics specialized for the different levels in the service delivery model. There are diagnostics for services.
The following OAM features are supported on all 7210 SAS platforms as described in this document, except those operating in access-uplink mode:
LSP Diagnostics
SDP Diagnostics
Service Diagnostics
VPLS MAC Diagnostics
VLL Diagnostics
LSP diagnostics: LSP ping and trace
P2MP LSP references in this section apply only to the 7210 SAS-Mxp, 7210 SAS-R6, 7210 SAS-R12, 7210 SAS-Sx/S 1/10GE (standalone and standalone-VC mode), and 7210 SAS-T.
This section provides a generalized description of the LSP diagnostics tools. Users should take into account the following restrictions when reading the information contained in this section:
The 7210 SAS does not support LDP LER ECMP. Descriptions of LDP ECMP as an LER node in LSP diagnostics: LSP ping and trace do not apply to 7210 SAS platforms.
LDP LSR ECMP is only supported on 7210 SAS-Mxp, 7210 SAS-Sx/S 1/10GE, 7210 SAS-Sx 10/100GE, 7210 SAS-R6, and 7210 SAS-R12. The description on LDP ECMP as LSR node applies only to these platforms.
7210 SAS platforms support LDP and BGP 3107 labeled routes. The 7210 SAS does not support LDP FEC stitching to BGP 3107 labeled route to LDP FEC stitching and vice-versa. The following description about stitching of BGP 3107 labeled routes to LDP FEC is provided to describe the behavior in an end-to-end network solution deployed using 7210 SAS and 7x50 nodes, with 7210 SAS nodes acting as the LER node.
7210 SAS platforms do not support the use of ECMP routes for BGP 3107 labeled routes. The feature description is provided in this section for completeness and better understanding of the behavior in the end-to-end network solution deployed using 7210 SAS and 7750 nodes.
The router LSP diagnostics are implementations of LSP ping and LSP trace based on RFC 4379, Detecting Multi-Protocol Label Switched (MPLS) Data Plane Failures. LSP ping provides a mechanism to detect data plane failures in MPLS LSPs. LSP ping and LSP trace are modeled after the ICMP echo request/reply used by ping and trace to detect and localize faults in IP networks.
For a specific LDP FEC, RSVP P2P LSP, or BGP IPv4 Label Router, LSP ping verifies whether the packet reaches the egress label edge router (LER), while in LSP trace mode, the packet is sent to the control plane of each transit label switched router (LSR) which performs various checks to see if it is actually a transit LSR for the path.
The downstream mapping TLV is used in LSP ping and LSP trace to provide a mechanism for the sender and responder nodes to exchange and validate interface and label stack information for each downstream of an LDP FEC or an RSVP LSP and at each hop in the path of the LDP FEC or RSVP LSP.
Two downstream mapping TLVs are supported: the original Downstream Mapping (DSMAP) TLV defined in RFC 4379 and the new Downstream Detailed Mapping (DDMAP) TLV defined in RFC 6424.
When the responder node has multiple equal cost next-hops for an LDP FEC prefix, the downstream mapping TLV can further be used to exercise a specific path of the ECMP set using the path-destination option. The behavior in this case is described in the following ECMP subsection.
LSP ping/trace for an LSP using a BGP IPv4 label route
This feature adds support of the target FEC stack TLV of type BGP Labeled IPv4 /32 Prefix as defined in RFC 4379.
The new TLV is structured as shown in the following figure.
The user issues a LSP ping using the existing CLI command and specifying a new type of prefix:
oam lsp-ping bgp-label prefix ip-prefix/mask [src-ip-address ip-address] [fc fc-name] [size octets] [ttl label-ttl] [send-count send-count] [timeout timeout] [interval interval] [path-destination ip-address [interface if-name | next-hop ip-address]] [detail]
The path-destination option is used for exercising specific ECMP paths in the network when the LSR performs hashing on the MPLS packet.
Similarly, the user issues a LSP trace using the following command:
oam lsp-trace bgp-label prefix ip-prefix/mask [src-ip-address ip-address] [fc fc-name] [max-fail no-response-count] [probe-count probes-per-hop] [size octets] [min-ttl min-label-ttl] [max-ttl max-label-ttl] [timeout timeout] [interval interval] [path-destination ip-address [interface if-name | next-hop ip-address]] [detail]
The following are the procedures for sending and responding to an LSP ping or LSP trace packet. These procedures are valid when the downstream mapping is set to the DSMAP TLV. The detailed procedures with the DDMAP TLV are presented in Using DDMAP TLV in LSP stitching and LSP hierarchy:
The next-hop of a BGP label route for a core IPv4 /32 prefix is always resolved to an LDP FEC or an RSVP LSP. Therefore, the sender node encapsulates the packet of the echo request message with a label stack which consists of the LDP/RSVP outer label and the BGP inner label.
If the packet expires on an RSVP or LDP LSR node which does not have context for the BGP label IPv4 /32 prefix, it validates the outer label in the stack and if the validation is successful it replies the same way as it does today when it receives an echo request message for an LDP FEC which is stitched to a BGP IPv4 label route. That is, it replies with return code 8 ‟Label switched at stack-depth <RSC>.”
The LSR node that is the next-hop for the BGP label IPv4 /32 prefix as well as the LER node that originated the BGP label IPv4 prefix both have full context for the BGP IPv4 target FEC stack and, as a result, can perform full validation of it.
If the BGP IPv4 label route is stitched to an LDP FEC, the egress LER for the resulting LDP FEC will not have context for the BGP IPv4 target FEC stack in the echo request message and replies with return code 4 ‟Replying router has no mapping for the FEC at stack- depth <RSC>.” This is the same behavior as that of an LDP FEC which is stitched to a BGP IPv4 label route when the echo request message reaches the egress LER for the BGP prefix.
Only BGP label IPv4 /32 prefixes are supported because these are usable as tunnels on nodes. BGP label IPv6 /128 prefixes are not currently usable as tunnels on a node and are not supported in LSP ping or trace.
ECMP considerations
BGP 3107 labelled route ECMP is not supported on 7210 SAS platforms. References to BGP 3107 labelled route ECMP are included in this section only for completeness of the feature description.
When the responder node has multiple equal cost next-hops for an LDP FEC or a BGP label IPv4 prefix, it replies in the DSMAP TLV with the downstream information of the outgoing interface that is part of the ECMP next-hop set for the prefix.
However, when a BGP label route is resolved to an LDP FEC (of the BGP next-hop of the BGP label route), ECMP can exist at both the BGP and LDP levels. The following next-hop selection is performed in this case:
For each BGP ECMP next hop of the label route, a single LDP next hop is selected even if multiple LDP ECMP next hops exist. Therefore, the number of ECMP next hops for the BGP IPv4 label route is equal to the number of BGP next-hops.
ECMP for a BGP IPv4 label route is only supported at the provider edge (PE) router (BGP label push operation) and not at ABR and ASBR (BGP label swap operation). Therefore, at an LSR, a BGP IPv4 label route is resolved to a single BGP next hop, which is resolved to a single LDP next hop.
LSP trace will return one downstream mapping TLV for each next-hop of the BGP IPv4 label route. It will also return the exact LDP next-hop that the datapath programmed for each BGP next-hop.
In the following description of LSP ping and LSP trace behavior, generic references are made to specific terms as follows: FEC can represent either an LDP FEC or a BGP IPv4 label router, and a Downstream Mapping TLV can represent either the DSMAP TLV or the DDMAP TLV:
If the user initiates an LSP trace of the FEC without the path-destination option specified, the sender node does not include multi-path information in the Downstream Mapping TLV in the echo request message (multipath type=0). In this case, the responder node replies with a Downstream Mapping TLV for each outgoing interface that is part of the ECMP next-hop set for the FEC. The sender node will select the first Downstream Mapping TLV only for the subsequent echo request message with incrementing TTL.
If the user initiates an LSP ping of the FEC with the path-destination option specified, the sender does not include the Downstream Mapping TLV. However, the user can configure the interface option, part of the same path-destination option, to direct the echo request message at the sender node to be sent from a specific outgoing interface that is part of an ECMP path set for the FEC.
If the user initiates an LSP trace of the FEC with the path-destination option specified but configured to exclude a Downstream Mapping TLV in the MPLS echo request message using the CLI command downstream-map-tlv {none}, the sender node does not include the Downstream Mapping TLV. However, the user can configure the interface option, part of the same path-destination option, to direct the echo request message at the sender node to be sent out a specific outgoing interface that is part of an ECMP path set for the FEC.
If the user initiates an LSP trace of the FEC with the path-destination option specified, the sender node includes the multipath information in the Downstream Mapping TLV in the echo request message (multipath type=8). The path-destination option allows the user to exercise a specific path of a FEC in the presence of ECMP. The user enters a specific address from the 127/8 range, which is then inserted in the multipath type 8 information field of the Downstream Mapping TLV. The CPM code at each LSR in the path of the target FEC runs the same hash routine as the datapath and replies in the Downstream Mapping TLV with the specific outgoing interface the packet would have been forwarded to if it had not expired at this node and if the DEST IP field in the packet’s header was set to the 127/8 address value inserted in the multipath type 8 information.
The ldp-treetrace tool always uses the multipath type=8 value and inserts a range of 127/8 addresses instead of a single address to exercise multiple ECMP paths of an LDP FEC. The behavior is the same as the lsp-trace command with the path-destination option enabled.
The path-destination option can also be used to exercise a specific ECMP path of an LDP FEC tunneled over an RSVP LSP or ECMP path of an LDP FEC stitched to a BGP FEC in the presence of BGP ECMP paths. The user must enable the use of the DDMAP TLV either globally (config>test-oam>mpls-echo-request-downstream-map ddmap) or within the specific ldp-treetrace or LSP trace test (downstream-map-tlv ddmap option).
LSP ping and LSP trace over unnumbered IP interface
LSP ping and P2MP LSP ping operate over a network using unnumbered links without any changes. LSP trace, P2MP LSP trace and LDP treetrace are modified such that the unnumbered interface is correctly encoded in the downstream mapping (DSMAP/DDMAP) TLV.
In a RSVP P2P or P2MP LSP, the upstream LSR encodes the downstream router ID in the Downstream IP Address field and the local unnumbered interface index value in the Downstream Interface Address field of the DSMAP/DDMAP TLV as per RFC 4379. Both values are taken from the TE database.
In a LDP unicast FEC or mLDP P2MP FEC, the interface index assigned by the peer LSR is not readily available to the LDP control plane. In this case, the alternative method described in RFC 4379 is used. The upstream LSR sets the Address Type to IPv4 Unnumbered, the Downstream IP Address to a value of 127.0.0.1, and the interface index is set to 0. If an LSR receives an echo-request packet with this encoding in the DSMAP/DDMAP TLV, it will bypass interface verification but continue with label validation.
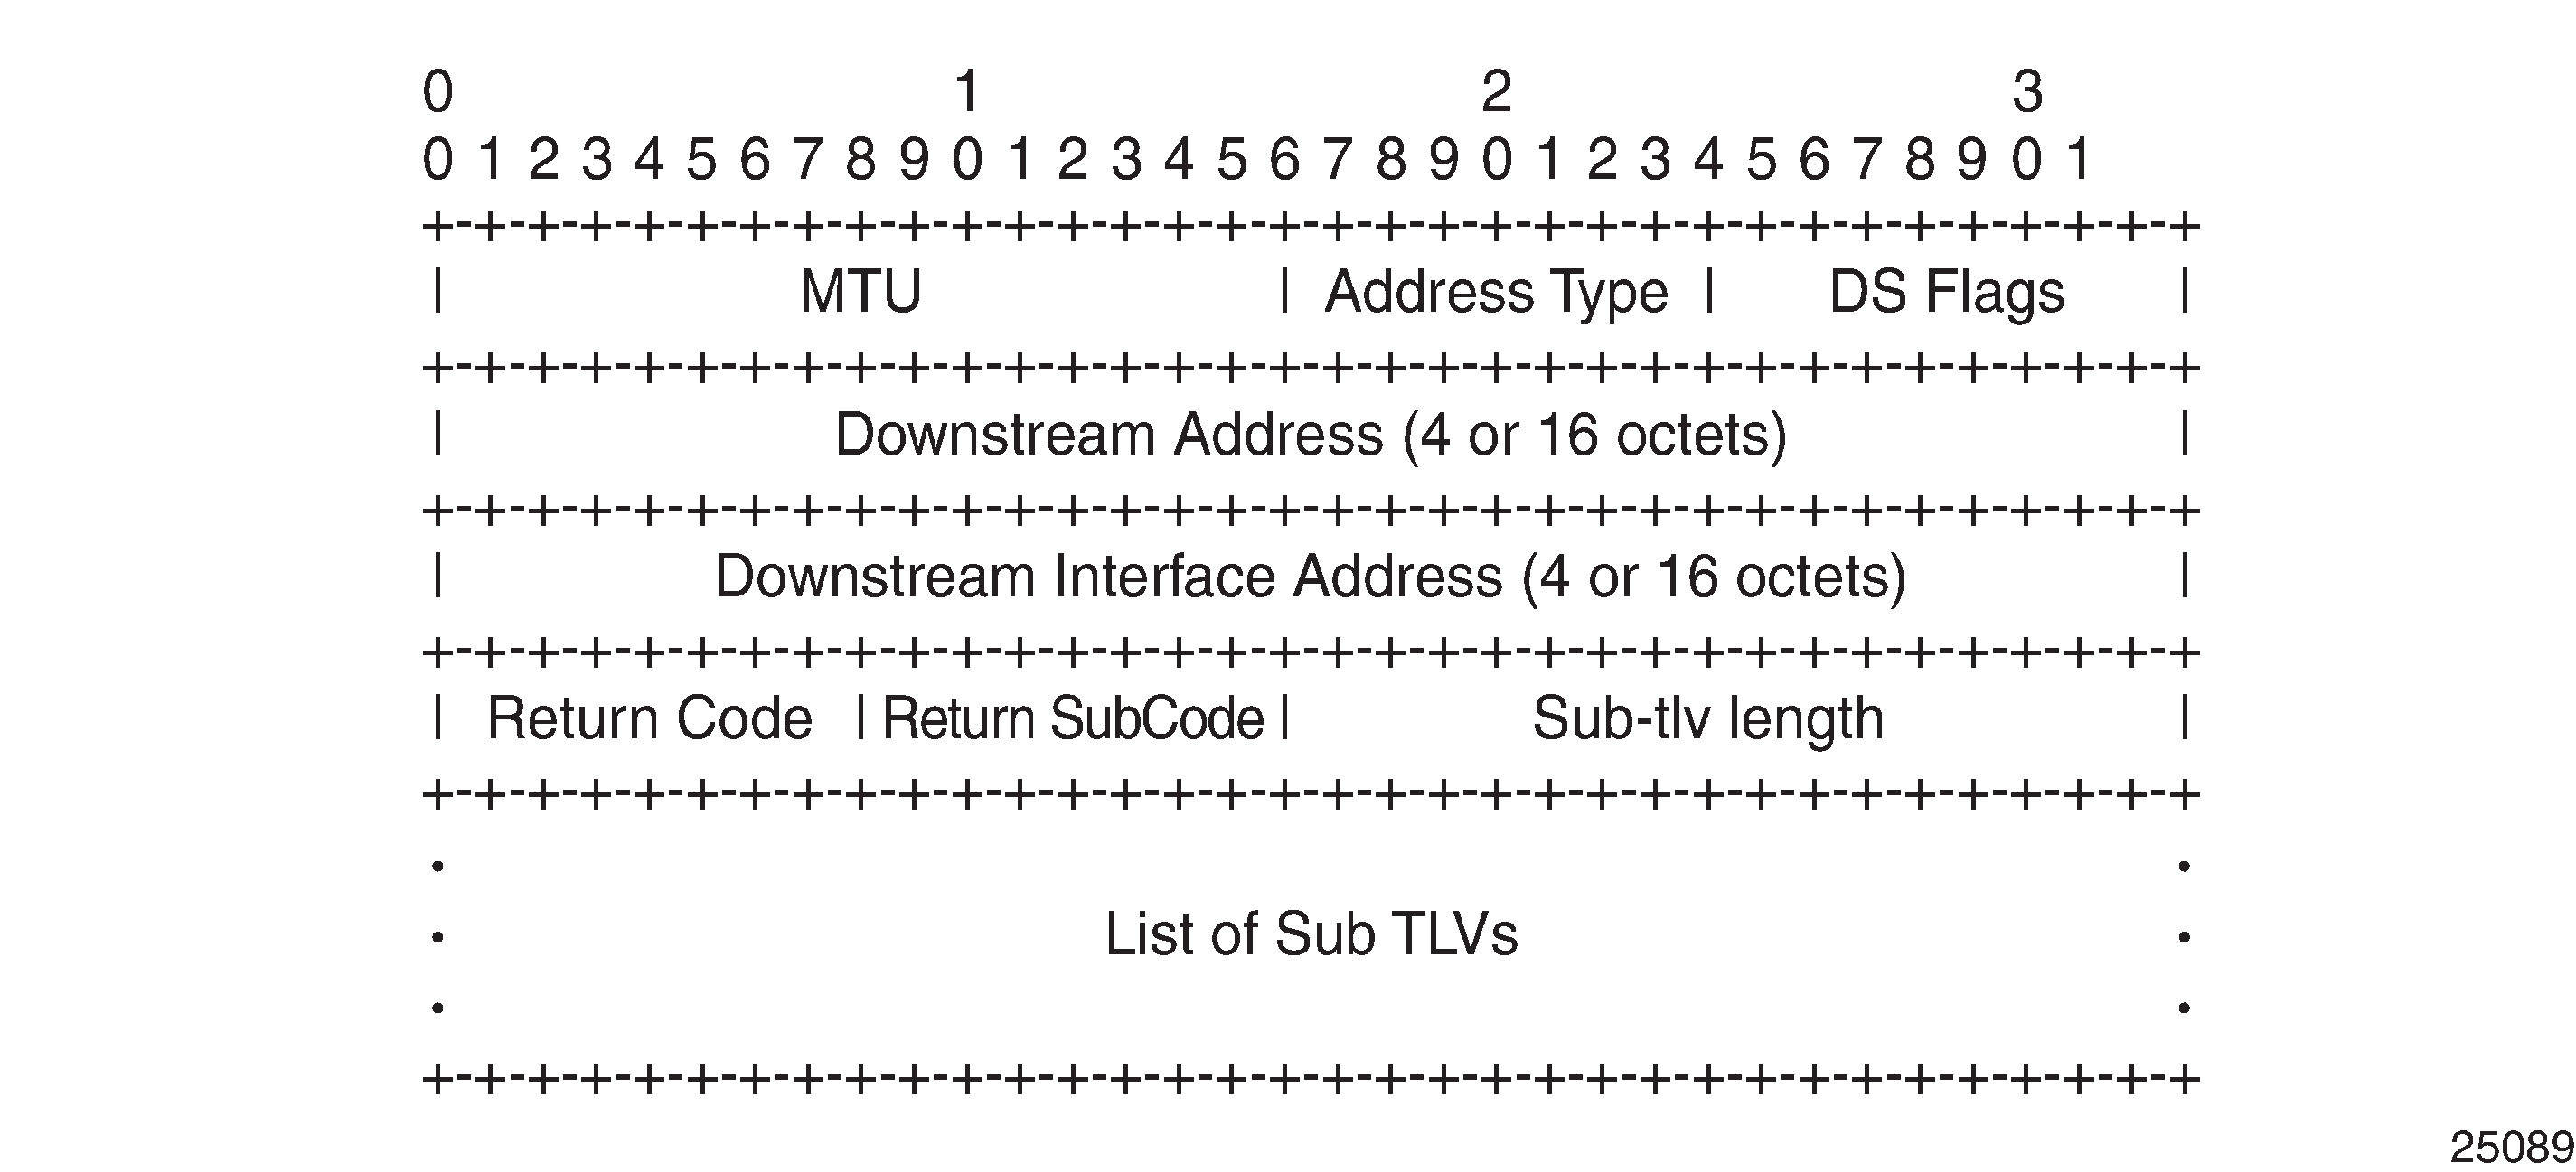
Downstream Detailed Mapping (DDMAP) TLV
The DDMAP TLV provides with exactly the same features as the existing DSMAP TLV, plus the enhancements to trace the details of LSP stitching and LSP hierarchy. The latter is achieved using a new sub-TLV of the DDMAP TLV called the FEC stack change sub-TLV. The following figures show the structures of these two objects as defined in RFC 6424.
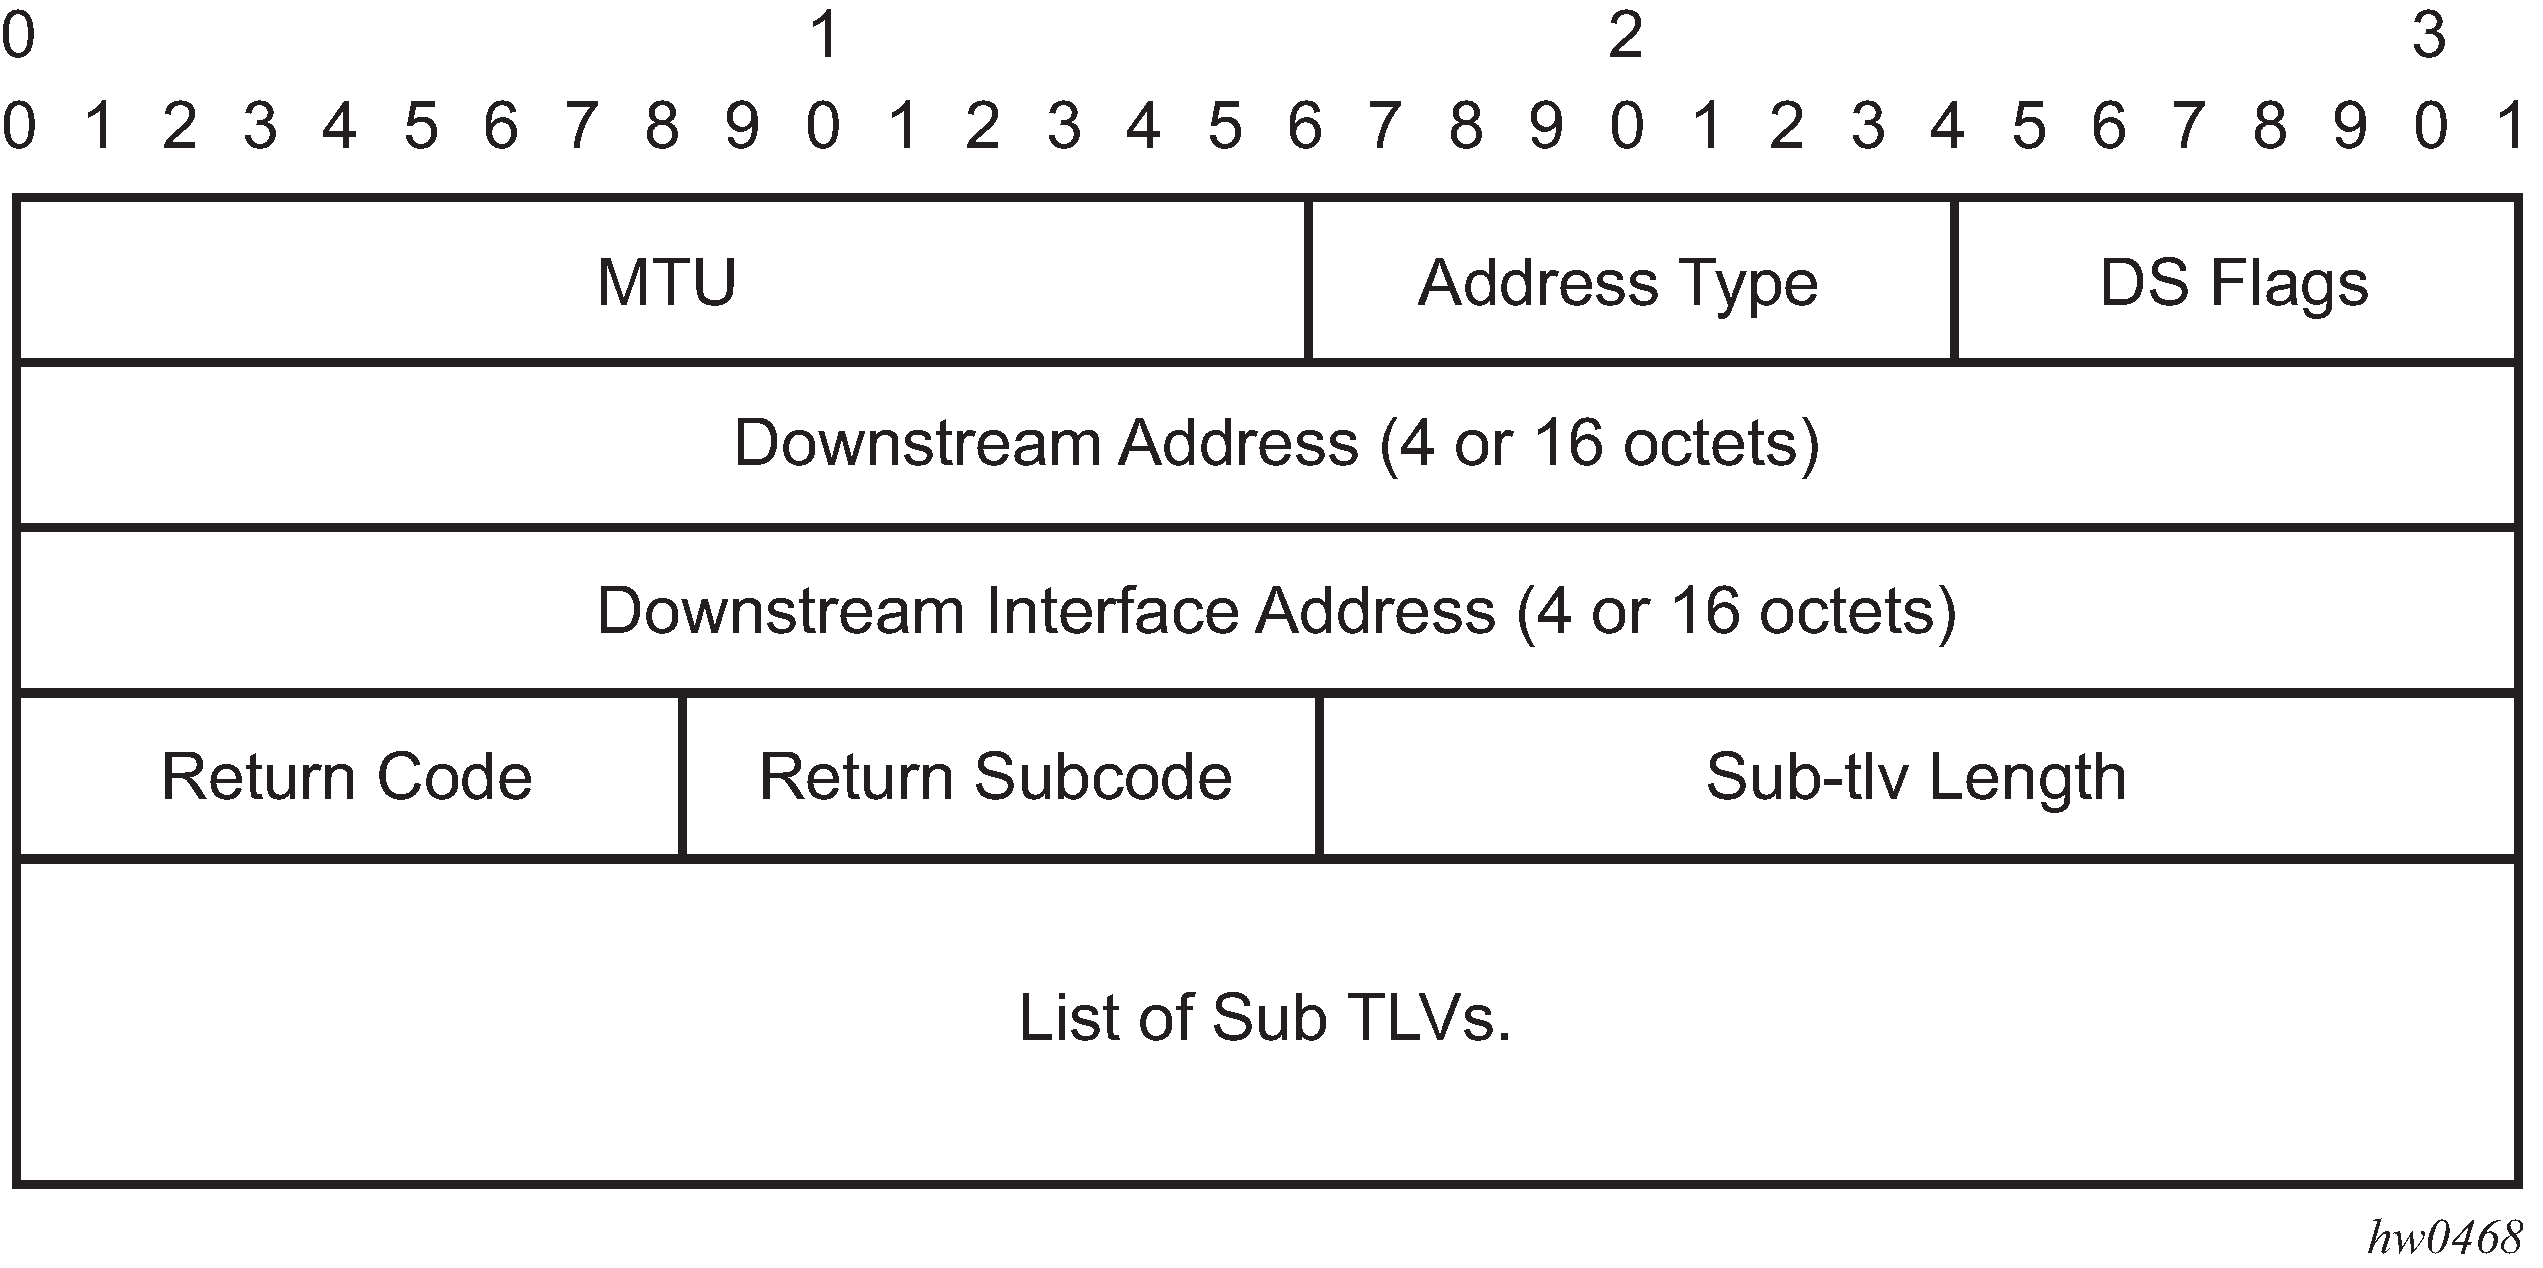
The DDMAP TLV format is derived from the DSMAP TLV format. The key change is that variable length and optional fields have been converted into sub-TLVs. The fields have the same use and meaning as in RFC 4379.
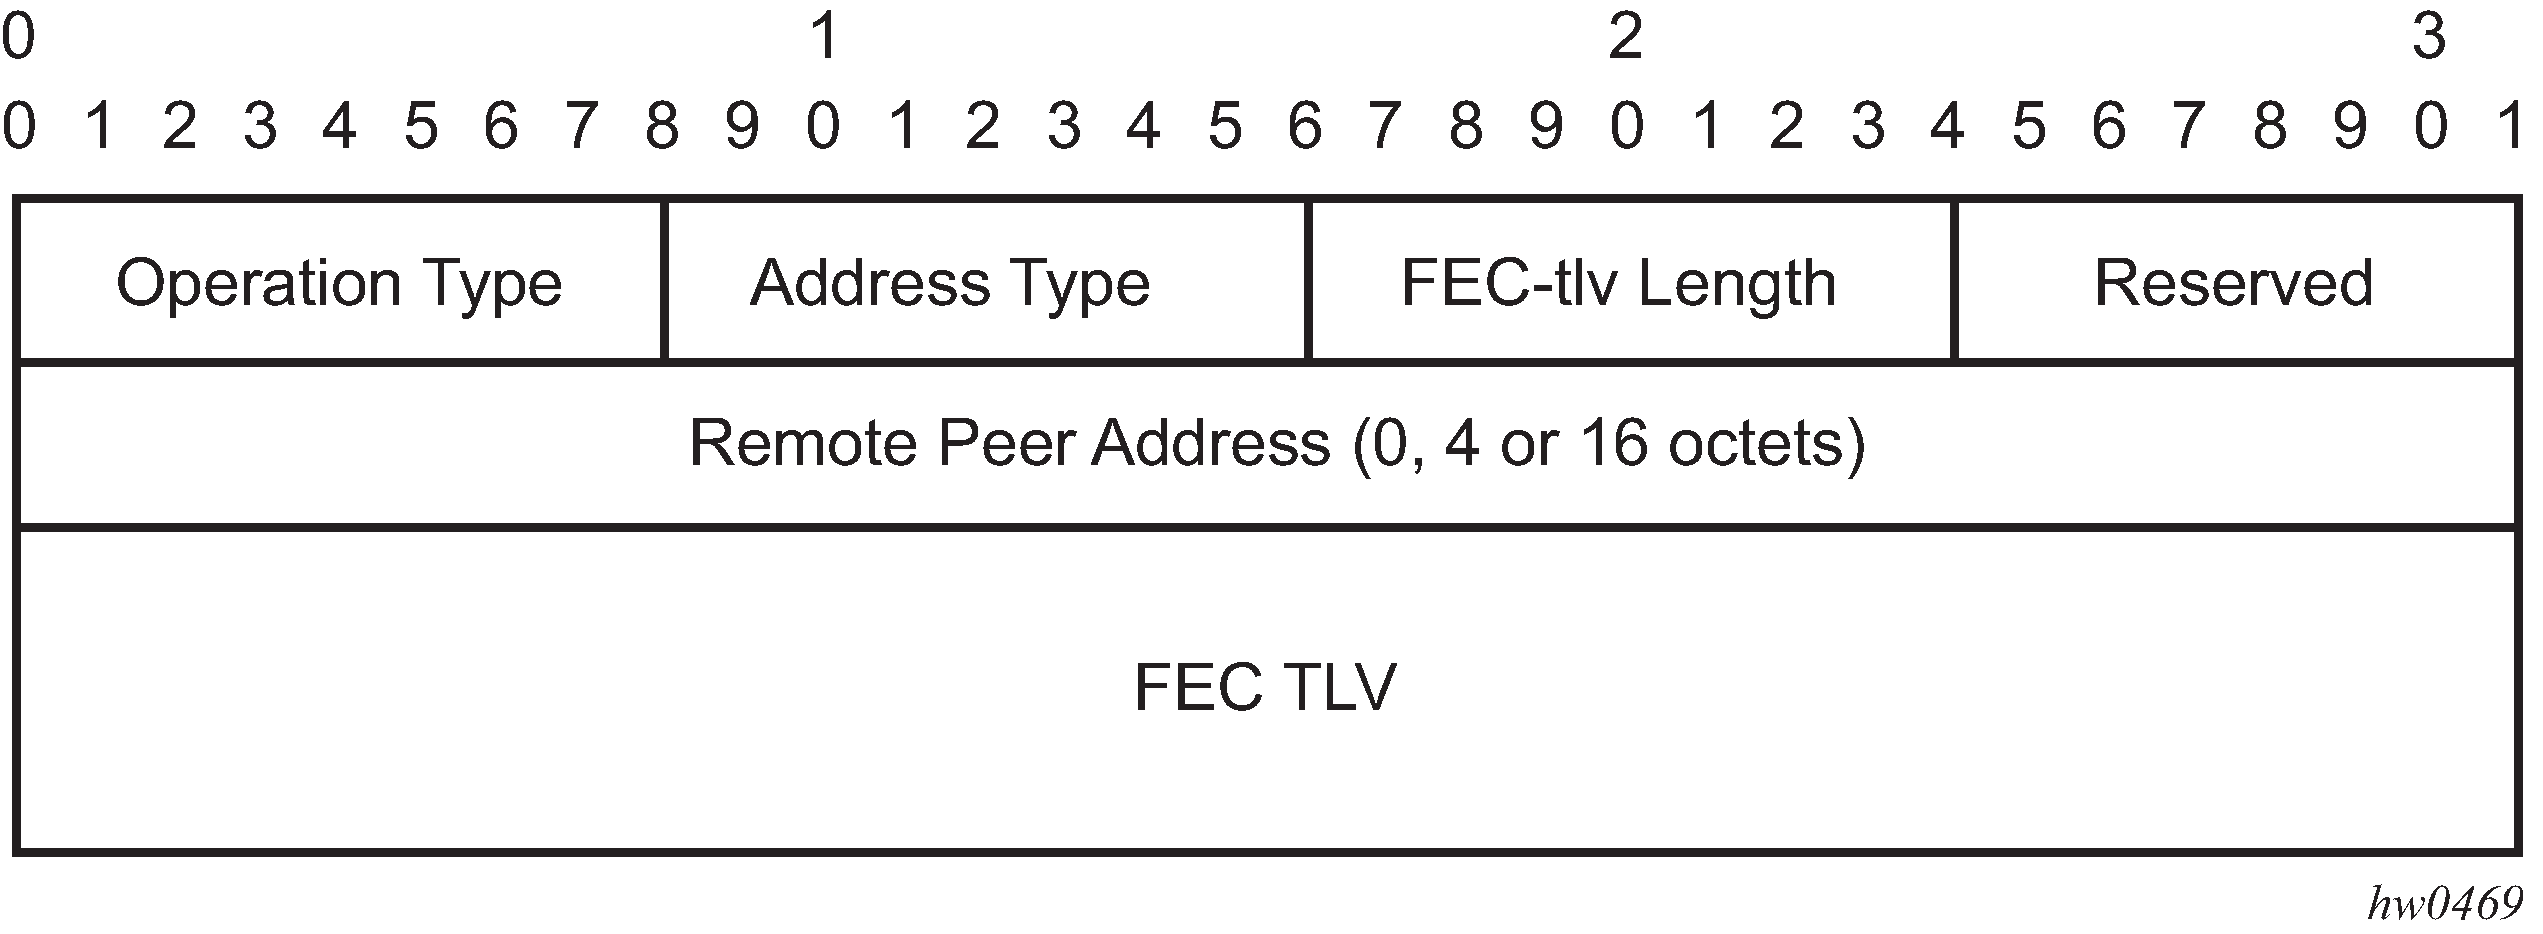
The operation type specifies the action associated with the FEC stack change. The following operation types are defined.
        Type #     Operation
        ------     ---------
        1          Push
        2          Pop
More details on the processing of the fields of the FEC stack change sub-TLV are provided later in this section.
The user can configure which downstream mapping TLV to use globally on a system by using the following command:
configure test-oam mpls-echo-request-downstream-map {dsmap | ddmap}
This command specifies which format of the downstream mapping TLV to use in all LSP trace packets and LDP tree trace packets originated on this node. The Downstream Mapping (DSMAP) TLV is the original format in RFC 4379 and is the default value. The Downstream Detailed Mapping (DDMAP) TLV is the new enhanced format specified in RFC 6424.
This command applies to LSP trace of an RSVP P2P LSP, a MPLS-TP LSP, a BGP IPv4 Label Route, or LDP unicast FEC, and to LDP tree trace of a unicast LDP FEC. It does not apply to LSP trace of an RSVP P2MP LSP which always uses the DDMAP TLV.
The global DSMAP/DDMAP setting impacts the behavior of both OAM LSP trace packets and SAA test packets of type lsp-trace and is used by the sender node when one of the following events occurs:
An SAA test of type lsp-trace is created (not modified) and no value is specified for the per-test downstream-map-tlv {dsmap | ddmap | none} option. In this case the SAA test downstream-map-tlv value defaults to the global mpls-echo-request-downstream-map value.
An OAM test of type lsp-trace test is executed and no value is specified for the per-test downstream-map-tlv {dsmap | ddmap | none} option. In this case, the OAM test downstream-map-tlv value defaults to the global mpls-echo-request-downstream-map value.
A consequence of the preceding rules is that a change to the value of mpls-echo-request-downstream-map option does not affect the value inserted in the downstream mapping TLV of existing tests.
The following are the details of the processing of the new DDMAP TLV:
When either the DSMAP TLV or the DDMAP TLV is received in an echo request message, the responder node will include the same type of TLV in the echo reply message with the correct downstream interface information and label stack information.
If an echo request message without a Downstream Mapping TLV (DSMAP or DDMAP) expires at a node which is not the egress for the target FEC stack, the responder node always includes the DSMAP TLV in the echo reply message. This can occur in the following cases:
The user issues a LSP trace from a sender node with a min-ttl value higher than 1 and a max-ttl value lower than the number of hops to reach the egress of the target FEC stack. This is the sender node behavior when the global configuration or the per-test setting of the DSMAP/DDMAP is set to DSMAP.
The user issues a LSP ping from a sender node with a ttl value lower than the number of hops to reach the egress of the target FEC stack. This is the sender node behavior when the global configuration of the DSMAP/DDMAP is set to DSMAP.
The behavior in 2.a is changed when the global configuration or the per-test setting of the Downstream Mapping TLV is set to DDMAP. The sender node will include in this case the DDMAP TLV with the Downstream IP address field set to the all-routers multicast address as per Section 3.3 of RFC 4379. The responder node then bypasses the interface and label stack validation and replies with a DDMAP TLV with the correct downstream information for the target FEC stack.
A sender node never includes the DSMAP or DDMAP TLV in an LSP ping message.
Using DDMAP TLV in LSP stitching and LSP hierarchy
In addition to performing the same features as the DSMAP TLV, the new DDMAP TLV addresses the following scenarios:
Full validation of an LDP FEC stitched to a BGP IPv4 label route. In this case, the LSP trace message is inserted from the LDP LSP segment or from the stitching point.
Full validation of a BGP IPv4 label route stitched to an LDP FEC. The LSP trace message is inserted from the BGP LSP segment or from the stitching point.
Full validation of an LDP FEC which is stitched to a BGP LSP and stitched back into an LDP FEC. In this case, the LSP trace message is inserted from the LDP segments or from the stitching points.
Full validation of an LDP FEC tunneled over an RSVP LSP using LSP trace.
Full validation of a BGP IPv4 label route tunneled over an RSVP LSP or an LDP FEC.
To correctly check a target FEC which is stitched to another FEC (stitching FEC) of the same or a different type, or which is tunneled over another FEC (tunneling FEC), it is necessary for the responding nodes to provide details about the FEC manipulation back to the sender node. This is achieved via the use of the new FEC stack change sub-TLV in the Downstream Detailed Mapping TLV (DDMAP) defined in RFC 6424.
When the user configures the use of the DDMAP TLV on a trace for an LSP that does not undergo stitching or tunneling operation in the network, the procedures at the sender and responder nodes are the same as in the case of the existing DSMAP TLV.
This feature however introduces changes to the target FEC stack validation procedures at the sender and responder nodes in the case of LSP stitching and LSP hierarchy. These changes pertain to the processing of the new FEC stack change sub-TLV in the new DDMAP TLV and the new return code 15 Label switched with FEC change. The following is a description of the main changes which are a superset of the rules described in Section 4 of RFC 6424 to allow greater scope of interoperability with other vendor implementations.
Responder node procedures
The following are responder node procedures:
-
As a responder node, the node will always insert a global return code return code of either 3
Replying router is an egress for the FEC at stack-depth
                        <RSC>
or 14See DDMAP TLV for Return Code and Return Subcode. When the responder node inserts a global return code of 3, it will not include a DDMAP TLV.
When the responder node includes the DDMAP TLV, it inserts a global return
 code
                        14
See DDMAP TLV for Return Code and Return Subcodeand:On a success response, include a return code of 15 in the DDMAP TLV for each downstream which has a FEC stack change TLV.
On a success response, include a return
code 8 Label switched at stack-depth <RSC>in the DDMAP TLV for each downstream if no FEC stack change sub-TLV is present.On a failure response, include an appropriate error return code in the DDMAP TLV for each downstream.
A tunneling node indicates that it is pushing a FEC (the tunneling FEC) on top of the target FEC stack TLV by including a FEC stack change sub-TLV in the DDMAP TLV with a FEC operation type value of PUSH. It also includes a return
code 15 Label switched with FEC change. The downstream interface address and downstream IP address fields of the DDMAP TLV are populated for the pushed FEC. The remote peer address field in the FEC stack change sub-TLV is populated with the address of the control plane peer for the pushed FEC. The Label stack sub-TLV provides the full label stack over the downstream interface.A node that is stitching a FEC indicates that it is performing a POP operation for the stitched FEC followed by a PUSH operation for the stitching FEC and potentially one PUSH operation for the transport tunnel FEC. It will therefore include two or more FEC stack change sub-TLVs in the DDMAP TLV in the echo reply message. It also includes and a return
code 15 Label switched with FEC change. The downstream interface address and downstream address fields of the DDMAP TLV are populated for the stitching FEC. The remote peer address field in the FEC stack change sub-TLV of type POP is populated with a null value (0.0.0.0). The remote peer address field in the FEC stack change sub-TLV of type PUSH is populated with the address of the control plane peer for the tunneling FEC. The Label stack sub-TLV provides the full label stack over the downstream interface.If the responder node is the egress for one or more FECs in the target FEC Stack, then it must reply with no DDMAP TLV and with a return
code 3 Replying router is an egress for the FEC at stack-depth <RSC>. RSC must be set to the depth of the topmost FEC.This operation is iterative in the sense that, at the receipt of the echo reply message, the sender node will pop the topmost FEC from the target stack FEC TLV and resend the echo request message with the same TTL value as described in step 5 as follows. The responder node will therefore perform exactly the same operation as described in this step until all FECs are popped or until the topmost FEC in the target FEC stack TLV matches the tunneled or stitched FEC. In the latter case, processing of the target FEC stack TLV follows again steps 1 or 2.
Sender node procedures
The following are sender node procedures:
If the echo reply message contains the return
code 14 See DDMAP TLV for Return Code and Return Subcodeand the DDMAP TLV has a returncode 15 Label switched with FEC change, the sender node adjusts the target FEC Stack TLV in the echo request message for the next value of the TTL to reflect the operation on the current target FEC stack as indicated in the FEC stack change sub-TLV received in the DDMAP TLV of the last echo reply message. That is, one FEC is popped at most and one or more FECs are pushed as indicated.If the echo reply message contains the return
code 3 Replying router is an egress for the FEC at stack-depth <RSC>, then:If the value for the label stack depth specified in the Return Sub-Code (RSC) field is the same as the depth of current target FEC Stack TLV, then the sender node considers the trace operation complete and terminates it. A responder node will cause this case to occur as per step 6 of the Responder node procedures.
If the value for the label stack depth specified in the Return Sub-Code (RSC) field is different from the depth of the current target FEC Stack TLV, the sender node must continue the LSP trace with the same TTL value after adjusting the target FEC stack TLV by removing the top FEC. Note this step will continue iteratively until the value for the label stack depth specified in the Return Sub-Code (RSC) field is the same as the depth of current target FEC Stack TLV and in which case step 2.a is performed. A responder node will cause this case to occur as per step 6 of the Responder node procedures.
If a DDMAP TLV with or without a FEC stack change sub-TLV is included, then the sender node must ignore it and processing is performed as per steps 2.a or 2.b preceding. A responder node will not cause this case to occur but a third party implementation may do.
As a sender node, the can accept an echo-reply message with the global return code of either 14 (with DDMAP TLV return code of 15 or 8), or15 and process correctly the FEC stack change TLV as per step 1 of the sender node procedures.
If an LSP ping is performed directly to the egress LER of the stitched FEC, there is no DDMAP TLV included in the echo request message and therefore the responder node, which is the egress node, will still reply with return
code 4 Replying router has no mapping for the FEC at stack- depth <RSC>. This case cannot be resolved with this feature.
The following limitation applies when a BGP IPv4 label route is resolved to an LDP FEC which is
resolved to an RSVP LSP all on the same node. This 2-level LSP hierarchy is not
supported as a feature on SR OS but the user is not prevented from configuring it. In that case, user and OAM
packets are forwarded by the sender node using two labels (T-LDP and BGP). The LSP
trace will fail on the downstream node with return code 1 Malformed echo
request received because there is no label entry for the RSVP
label.
MPLS OAM support in segment routing
This feature is supported only on the 7210 SAS-Mxp, 7210 SAS-R6 (IMM-b and IMM-c only), 7210 SAS-R12 (IMM-b and IMM-c only), 7210 SAS-Sx/S 1/10GE (standalone mode), and 7210 SAS-Sx 10/100GE (standalone mode).
MPLS OAM supports segment routing extensions to lsp-ping and lsp-trace as defined in draft-ietf-mpls-spring-lsp-ping.
When the data plane uses MPLS encapsulation, MPLS OAM tools such as lsp-ping and lsp-trace can be used to check connectivity and trace the path to any midpoint or endpoint of an SR-ISIS or SR-OSPF shortest path tunnel.
The CLI options for lsp-ping and lsp-trace are under OAM and SAA for SR-ISIS and SR-OSPF node SID tunnels.
SR extensions for LSP-PING and LSP-TRACE
This section describes how MPLS OAM models the SR tunnel types.
An SR shortest path tunnel, SR-ISIS or SR-OSPF tunnel, uses a single FEC element in the target FEC stack TLV. The FEC corresponds to the prefix of the node SID in a specific IGP instance.
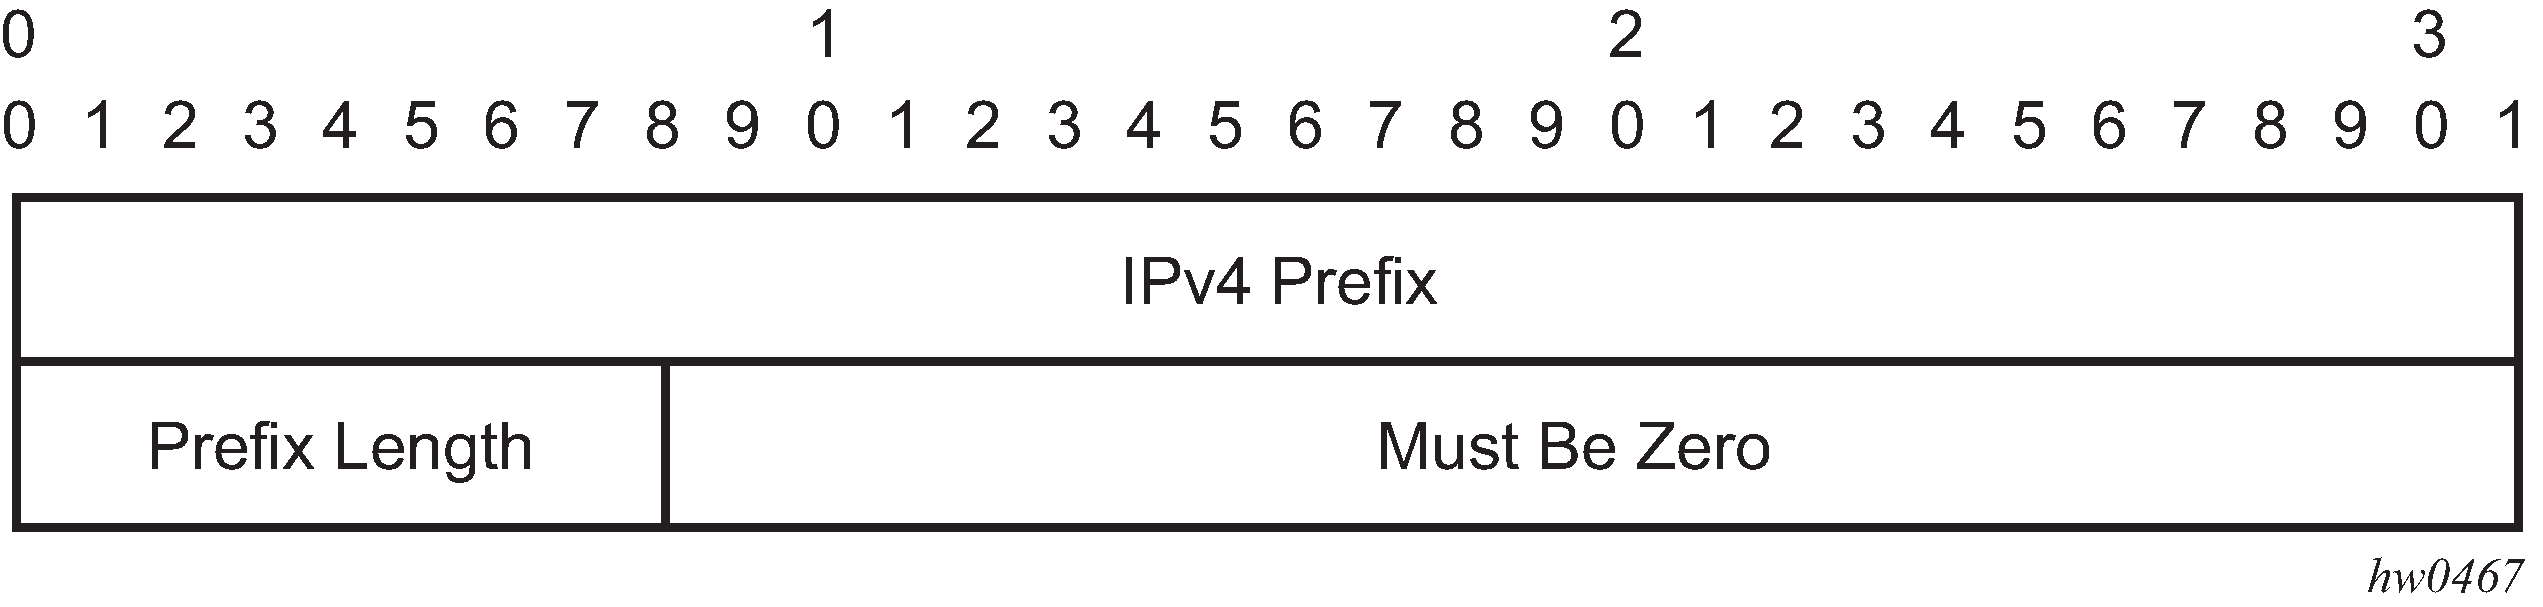
The following figure shows the format of the IPv4 IGP-prefix segment ID.
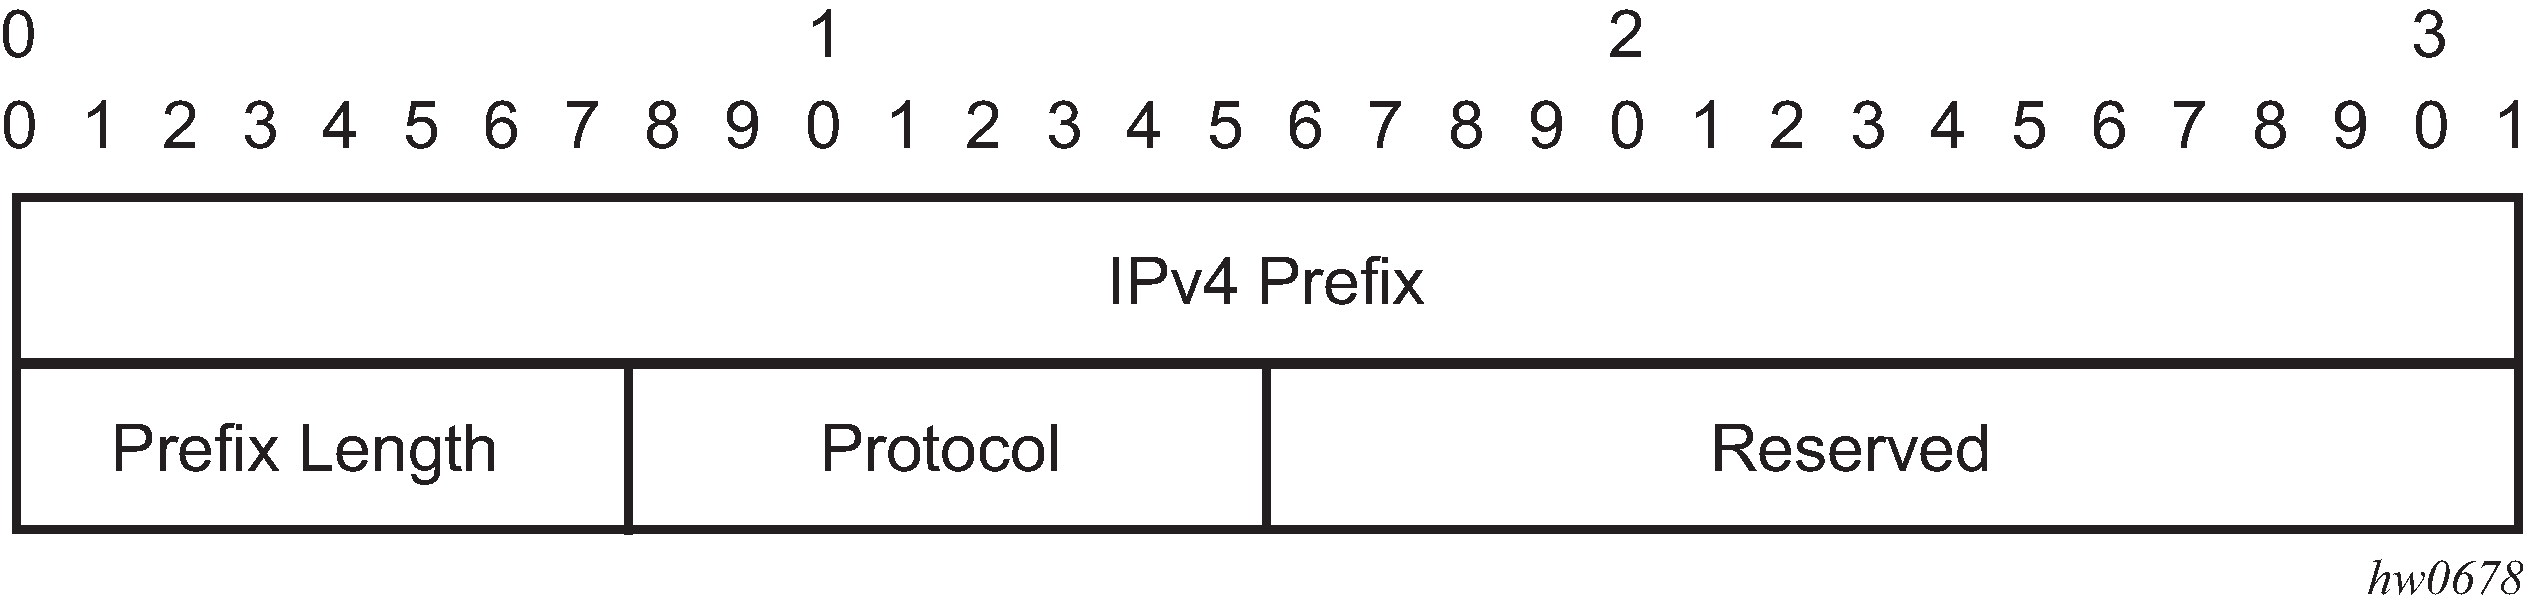
In this format, the fields are as follows:
IPv4 prefix
The IPv4 Prefix field carries the IPv4 prefix to which the segment ID is assigned. For an anycast segment ID, this field carries the IPv4 anycast address. If the prefix is shorter than 32 bits, trailing bits must be set to zero.
Prefix length
The Prefix Length field is one octet. It gives the length of the prefix in bits; allowed values are 1 to 32.
Protocol
The Protocol field is set to 1 if the IGP protocol is OSPF and 2 if the IGP protocol is IS-IS.
Both lsp-ping and lsp-trace apply to the following contexts:
SR-ISIS or SR-OSPF shortest path IPv4 tunnel
SR-ISIS IPv4 tunnel stitched to an LDP IPv4 FEC
BGP IPv4 LSP resolved over an SR-ISIS IPv4 tunnel or an SR-OSPF IPv4 tunnel; including support for BGP LSP across AS boundaries and for ECMP next-hops at the transport tunnel level
Operating guidelines on SR-ISIS or SR-OSPF tunnels
The following operating guidelines apply to lsp-ping and lsp-trace:
The sender node builds the target FEC stack TLV with a single FEC element corresponding to the destination node SID of the SR-ISIS or SR-OSPF tunnel.
A node SID label swapped at the LSR results in return code 8, ‟Label switched at stack-depth <RSC>” in accordance with RFC 4379.
A node SID label that is popped at the LSR results in return code 3, ‟Replying router is an egress for the FEC at stack-depth <RSC>”.
The lsp-trace command is supported with the inclusion of the DSMAP TLV, the DDMAP TLV, or none. If none is configured, no map TLV is sent. The downstream interface information is returned, along with the egress label for the node SID tunnel and the protocol that resolved the node SID at the responder node.
The following figure shows a sample topology for an lsp-ping and lsp-trace for SR-ISIS node SID tunnels.
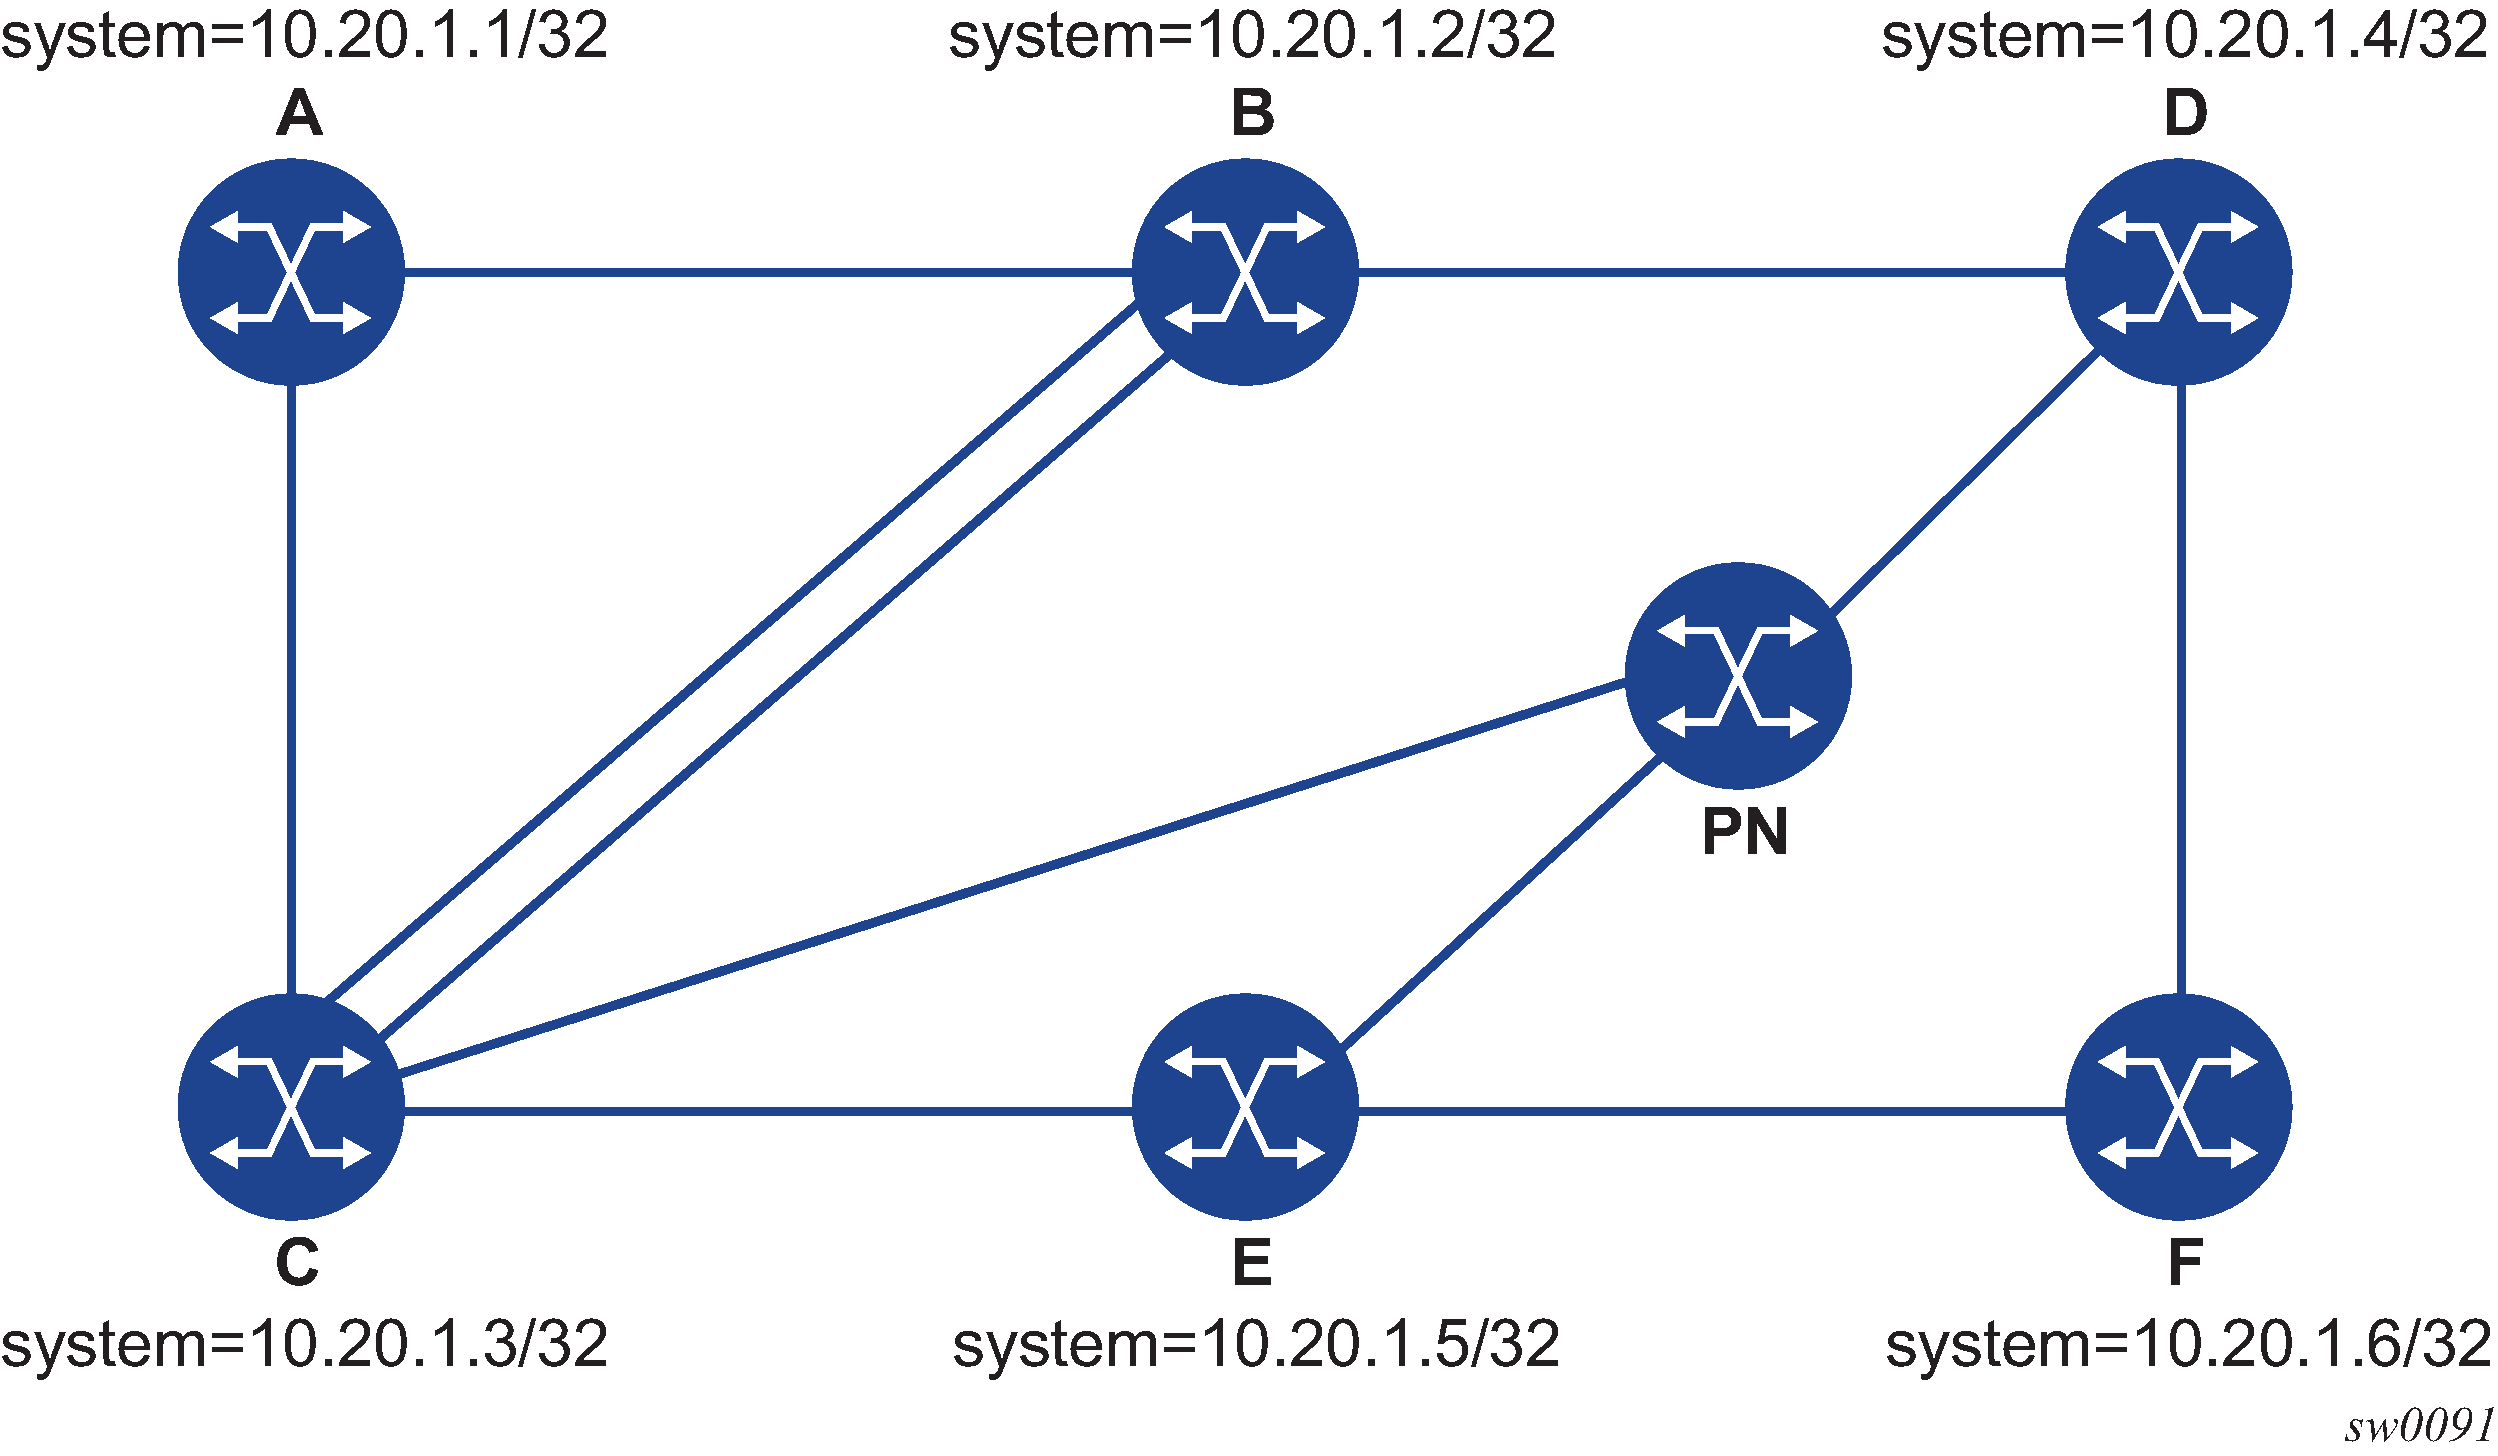
Given this topology, the following output is an example of LSP-PING on DUT-A for target node SID on DUT-F.
*A:Dut-A# oam lsp-ping sr-isis prefix 10.20.1.6/32 igp-instance 0 detail
LSP-PING 10.20.1.6/32: 80 bytes MPLS payload
Seq=1, send from intf int_to_B, reply from 10.20.1.6
       udp-data-len=32 ttl=255 rtt=3.2ms rc=3 (EgressRtr)
---- LSP 10.20.1.6/32 PING Statistics ----
1 packets sent, 1 packets received, 0.00% packet loss
round-trip min = 3.2ms, avg = 3.2ms, max = 3.2ms, stddev = 0.000ms
The following output is an example of LSP-TRACE on DUT-A for target node SID on DUT-F (DSMAP TLV).
*A:Dut-A# oam lsp-trace sr-isis prefix 10.20.1.6/32 igp-instance 0 detail
lsp-trace to 10.20.1.6/32: 0 hops min, 0 hops max, 108 byte packets
1  10.20.1.2  rtt=2.29ms rc=8(DSRtrMatchLabel) rsc=1
     DS 1: ipaddr=10.10.4.4 ifaddr=10.10.4.4 iftype=ipv4Numbered MRU=1496
           label[1]=26406 protocol=6(ISIS)
2  10.20.1.4  rtt=3.74ms rc=8(DSRtrMatchLabel) rsc=1
     DS 1: ipaddr=10.10.9.6 ifaddr=10.10.9.6 iftype=ipv4Numbered MRU=1496
           label[1]=26606 protocol=6(ISIS)
3  10.20.1.6  rtt=4.97ms rc=3(EgressRtr) rsc=1
The following output is an example of LSP-TRACE on DUT-A for target node SID on DUT-F (DDMAP TLV).
*A:Dut-A# oam lsp-trace sr-isis prefix 10.20.1.6/32 igp-instance 0 downstream-map-
tlv ddmap detail
lsp-trace to 10.20.1.6/32: 0 hops min, 0 hops max, 108 byte packets
1  10.20.1.2  rtt=2.56ms rc=8(DSRtrMatchLabel) rsc=1
     DS 1: ipaddr=10.10.4.4 ifaddr=10.10.4.4 iftype=ipv4Numbered MRU=1496
           label[1]=26406 protocol=6(ISIS)
2  10.20.1.4  rtt=3.59ms rc=8(DSRtrMatchLabel) rsc=1
     DS 1: ipaddr=10.10.9.6 ifaddr=10.10.9.6 iftype=ipv4Numbered MRU=1496
           label[1]=26606 protocol=6(ISIS)
3  10.20.1.6  rtt=5.00ms rc=3(EgressRtr) rsc=1
Operating guidelines on SR-ISIS tunnel stitched to LDP FEC
The following operating guidelines apply to lsp-ping and lsp-trace:
The responder and sender nodes must be in the same domain (SR or LDP) for lsp-ping tool operation.
The lsp-trace tool can operate in both LDP and SR domains. When used with the DDMAP TLV, lsp-trace provides the details of the SR-LDP stitching operation at the boundary node. The boundary node as a responder node replies with the FEC stack change TLV, which contains the following operations:
a PUSH operation of the SR (LDP) FEC in the LDP-to-SR (SR-to-LDP) direction
a POP operation of the LDP (SR) FEC in the LDP-to-SR (SR-to-LDP) direction
The following is an output example of the lsp-trace command of the DDMAP TLV for LDP-to-SR direction (symmetric topology LDP-SR-LDP).
*A:Dut-E# oam lsp-trace prefix 10.20.1.2/32 detail downstream-map-tlv ddmap
lsp-trace to 10.20.1.2/32: 0 hops min, 0 hops max, 108 byte packets
1  10.20.1.3  rtt=3.25ms rc=15(LabelSwitchedWithFecChange) rsc=1
     DS 1: ipaddr=10.10.3.2 ifaddr=10.10.3.2 iftype=ipv4Numbered MRU=1496
           label[1]=26202 protocol=6(ISIS)
           fecchange[1]=POP  fectype=LDP IPv4 prefix=10.20.1.2 remotepeer=0.0.0.0
(Unknown)
           fecchange[2]=PUSH fectype=SR Ipv4 Prefix prefix=10.20.1.2 remotepeer=10.1
0.3.2
2  10.20.1.2  rtt=4.32ms rc=3(EgressRtr) rsc=1
*A:Dut-E#
The following output is an example of the lsp-trace command of the DDMAP TLV for SR-to-LDP direction (symmetric topology LDP-SR-LDP).
*A:Dut-B# oam lsp-trace prefix 10.20.1.5/32 detail downstream-map-tlv ddmap sr-isis
lsp-trace to 10.20.1.5/32: 0 hops min, 0 hops max, 108 byte packets
1  10.20.1.3  rtt=2.72ms rc=15(LabelSwitchedWithFecChange) rsc=1
     DS 1: ipaddr=10.11.5.5 ifaddr=10.11.5.5 iftype=ipv4Numbered MRU=1496
           label[1]=262143 protocol=3(LDP)
           fecchange[1]=POP  fectype=SR Ipv4 Prefix prefix=10.20.1.5 remotepeer=0.0.
0.0 (Unknown)
           fecchange[2]=PUSH fectype=LDP IPv4 prefix=10.20.1.5 remotepeer=10.11.5.5
2  10.20.1.5  rtt=4.43ms rc=3(EgressRtr) rsc=1
Operation on a BGP IPv4 LSP resolved over an SR-ISIS IPv4 tunnel or an SR-OSPF IPv4 tunnel
The 7210 SAS enhances lsp-ping and lsp-trace of a BGP IPv4 LSP resolved over an SR-ISIS IPv4 tunnel or an SR-OSPF IPv4 tunnel. The 7210 SAS enhancement reports the full set of ECMP next-hops for the transport tunnel at both ingress PE and at the ABR or ASBR. The list of downstream next-hops is reported in the DSMAP or DDMAP TLV.
If an lsp-trace of the BGP IPv4 LSP is initiated with the path-destination option specified, the CPM hash code at the responder node selects the outgoing interface to return in the DSMAP or DDMAP TLV. The decision is based on the modulo operation of the hash value on the label stack or the IP headers (where the DST IP is replaced by the specific 127/8 prefix address in the multipath type 8 field of the DSMAP or DDMAP) of the echo request message and the number of outgoing interfaces in the ECMP set.
The following figure shows a sample topology used in the subsequent BGP over SR-OSPF and BGP over SR-ISIS examples.
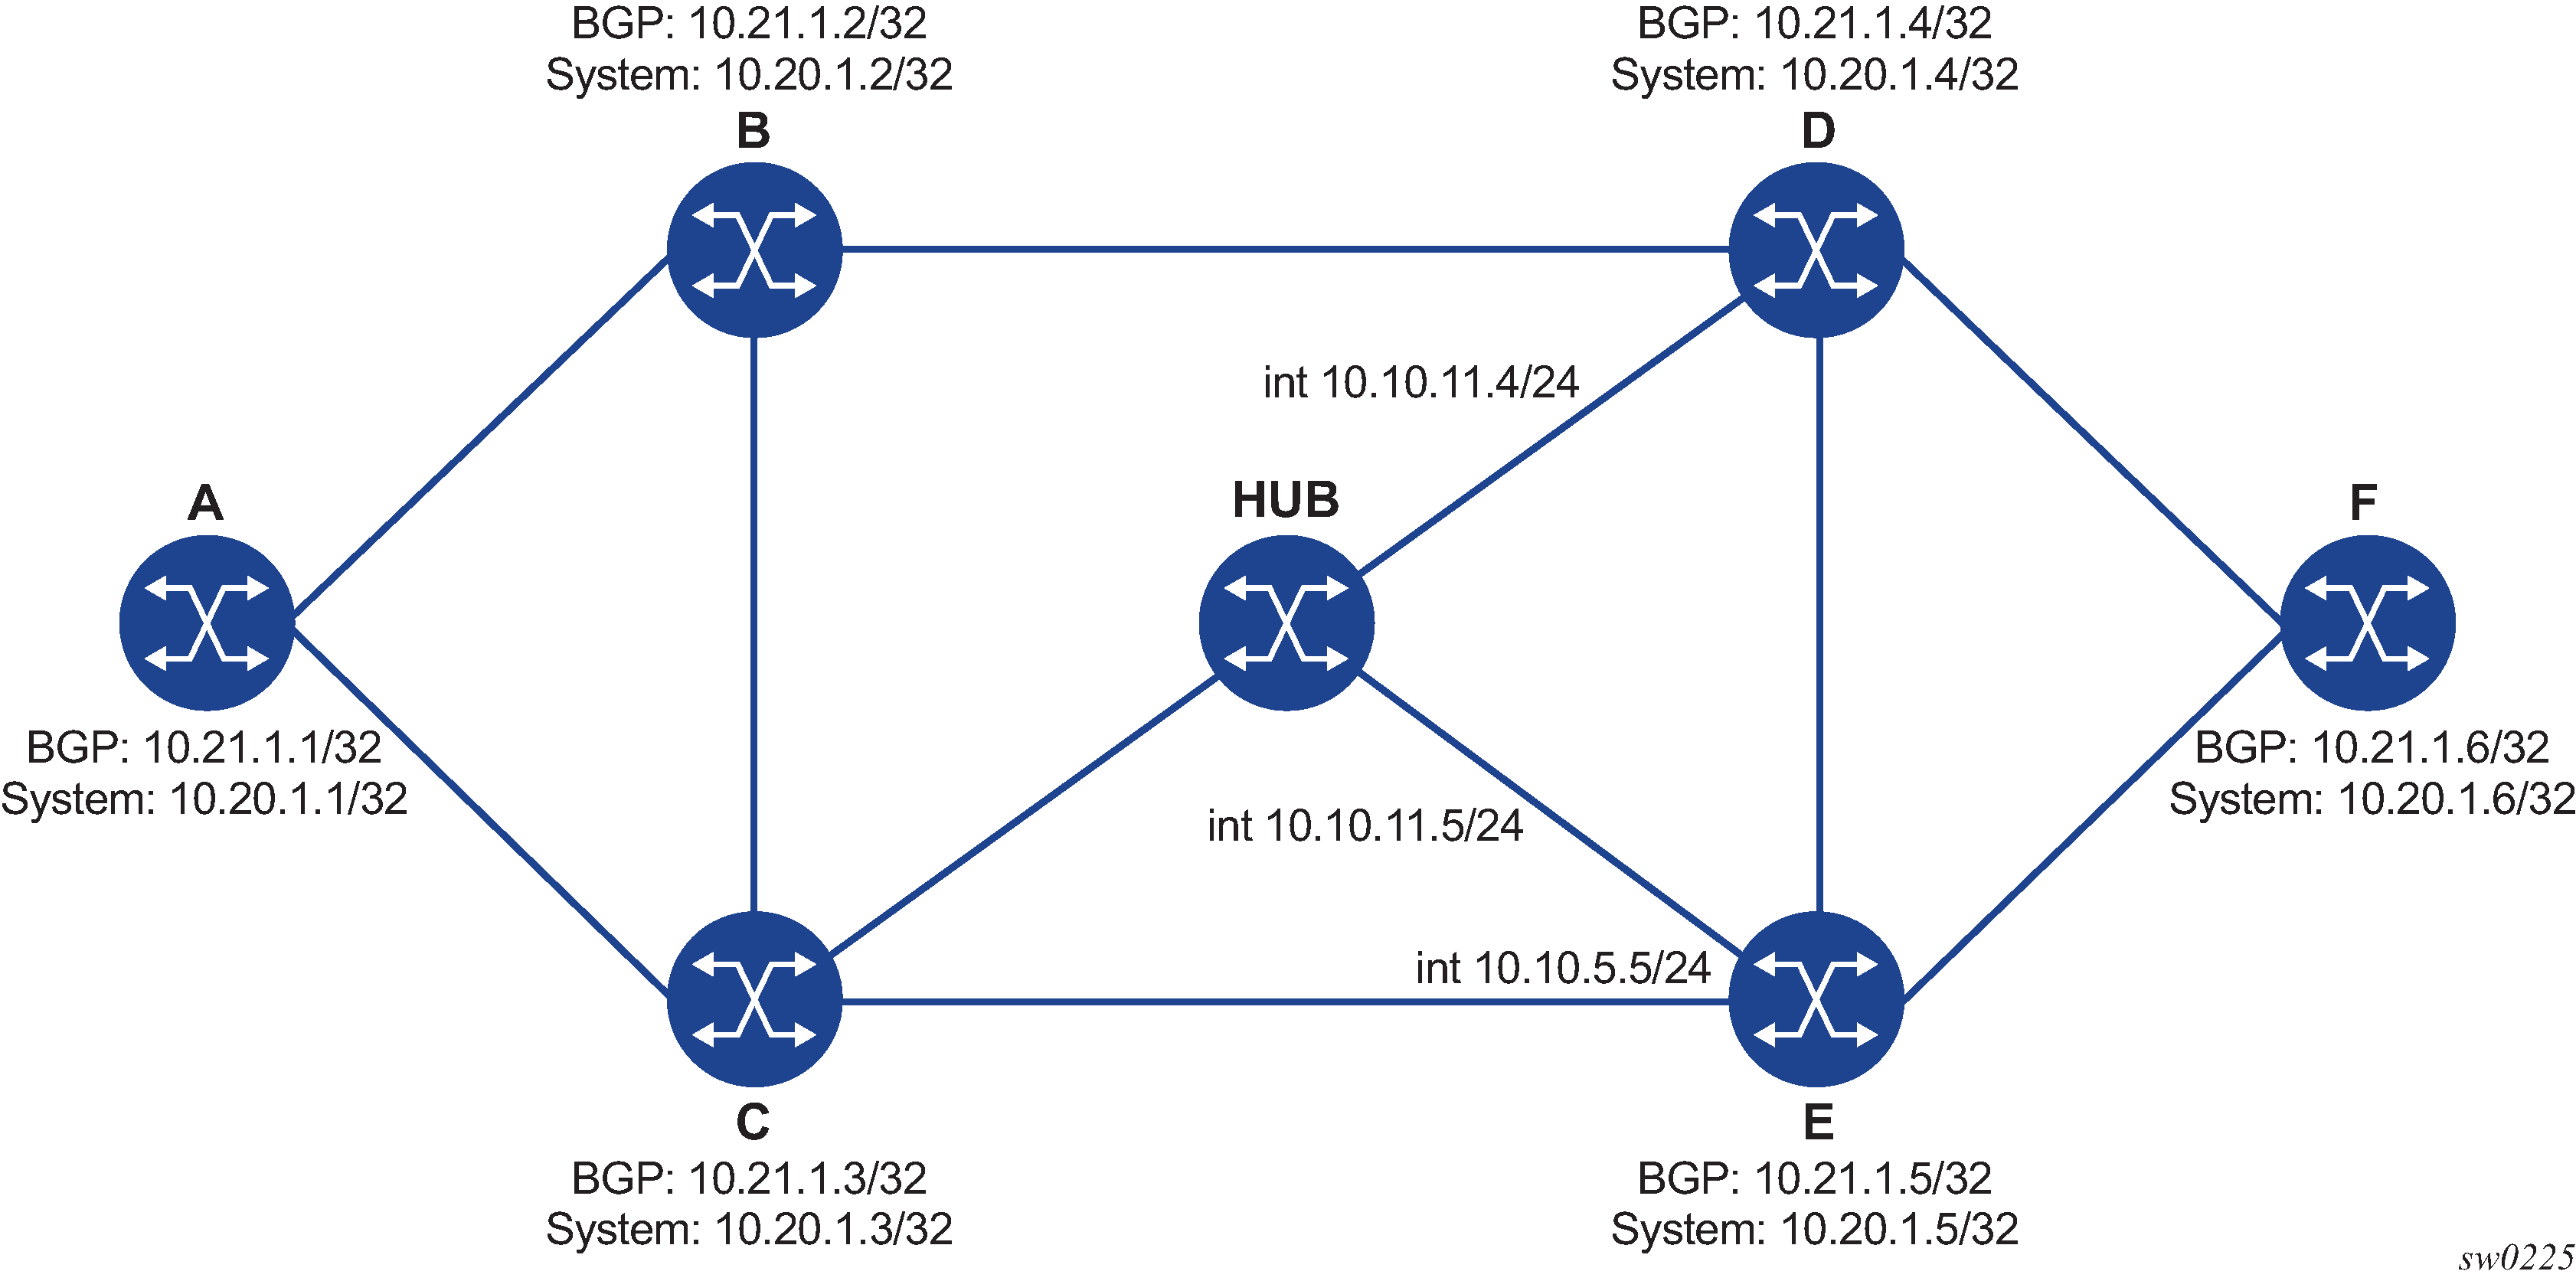
The following outputs are examples of the lsp-trace command for a hierarchical tunnel consisting of a BGP IPv4 LSP resolved over an SR-ISIS IPv4 tunnel or an SR-OSPF IPv4 tunnel.
The following output is an example of BGP over SR-OSPF.
*A:Dut-A# oam lsp-trace bgp-label prefix 10.21.1.6/32 detail downstream-map-
tlv ddmap path-destination 127.1.1.
lsp-trace to 10.21.1.6/32: 0 hops min, 0 hops max, 168 byte packets
1  10.20.1.3  rtt=2.31ms rc=8(DSRtrMatchLabel) rsc=2
     DS 1: ipaddr=10.10.5.5 ifaddr=10.10.5.5 iftype=ipv4Numbered MRU=1496
           label[1]=27506 protocol=5(OSPF)
           label[2]=262137 protocol=2(BGP)
     DS 2: ipaddr=10.10.11.4 ifaddr=10.10.11.4 iftype=ipv4Numbered MRU=1496
           label[1]=27406 protocol=5(OSPF)
           label[2]=262137 protocol=2(BGP)
     DS 3: ipaddr=10.10.11.5 ifaddr=10.10.11.5 iftype=ipv4Numbered MRU=1496
           label[1]=27506 protocol=5(OSPF)
           label[2]=262137 protocol=2(BGP)
2   10.20.1.4  rtt=4.91ms rc=8(DSRtrMatchLabel) rsc=2
     DS 1: ipaddr=10.10.9.6 ifaddr=10.10.9.6 iftype=ipv4Numbered MRU=1492
           label[1]=27606 protocol=5(OSPF)
           label[2]=262137 protocol=2(BGP)
3  10.20.1.6  rtt=4.73ms rc=3(EgressRtr) rsc=2
3  10.20.1.6  rtt=5.44ms rc=3(EgressRtr) rsc=1
*A:Dut-A#
The following output is an example of BGP over SR-ISIS.
A:Dut-A# oam lsp-trace bgp-label prefix 10.21.1.6/32 detail downstream-map-
tlv ddmap path-destination 127.1.1.1
lsp-trace to 10.21.1.6/32: 0 hops min, 0 hops max, 168 byte packets
1  10.20.1.3  rtt=3.33ms rc=8(DSRtrMatchLabel) rsc=2
    DS 1:  ipaddr=10.10.5.5 ifaddr=10.10.5.5 iftype=ipv4Numbered MRU=1496
           label[1]=28506 protocol=6(ISIS)
           label[2]=262139 protocol=2(BGP)
     DS 2: ipaddr=10.10.11.4 ifaddr=10.10.11.4 iftype=ipv4Numbered MRU=1496
           label[1]=28406 protocol=6(ISIS)
           label[2]=262139 protocol=2(BGP)
     DS 3: ipaddr=10.10.11.5 ifaddr=10.10.11.5 iftype=ipv4Numbered MRU=1496
           label[1]=28506 protocol=6(ISIS)
           label[2]=262139 protocol=2(BGP)
2  10.20.1.4  rtt=5.12ms rc=8(DSRtrMatchLabel) rsc=2
     DS 1: ipaddr=10.10.9.6 ifaddr=10.10.9.6 iftype=ipv4Numbered MRU=1492
           label[1]=28606 protocol=6(ISIS)
           label[2]=262139 protocol=2(BGP)
3  10.20.1.6  rtt=8.41ms rc=3(EgressRtr) rsc=2
3  10.20.1.6  rtt=6.93ms rc=3(EgressRtr) rsc=1
Assuming the topology in the following figure includes an eBGP peering between nodes B and C, the BGP IPv4 LSP spans the AS boundary and resolves to an SR-ISIS tunnel within each AS.
The following output is an example of BGP over SR-ISIS using inter-AS option C.
*A:Dut-A# oam lsp-trace bgp-label prefix 10.20.1.6/32 src-ip-
address 10.20.1.1 detail downstream-map-tlv ddmap path-destination 127.1.1.1
lsp-trace to 10.20.1.6/32: 0 hops min, 0 hops max, 168 byte packets
1  10.20.1.2  rtt=2.69ms rc=3(EgressRtr) rsc=2
1  10.20.1.2  rtt=3.15ms rc=8(DSRtrMatchLabel) rsc=1
     DS 1: ipaddr=10.10.3.3 ifaddr=10.10.3.3 iftype=ipv4Numbered MRU=0
           label[1]=262127 protocol=2(BGP)
2  10.20.1.3  rtt=5.26ms rc=15(LabelSwitchedWithFecChange) rsc=1
     DS 1: ipaddr=10.10.5.5 ifaddr=10.10.5.5 iftype=ipv4Numbered MRU=1496
           label[1]=26506 protocol=6(ISIS)
           label[2]=262139 protocol=2(BGP)
           fecchange[1]=PUSH fectype=SR Ipv4 Prefix prefix=10.20.1.6 remotepeer=10.1
0.5.5
3  10.20.1.5  rtt=7.08ms rc=8(DSRtrMatchLabel) rsc=2
     DS 1: ipaddr=10.10.10.6 ifaddr=10.10.10.6 iftype=ipv4Numbered MRU=1496
           label[1]=26606 protocol=6(ISIS)
       label[2]=262139 protocol=2(BGP)
4  10.20.1.6  rtt=9.41ms rc=3(EgressRtr) rsc=2
4  10.20.1.6  rtt=9.53ms rc=3(EgressRtr) rsc=1
LSP ping for RSVP P2MP LSP
RSVP-based signaling for P2MP LSPs is only supported on the 7210 SAS-Mxp, 7210 SAS-R6, 7210 SAS-R12, 7210 SAS-Sx/S 1/10GE (standalone and standalone-VC mode), and 7210 SAS-T.
P2MP LSP is only supported on the 7210 SAS-Mxp, 7210 SAS-R6, 7210 SAS-R12, 7210 SAS-Sx/S 1/10GE (standalone and standalone-VC mode), and 7210 SAS-T.
Enter the following OAM command to generate an LSP ping:
oam p2mp-lsp-ping lsp-name [p2mp-instance instance-name [s2l-dest-addr ip-address [...up to 5 max]]] [fc fc-name] [size octets] [ttl label-ttl] [timeout timeout] [detail]
An echo request message is sent on the active P2MP instance and replicated in the datapath over all branches of the P2MP LSP instance. By default, all egress LER nodes that are leaves of the P2MP LSP instance reply to the echo request message.
To reduce the scope of the echo reply message, explicitly enter a list of addresses specifying the egress LER nodes that must reply. A maximum of five addresses can be specified in a single execution of the p2mp-lsp-ping command. If all five egress LER nodes are router nodes, they will parse the list of egress LER addresses and reply. In accordance with RFC 6425, only the top address in the P2MP egress identifier TLV is inspected by an egress LER. When interoperating with other implementations, the egress LER router node responds if its address is in the list. Also, if another vendor implementation is the egress LER, only the egress LER matching the top address in the TLV responds.
If the user enters the same egress LER address more than once in a single p2mp-lsp-ping command, the head-end node displays a response to a single address and displays a single error warning message for the duplicates. When queried over SNMP, the head-end node issues a single response trap and issues no trap for the duplicates.
Set the value of the timeout parameter to the time it would take to get a response from all probed leaves under no failure conditions. For that purpose, the parameter range extends to 120 seconds for a p2mp-lsp-ping from a 10-second lsp-ping for P2P LSP. The default value is 10 seconds.
If the user explicitly lists the address of the egress LER for a specific S2L in the ping command, the router head-end node displays a ‟Send_Fail” error when a specific S2L path is down.
Similarly, if the user explicitly lists the address of the egress LER for a specific S2L in the ping command, the router head-end node displays the timeout error when no response is received for an S2L after the expiry of the timeout timer.
Configure a specific value of the ttl parameter to force the echo request message to expire on a router branch node or a bud LSR node. The bud LSR node replies with a downstream mapping TLV for each branch of the P2MP LSP in the echo reply message. A maximum of 16 downstream mapping TLVs can be included in a single echo reply message. The multipath type is set to zero in each downstream mapping TLV and, consequently, does not include egress address information for the reachable egress LER nodes for this P2MP LSP.
If the router ingress LER node receives the new multipath type field with the list of egress LER addresses in an echo reply message from another vendor implementation, the router ignores the message, but this does not cause a processing error for the downstream mapping TLV.
If the ping command expires at an LSR node that is performing a remerge or crossover operation in the datapath between two or more ILMs of the same P2MP LSP, an echo reply message is generated for each copy of the echo request message received by this node.
If the detail parameter is omitted, the command output provides a high-level summary of error and success codes received.
If the detail parameter is specified, the command output displays a line for each replying node, similar to the output of the LSP ping for a P2P LSP.
The display is delayed until all responses are received or the timer configured in the timeout parameter expires. Entering other CLI commands while waiting for the display is not allowed. Use control-C (^C) to stop the ping operation.
LSP trace for RSVP P2MP LSP
RSVP-based signaling for P2MP LSPs is only supported on the 7210 SAS-Mxp, 7210 SAS-R6, 7210 SAS-R12, 7210 SAS-Sx/S 1/10GE (standalone and standalone-VC mode), and 7210 SAS-T.
P2MP LSP is only supported on the 7210 SAS-Mxp, 7210 SAS-R6, 7210 SAS-R12, 7210 SAS-Sx/S 1/10GE (standalone and standalone-VC mode), and 7210 SAS-T.
Generate an LSP trace by entering the following OAM command:
oam p2mp-lsp-trace lsp-name p2mp-instance instance-name s2l-dest-addr ip-address [fc fc-name] [size octets] [max-fail no-response-count] [probe-count probes-per-hop] [min-ttl min-label-ttl]] [max-ttl max-label-ttl] [timeout timeout] [interval interval] [detail]
The LSP trace capability allows the user to trace the path of a single S2L path of a P2MP LSP. Its operation is similar to that of the p2mp-lsp-ping command but the sender of the echo reply request message includes the downstream mapping TLV to request the downstream branch information from a branch LSR or bud LSR. The branch LSR or bud LSR will then also include the downstream mapping TLV to report the information about the downstream branches of the P2MP LSP. An egress LER does not include this TLV in the echo response message.
The operation of the probe-count parameter is modeled after the LSP trace on a P2P LSP. It represents the maximum number of probes sent per TTL value before the device gives up on receiving the echo reply message. If a response is received from the traced node before reaching the maximum number of probes, no additional probes are sent for that TTL. The sender of the echo request increments the TTL and uses the information received in the downstream mapping TLV to send probes to the node downstream of the last node that replied. This continues until the egress LER for the traced S2L path replies.
Because the command traces a single S2L path, the timeout and interval parameters keep the same value range as the LSP trace for a P2P LSP.
The following supported options in lsp-trace for P2P LSP are not applicable: path, prefix, path-destination, and [interface | next-hop].
The P2MP LSP trace uses the Downstream Detailed Mapping (DDMAP) TLV defined in RFC 6424. The following figure shows the format of the new DDMAP TLV entered in the path-destination that belongs to one of the possible outgoing interfaces of the FEC.
The DDMAP TLV format is derived from the Downstream Mapping (DSMAP) TLV format. The key change is that in the DDMAP TLV, the variable length and optional fields are converted into sub-TLVs. The fields have the same use and meaning as in RFC 4379.
Similar to P2MP LSP ping, an LSP trace probe results on all egress LER nodes that eventually receive the echo request message, but only the traced egress LER node replies to the last probe.
Any branch LSR node or bud LSR node in the P2MP LSP tree may receive a copy of the echo request message with the TTL in the outer label expiring at this node. However, only a branch LSR or bud LSR that has a downstream branch over which the traced egress LER is reachable must respond.
When a branch LSR or BUD LSR node responds to the sender of the echo request message, it sets the global return code in the echo response message to RC=14, ‟See DDMAP TLV for Return Code and Return Sub-Code” and the return code in the DDMAP TLV corresponding to the outgoing interface of the branch used by the traced S2L path to RC=8, ‟Label switched at stack-depth <RSC>”.
Because a single egress LER address, for example an S2L path, can be traced, the branch LSR or bud LSR node sets the multipath type to zero in the downstream mapping TLV in the echo response message because including an egress LER address is not required.
LSP trace behavior when S2L path traverses a re-merge node
P2MP LSPs are supported only on the 7210 SAS-Mxp, 7210 SAS-R6, 7210 SAS-R12, 7210 SAS-Sx/S 1/10GE (standalone and standalone-VC mode), and 7210 SAS-T.
When a node performs a re-merge of one or more ILMs of the P2MP LSP to which the traced S2L sub-LSP belongs, it may block the ILM over which the traced S2L resides. This causes the trace to either fail or to succeed with a missing hop.
The following is an example of this behavior:
S2L1 and S2L2 use ILMs that re-merge at node B. Depending of which ILM is blocked at B, the TTL=2 probe will either yield two responses or timeout.
S2L1 = ACBDF (to leaf F)
S2L2 = ABDE (to leaf E)

   A
 /  \
B -- C
|
D
| \
F  E
-
Tracing S2L1 when ILM on interface C-B blocked at node B:
-
For TTL=1, A gets a response from C only as B does not have S2L1 on the ILM on interface A-B.
-
For TTL=2, assume A gets first the response from B which indicates a success. It then builds the next probe with TTL=3. B will only pass the copy of the message arriving on interface A-B and will drop the one arriving on interface C-B (treats it like a data packet since it does not expire at node B). This copy will expire at F. However F will return a "DSMappingMismatched" error because the DDMAP TLV was the one provided by node B in TTL=2 step. The trace will abort at this point in time. However, A knows it got a second response from Node D for TTL=2 with a "DSMappingMismatched" error.
-
If A gets the response from D first with the error code, it waits to see if it gets a response from B or it times out. In either case, it will log this status as multiple replies received per probe in the last probe history and aborts the trace.
-
-
Tracing S2L2 when ILM on interface A-B blocked at node B:
-
For TTL=1, B responds with a success. C does not respond as it does not have an ILM for S2L2.
-
For TTL=2, B drops the copy coming on interface A-B. It receives a copy coming on interface B-C but will drop it as the ILM does not contain S2L2. Node A times out. Next, node A generates a probe with TTL=3 without a DDMAP TLV. This time node D will respond with a success and will include its downstream DDMAP TLV to node E. The rest of the path will be discovered correctly. The traced path for S2L2 will look something like: A-B-(*)-D-E.
-
The router ingress LER detects a re-merge condition when it receives two or more replies to the same probe, such as the same TTL value. It displays the following message to the user regardless if the trace operation successfully reached the egress LER or was aborted earlier:
Probe returned multiple responses. Result may be inconsistent.
This warning message indicates to the user the potential of a re-merge scenario and that a p2mp-lsp-ping command for this S2L should be used to verify that the S2L path is not defective.
The router ingress LER behavior is to always proceed to the next ttl probe when it receives an OK response to a probe or when it times out on a probe. If however it receives replies with an error return code, it must wait until it receives an OK response or it times out. If it times out without receiving an OK reply, the LSP trace must be aborted.
The following are possible echo reply messages received and corresponding ingress LER behavior:
-
One or more error return codes + OK: display OK return code. Proceed to next ttl probe. Display warning message at end of trace.
-
OK + One or more error return codes: display OK return code. Proceed to next ttl probe right after receiving the OK reply but keep state that more replies received. Display warning message at end of trace.
-
OK + OK: should not happen for re-merge but would continue trace on 1st OK reply. This is the case when one of the branches of the P2MP LSP is activating the P2P bypass LSP. In this case, the head-end node will get a reply from both a regular P2MP LSR which has the ILM for the traced S2L and from an LSR switching the P2P bypass for other S2Ls. The latter does not have context for the P2MP LSP being tunneled but will respond after doing a label stack validation.
-
One error return code + timeout: abort LSP trace and display error code. Ingress LER cannot tell the error is because of a re-merge condition.
-
More than one error return code + timeout: abort LSP trace and display first error code. Display warning message at end of trace.
-
Timeout on probe without any reply: display ‟*” and proceed to next ttl probe.
SDP diagnostics
The 7210 SAS SDP diagnostics are SDP ping and SDP MTU path discovery.
SDP ping
SDP ping performs in-band unidirectional or round-trip connectivity tests on SDPs. The SDP ping OAM packets are sent in-band, in the tunnel encapsulation, so it will follow the same path as traffic within the service. The SDP ping response can be received out-of-band in the control plane, or in-band using the data plane for a round-trip test.
For a unidirectional test, SDP ping tests:
egress SDP ID encapsulation
ability to reach the far-end IP address of the SDP ID within the SDP encapsulation
path MTU to the far-end IP address over the SDP ID
forwarding class mapping between the near-end SDP ID encapsulation and the far-end tunnel termination
For a round-trip test, SDP ping uses a local egress SDP ID and an expected remote SDP ID. Since SDPs are unidirectional tunnels, the remote SDP ID must be specified and must exist as a configured SDP ID on the far-end 7210 SAS. SDP round trip testing is an extension of SDP connectivity testing with the additional ability to test:
remote SDP ID encapsulation
potential service round trip time
round trip path MTU
round trip forwarding class mapping
SDP MTU path discovery
In a large network, network devices can support a variety of packet sizes that are transmitted across its interfaces. This capability is referred to as the Maximum Transmission Unit (MTU) of network interfaces. It is important to understand the MTU of the entire path end-to-end when provisioning services, especially for virtual leased line (VLL) services where the service must support the ability to transmit the largest customer packet.
The Path MTU discovery tool provides a powerful tool that enables service provider to get the exact MTU supported by the network's physical links between the service ingress and service termination points (accurate to one byte).
Service diagnostics
The Nokia service ping feature provides end-to-end connectivity testing for an individual service. Service ping operates at a higher level than the SDP diagnostics in that it verifies an individual service and not the collection of services carried within an SDP.
Service ping is initiated from a 7210 SAS router to verify round-trip connectivity and delay to the far-end of the service. -The Nokia implementation functions for MPLS tunnels and tests the following from edge-to-edge:
tunnel connectivity
VC label mapping verification
service existence
service provisioned parameter verification
round trip path verification
service dynamic configuration verification
VPLS MAC diagnostics
While the LSP ping, SDP ping and service ping tools enable transport tunnel testing and verify whether the correct transport tunnel is used, they do not provide the means to test the learning and forwarding functions on a per-VPLS-service basis.
It is conceivable, that while tunnels are operational and correctly bound to a service, an incorrect Forwarding Information Base (FIB) table for a service could cause connectivity issues in the service and not be detected by the ping tools. Nokia has developed VPLS OAM functionality to specifically test all the critical functions on a per-service basis. These tools are based primarily on the IETF document draft-stokes-vkompella-ppvpn-hvpls-oam-xx.txt, Testing Hierarchical Virtual Private LAN Services.
The VPLS OAM tools are:
-
Provides an end-to-end test to identify the egress customer-facing port where a customer MAC was learned. MAC ping can also be used with a broadcast MAC address to identify all egress points of a service for the specified broadcast MAC.
-
Provides the ability to trace a specified MAC address hop-by-hop until the last node in the service domain. An SAA test with MAC trace is considered successful when there is a reply from a far-end node indicating that they have the destination MAC address on an egress SAP or the CPM.
-
Provides the ability to check network connectivity to the specified client device within the VPLS. CPE ping will return the MAC address of the client, as well as the SAP and PE at which it was learned.
-
Allows specified MAC addresses to be injected in the VPLS service domain. This triggers learning of the injected MAC address by all participating nodes in the service. This tool is generally followed by MAC ping or MAC trace to verify if correct learning occurred.
-
Allows MAC addresses to be flushed from all nodes in a service domain.
MAC ping
For a MAC ping test, the destination MAC address (unicast or multicast) to be tested must be specified. A MAC ping packet can be sent through the control plane or the data plane. When sent by the control plane, the ping packet goes directly to the destination IP in a UDP/IP OAM packet. If it is sent by the data plane, the ping packet goes out with the data plane format.
In the control plane, a MAC ping is forwarded along the flooding domain if no MAC address bindings exist. If MAC address bindings exist, then the packet is forwarded along those paths (if they are active). Finally, a response is generated only when there is an egress SAP binding to that MAC address. A control plane request is responded to via a control reply only.
In the data plane, a MAC ping is sent with a VC label TTL of 255. This packet traverses each hop using forwarding plane information for next hop, VC label, and so on. The VC label is swapped at each service-aware hop, and the VC TTL is decremented. If the VC TTL is decremented to 0, the packet is passed up to the management plane for processing. If the packet reaches an egress node, and would be forwarded out a customer facing port, it is identified by the following OAM label the VC label and passed to the management plane.
MAC pings are flooded when they are unknown at an intermediate node. They are responded to only by the egress nodes that have mappings for that MAC address.
MAC trace
A MAC trace functions like an LSP trace with some variations. Operations in a MAC trace are triggered when the VC TTL is decremented to 0.
Like a MAC ping, a MAC trace can be sent either by the control plane or the data plane.
For MAC trace requests sent by the control plane, the destination IP address is determined from the control plane mapping for the destination MAC. If the destination MAC is known to be at a specific remote site, then the far-end IP address of that SDP is used. If the destination MAC is not known, then the packet is sent unicast, to all SDPs in the service with the appropriate squelching.
A control plane MAC traceroute request is sent via UDP/IP. The destination UDP port is the LSP ping port. The source UDP port is whatever the system gives (note that this source UDP port is really the demultiplexor that identifies the particular instance that sent the request, when correlating the reply). The source IP address is the system IP of the sender.
When a traceroute request is sent via the data plane, the data plane format is used. The reply can be via the data plane or the control plane.
A data plane MAC traceroute request includes the tunnel encapsulation, the VC label, and the OAM, followed by an Ethernet DLC, a UDP and IP header. If the mapping for the MAC address is known at the sender, then the data plane request is sent down the known SDP with the appropriate tunnel encapsulation and VC label. If it is not known, then it is sent down every SDP (with the appropriate tunnel encapsulation per SDP and appropriate egress VC label per SDP binding).
The tunnel encapsulation TTL is set to 255. The VC label TTL is initially set to the min-ttl (default is 1). The OAM label TTL is set to 2. The destination IP address is the all-routers multicast address. The source IP address is the system IP of the sender.
The destination UDP port is the LSP ping port. The source UDP port is whatever the system gives (note that this source UDP port is really the demultiplexor that identifies the particular instance that sent the request, when correlating the reply).
The Reply Mode is either 3 (that is, reply via the control plane) or 4 (that is, reply through the data plane), depending on the reply-control option. By default, the data plane request is sent with Reply Mode 3 (control plane reply) Reply Mode 4 (data plane reply).
The Ethernet DLC header source MAC address is set to either the system MAC address (if no source MAC is specified) or to the specified source MAC. The destination MAC address is set to the specified destination MAC. The EtherType is set to IP.
CPE ping
The MAC ping OAM tool makes it possible to detect whether a particular MAC address has been learned in a VPLS.
The cpe-ping command extends this capability to detecting end-station IP addresses inside a VPLS. A CPE ping for a specific destination IP address within a VPLS will be translated to a MAC ping toward a broadcast MAC address. Upon receiving such a MAC ping, each peer PE within the VPLS context will trigger an ARP request for the specific IP address. The PE receiving a response to this ARP request will report back to the requesting 7210 SAS. It is encouraged to use the source IP address of 0.0.0.0 to prevent the provider’s IP address of being learned by the CE.
MAC populate
MAC populate is used to send a message through the flooding domain to learn a MAC address as if a customer packet with that source MAC address had flooded the domain from that ingress point in the service. This allows the provider to craft a learning history and engineer packets in a particular way to test forwarding plane correctness.
The MAC populate request is sent with a VC TTL of 1, which means that it is received at the forwarding plane at the first hop and passed directly up to the management plane. The packet is then responded to by populating the MAC address in the forwarding plane, like a conventional learn although the MAC will be an OAM-type MAC in the FIB to distinguish it from customer MAC addresses.
This packet is then taken by the control plane and flooded out the flooding domain (squelching appropriately, the sender and other paths that would be squelched in a typical flood).
This controlled population of the FIB is very important to manage the expected results of an OAM test. The same functions are available by sending the OAM packet as a UDP/IP OAM packet. It is then forwarded to each hop and the management plane has to do the flooding.
Options for MAC populate are to force the MAC in the table to type OAM (in case it already existed as dynamic or static or an OAM induced learning with some other binding), to prevent new dynamic learning to over-write the existing OAM MAC entry, to allow customer packets with this MAC to either ingress or egress the network, while still using the OAM MAC entry.
Finally, an option to flood the MAC populate request causes each upstream node to learn the MAC, for example, populate the local FIB with an OAM MAC entry, and to flood the request along the data plane using the flooding domain.
An age can be provided to age a particular OAM MAC after a different interval than other MACs in a FIB.
MAC purge
MAC purge is used to clear the FIBs of any learned information for a particular MAC address. This allows one to do a controlled OAM test without learning induced by customer packets. In addition to clearing the FIB of a particular MAC address, the purge can also indicate to the control plane not to allow further learning from customer packets. This allows the FIB to be clean, and be populated only via a MAC Populate.
MAC purge follows the same flooding mechanism as the MAC populate.
A UDP/IP version of this command is also available that does not follow the forwarding notion of the flooding domain, but the control plane notion of it.
VLL diagnostics
VCCV ping
VCCV ping is used to check connectivity of a VLL in-band. It checks that the destination (target) PE is the egress for the Layer 2 FEC. It provides a cross-check between the data plane and the control plane. It is in-band, meaning that the VCCV ping message is sent using the same encapsulation and along the same path as user packets in that VLL. This is equivalent to the LSP ping for a VLL service. VCCV ping reuses an LSP ping message format and can be used to test a VLL configured over an MPLS SDP.
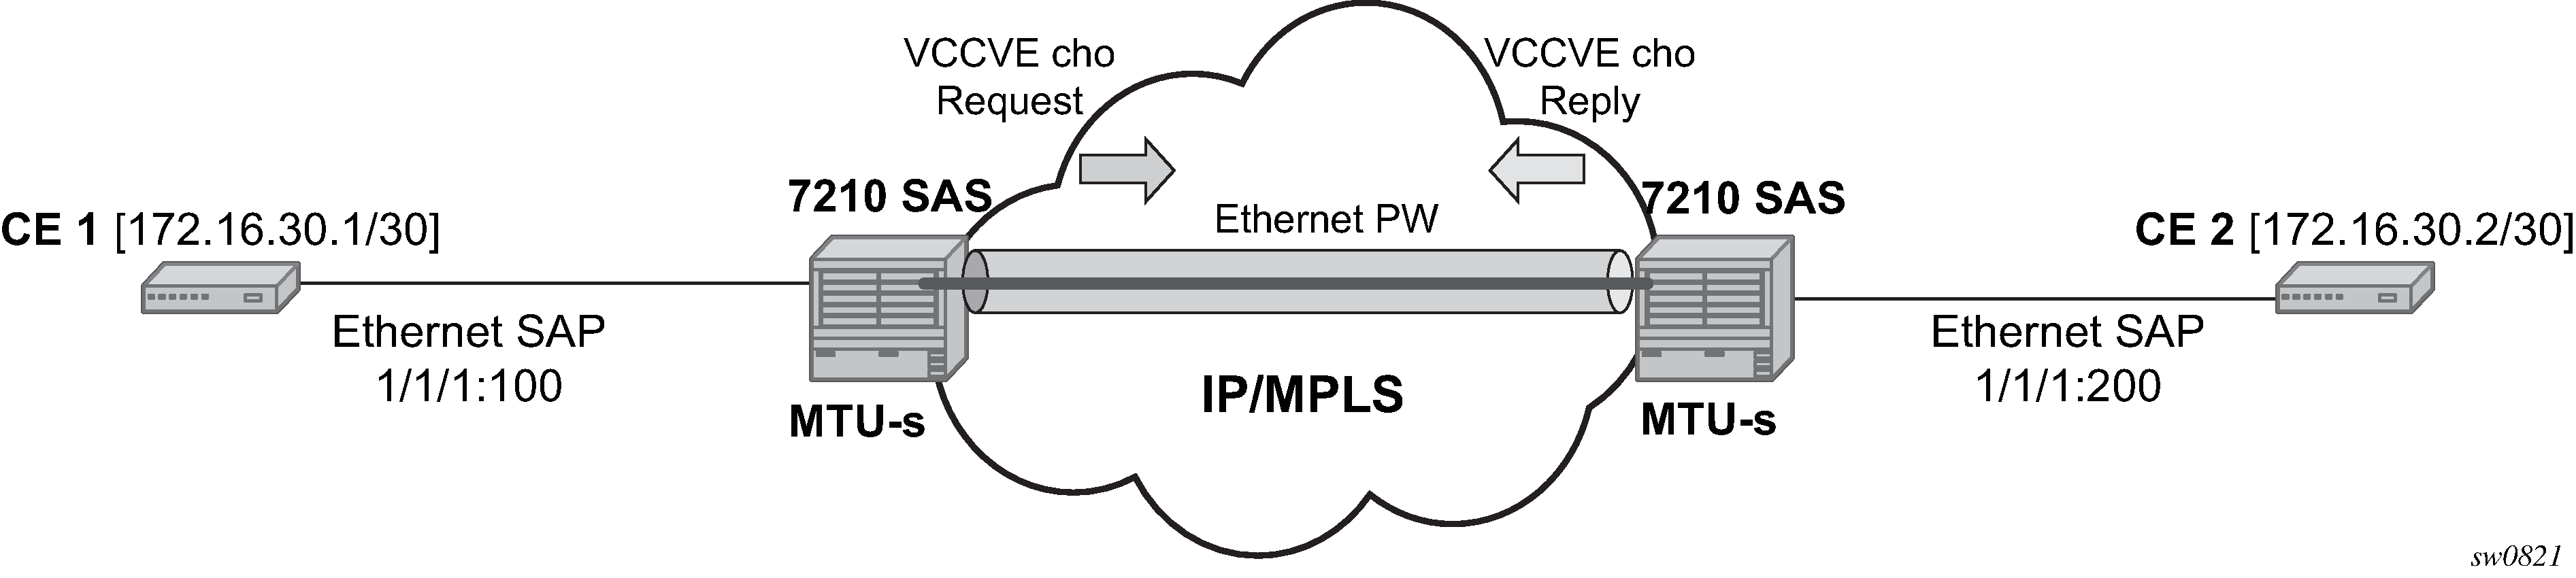
VCCV-ping application
VCCV effectively creates an IP control channel within the pseudowire between PE1 and PE2. PE2 should be able to distinguish on the receive side VCCV control messages from user packets on that VLL. There are three possible methods of encapsulating a VCCV message in a VLL which translates into three types of control channels:
Use of a Router Alert Label immediately preceding the VC label. This method has the drawback that if ECMP is applied to the outer LSP label (for example, transport label), the VCCV message will not follow the same path as the user packets. This effectively means it will not troubleshoot the appropriate path. This method is supported by the 7210 SAS.
Use of the OAM control word as illustrated in the following figure.
Figure 9. OAM control word format 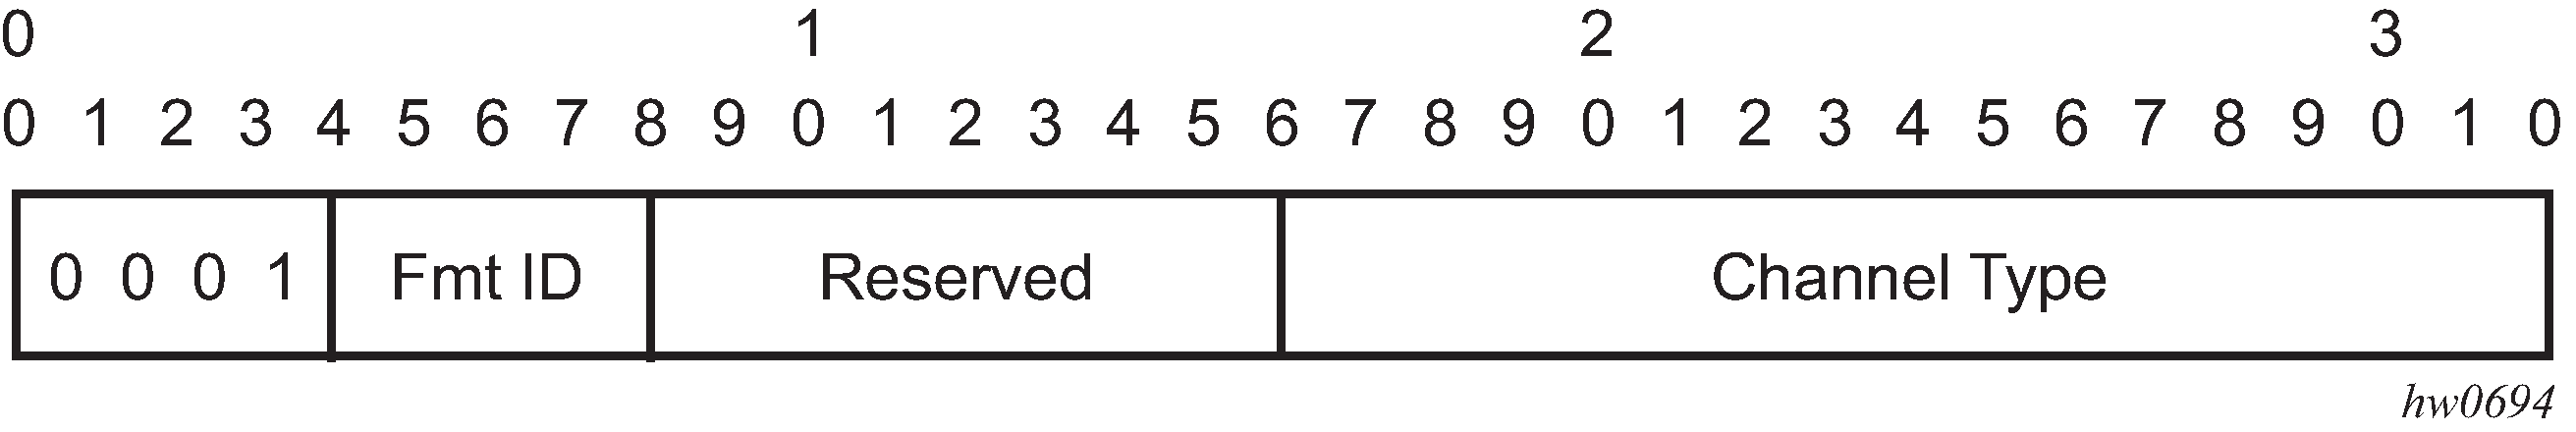
The first nibble is set to 0x1. The Format ID and the reserved fields are set to 0 and the channel type is the code point associated with the VCCV IP control channel as specified in the PWE3 IANA registry (RFC 4446). The channel type value of 0x21 indicates that the Associated Channel carries an IPv4 packet.
The use of the OAM control word assumes that the draft-martini control word is also used on the user packets. This means that if the control word is optional for a VLL and is not configured, the PE node will only advertise the router alert label as the CC capability in the Label Mapping message. This method is supported on 7210 SAS configured in the network mode of operation.
Set the TTL in the VC label to 1 to force PE2 control plane to process the VCCV message. This method is not guaranteed to work under all circumstances. For instance, the draft mentions some implementations of penultimate hop popping overwrite the TTL field. This method is not supported on the 7210 SAS.
When sending the label mapping message for the VLL, PE1 and PE2 must indicate which of the preceding OAM packet encapsulation methods (for example, which control channel type) they support. This is accomplished by including an optional VCCV TLV in the pseudowire FEC Interface Parameter field. The following figure shows the format of the VCCV TLV.
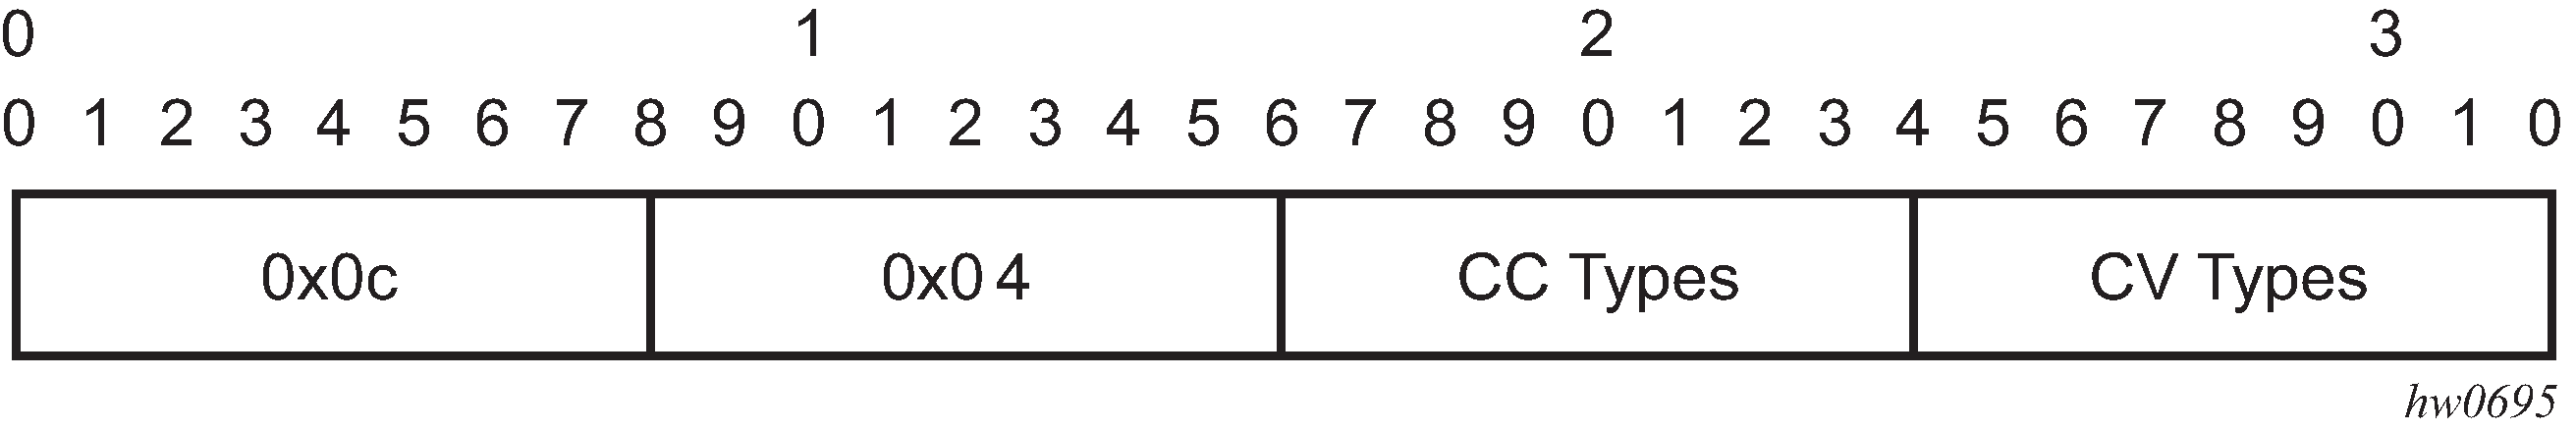
Note that the absence of the optional VCCV TLV in the Interface parameters field of the pseudowire FEC indicates the PE has no VCCV capability.
The Control Channel (CC) Type field is a bitmask used to indicate if the PE supports none, one, or many control channel types, as follows:
0x00 None of the following VCCV control channel types are supported
0x01 PWE3 OAM control word (see OAM control word format)
0x02 MPLS Router Alert Label
0x04 MPLS inner label TTL = 1
If both PE nodes support more than one of the CC types, a 7210 SAS PE will make use of the one with the lowest type value. For instance, OAM control word will be used in preference to the MPLS router alert label.
The Connectivity Verification (CV) bitmask field is used to indicate the specific type of VCCV packets to be sent over the VCCV control channel. The valid values are:
0x00 None of the following VCCV packet type are supported.
0x01 ICMP ping. Not applicable to a VLL over a MPLS SDP and therefore is not supported by the 7210 SAS.
0x02 LSP ping. This is used in VCCV-Ping application and applies to a VLL over an MPLS SDP. This is supported by the 7210 SAS.
A VCCV ping is an LSP echo request message as defined in RFC 4379. It contains an L2 FEC stack TLV which must include within the sub-TLV type 10 ‟FEC 128 Pseudowire”. It also contains a field which indicates to the destination PE which reply mode to use. There are four reply modes defined in RFC 4379:
Reply mode, meaning:
Do not reply. This mode is supported by the 7210 SAS.
Reply via an IPv4/IPv6 UDP packet. This mode is supported by the 7210 SAS.
Reply with an IPv4/IPv6 UDP packet with a router alert. This mode sets the router alert bit in the IP header and is not be confused with the CC type which makes use of the router alert label. This mode is not supported by the 7210 SAS.
Reply via application level control channel. This mode sends the reply message in-band over the pseudowire from PE2 to PE1. PE2 will encapsulate the Echo Reply message using the CC type negotiated with PE1. This mode is supported by the 7210 SAS.
The reply is an LSP echo reply message as defined in RFC 4379. The message is sent as per the reply mode requested by PE1. The return codes supported are the same as those supported in the 7210 SAS LSP ping capability.
The VCCV ping feature is in addition to the service ping OAM feature which can be used to test a service between 7210 SAS nodes. The VCCV ping feature can test connectivity of a VLL with any third party node which is compliant to RFC 5085.
The following figure shows the VCCV-ping feature application.
VCCV-ping in a multi-segment pseudowire
Pseudowire switching is a method for scaling a large network of VLL or VPLS services by removing the need for a full mesh of T-LDP sessions between the PE nodes as the number of these nodes grow over time. Pseudowire switching is also used whenever there is a need to deploy a VLL service across two separate routing domains.
In the network, a Termination PE (T-PE) is where the pseudowire originates and terminates.
VCCV ping is extended to be able to perform the following OAM functions:
VCCV ping to a destination PE. A VLL FEC ping is a message sent by T-PE1 to test the FEC at T-PE2. The operation at T-PE1 and T-PE2 is the same as in the case of a single-segment pseudowire. The pseudowire switching node, S-PE1, pops the outer label, swaps the inner (VC) label, decrements the TTL of the VC label, and pushes a new outer label. The 7210 SAS PE1 node does not process the VCCV OAM Control Word unless the VC label TTL expires. In that case, the message is sent to the CPM for further validation and processing. This is the method described in draft-hart-pwe3-segmented-pw-vccv.
Automated VCCV-trace capability for MS-pseudowire
Although tracing of the MS-pseudowire path is possible using the methods described in previous sections, these require multiple manual iterations and that the FEC of the last pseudowire segment to the target T-PE/S-PE be known a priori at the node originating the echo request message for each iteration. This mode of operation is referred to as a ‟ping” mode.
The automated VCCV-trace can trace the entire path of a pseudowire with a single command issued at the T-PE or at an S-PE. This is equivalent to LSP-trace and is an iterative process by which the ingress T-PE or T-PE sends successive VCCV-ping messages with incrementing the TTL value, starting from TTL=1.
The method is described in draft-hart-pwe3-segmented-pw-vccv, VCCV Extensions for Segmented Pseudo-Wire, and is pending acceptance by the PWE3 working group. In each iteration, the source T-PE or S-PE builds the MPLS echo request message in a way similar to VCCV ping. The first message with TTL=1 will have the next-hop S-PE T-LDP session source address in the Remote PE Address field in the pseudowire FEC TLV. Each S-PE which terminates and processes the message will include in the MPLS echo reply message the FEC 128 TLV corresponding the pseudowire segment to its downstream node.
The inclusion of the FEC TLV in the echo reply message is allowed in RFC 4379, Detecting Multi-Protocol Label Switched (MPLS) Data Plane Failures. The source T-PE or S-PE can then build the next echo reply message with TTL=2 to test the next-next hop for the MS-pseudowire. It will copy the FEC TLV it received in the echo reply message into the new echo request message. The process is terminated when the reply is from the egress T-PE or when a timeout occurs. If specified, the max-ttl parameter in the vccv-trace command will stop on SPE before reaching T-PE.
The results VCCV-trace can be displayed for a fewer number of pseudowire segments of the end-to-end MS-pseudowire path. In this case, the min-ttl and max-ttl parameters are configured accordingly. However, the T-PE/S-PE node will still probe all hops up to the min-ttl to correctly build the FEC of the desired subset of segments.
Note that this method does not require the use of the downstream mapping TLV in the echo request and echo reply messages.
VCCV for static pseudowire segments
MS pseudowire is supported with a mix of static and signaled pseudowire segments. However, VCCV ping and VCCV-trace is allowed until at least one segment of the MS pseudowire is static. Users cannot test a static segment but also, cannot test contiguous signaled segments of the MS-pseudowire. VCCV ping and VCCV trace is not supported in static-to-dynamic configurations.
Detailed VCCV-trace operation
A trace can be performed on the MS-pseudowire originating from T-PE1 by a single operational command. The following process occurs:
T-PE1 sends a VCCV echo request with TTL set to 1 and a FEC 128 containing the pseudowire information of the first segment (pseudowire1 between T-PE1 and S-PE) to S-PE for validation.
S-PE validates the echo request with the FEC 128. Since it is a switching point between the first and second segment it builds an echo reply with a return code of 8 and includes the FEC 128 of the second segment (pseudowire2 between S-PE and T-PE2) and sends the echo reply back to T-PE1.
T-PE1 builds a second VCCV echo request based on the FEC128 in the echo reply from the S-PE. It increments the TTL and sends the next echo request out to T-PE2. Note that the VCCV echo request packet is switched at the S-PE datapath and forwarded to the next downstream segment without any involvement from the control plane.
T-PE2 receives and validates the echo request with the FEC 128 of the pseudowire2 from T-PE1. Since T-PE2 is the destination node or the egress node of the MS-pseudowire it replies to T-PE1 with an echo reply with a return code of 3 (egress router) and no FEC 128 is included.
T-PE1 receives the echo reply from T-PE2. T-PE1 is made aware that T-PE2 is the destination of the MS pseudowire because the echo reply does not contain the FEC 128 and because its return code is 3. The trace process is completed.
Control plane processing of a VCCV echo message in a MS-pseudowire
Sending a VCCV echo request
When in the ping mode of operation, the sender of the echo request message requires the FEC of the last segment to the target S-PE/T-PE node. This information can either be configured manually or be obtained by inspecting the corresponding sub-TLVs of the pseudowire switching point TLV. However, the pseudowire switching point TLV is optional and there is no guarantee that all S-PE nodes will populate it with their system address and the pseudowire-id of the last pseudowire segment traversed by the label mapping message. Therefore, the 7210 SAS implementation will always make use of the user configuration for these parameters.
Receiving an VCCV echo request
Upon receiving a VCCV echo request the control plane on S-PEs (or the target node of each segment of the MS pseudowire) validates the request and responds to the request with an echo reply consisting of the FEC 128 of the next downstream segment and a return code of 8 (label switched at stack-depth) indicating that it is an S-PE and not the egress router for the MS-pseudowire.
If the node is the T-PE or the egress node of the MS-pseudowire, it responds to the echo request with an echo reply with a return code of 3 (egress router) and no FEC 128 is included.
Receiving an VCCV echo reply
The operation to be taken by the node that receives the echo reply in response to its echo request depends on its current mode of operation such as ping or trace.
In ping mode, the node may choose to ignore the target FEC 128 in the echo reply and report only the return code to the operator.
MPLS-TP on-demand OAM commands
This feature is supported only on 7210 SAS-T (network operating mode), 7210 SAS-R6, and 7210 SAS-R12.
Ping and trace tools for PWs and LSPs are supported with both IP encapsulation and the MPLS-TP on demand CV channel for non-IP encapsulation (0x025).
MPLS-TP pseudowires: VCCV-ping/VCCV-trace
For vccv-ping and vccv-trace commands:
Sub-type static must be specified. This indicates to the system that the rest of the command contains parameters that are applied to a static PW with a static PW FEC.
Add the ability to specify the non-IP ACH channel type (0x0025). This is known as the non-ip control-channel. This is the default for type static. GAL is not supported for PWs.
If the ip-control-channel is specified as the encapsulation, then the IPv4 channel type is used (0x0021). In this case, a destination IP address in the 127/8 range is used, while the source address in the UDP/IP packet is set to the system IP address, or may be explicitly configured by the user with the src-ip-address option. This option is only valid if the IPv4 control-channel is specified.
The reply mode are always assumed to be the same application level control channel type for type static.
Allow an MPLS-TP global ID and node ID specified under the spoke SDPs with a specific sdp-id:vc-id, used for MPLS-TP PW MEPs, or node ID (prefix) only for MIPs.
The following CLI command description shows the options that are only allowed if the type static option is configured. All other options are blocked.
As in the existing implementation, the downstream mapping and detailed downstream mapping TLVs (DSMAP/DDMAP TLVs) is not supported on PWs.
vccv-ping static <sdp-id:vc-id> [dest-global-id <global-id> dest-node-id <node-
id>] [control-channel ipv4 | non-ip] [fc <fc-
name> [profile {in | out}]] [size <octets>] [count <send-
count>] [timeout <timeout>] [interval <interval>] [ttl <vc-label-ttl>] [src-ip-
address <ip-address>]
vccv-trace static <sdp-id:vc-id> [size <octets>] [min-ttl <min-vc-label-ttl>] [max-
ttl <max-vc-label-ttl>] [max-fail <no-response-count>] [probe-count <probe-
count>] [control-channel ipv4 | non-ip] [timeout <timeout-
value>] [interval <interval-value>] [fc <fc-name> [profile {in | out}]] [src-ip-
address <ip-address>] [detail]
If the spoke SDP referred to by the sdp-id:vc-id has an MPLS-TP PW-Path-ID defined, then those parameters are used to populate the static PW TLV in the target FEC stack of the VCCV ping or VCCV trace packet. If a global ID and node ID are specified in the command, then these values are used to populate the destination node TLV in the VCCV ping or VCCV trace packet.
The global ID/node ID are only used as the target node identifiers if the vccv-ping is not end-to-end (for example, a TTL is specified in the VCCV ping/trace command and it is less than 255); otherwise, the value in the PW Path ID is used. For VCCV ping, the dest-node-id may be entered as a 4-octet IP address in the form a.b.c.d or as a 32-bit integer ranging from 1 to 4294967295. For VCCV trace, the destination node ID and global ID are taken from the spoke-sdp context.
The same command syntax is applicable for SAA tests configured under configure saa test a type.
MPLS-TP LSPs: LSP ping/LSP trace
For lsp-ping and lsp-trace commands:
The sub-type static must be specified. This indicates to the system that the rest of the command contains parameters specific to a LSP identified by a static LSP FEC.
The 7210 SAS supports the use of the G-ACh with non-IP encapsulation or labeled encapsulation with IP de-multiplexing for both the echo request and echo reply for LSP-Ping and LSP-Trace on LSPs with a static LSP FEC (such as MPLS-TP LSPs).
It is possible to specify the target MPLS-TP MEP/MIP identifier information for LSP Ping. If the target global-id and node-id are not included in the lsp-ping command, then these parameters for the target MEP ID are taken from the context of the LSP. The tunnel-number tunnel-num and lsp-num lsp-num for the far-end MEP are always taken from the context of the path under test.
lsp-ping static <lsp-name>
[force]
[path-type [active | working | protect]]
[fc <fc-name> [profile {in | out}]]
[size <octets>]
[ttl <label-ttl>]
[send-count <send-count>]
[timeout <timeout>]
[interval <interval>]
[src-ip-address <ip-address>]
[dest-global-id <dest-global-id> dest-node-id <dest-node-id>]
[control-channel none | non-ip][detail]
lsp-trace static  <lsp-name>
[force]
[path-type [active | working | protect]
[fc <fc-name> [profile {in | out}]]
[max-fail <no-response-count>]
[probe-count <probes-per-hop>]
[size <octets>]
[min-ttl <min-label-ttl>]
[max-ttl <max-label-ttl>]
[timeout <timeout>]
[interval <interval>]
[src-ip-address <ip-address>]
 [control-channel none | non-ip]
[downstream-map-tlv <dsmap | ddmap>]
[detail]
The following commands are only valid if the sub-type static option is configured, implying that lsp-name refers to an MPLS-TP tunnel LSP:
path-type. Values: active, working, protect. Default: active.
dest-global-id global-id dest-node-id node-id: Default: the to global-id:node-id from the LSP ID.
control-channel: If this is set to none, then IP encapsulation over an LSP is used with a destination address in the 127/8 range. The source address is set to the system IP address, unless the user specifies a source address using the src-ip-address option. If this is set to non-ip, then non-IP encapsulation over a G-ACh with channel type 0x00025 is used. This is the default for sub-type static. Note that the encapsulation used for the echo reply is the same as the encapsulation used for the echo request.
downstream-map-tlv: LSP Trace commands with this option can only be executed if the control-channel is set to none. The DSMAP/DDMAP TLV is only included in the echo request message if the egress interface is either a numbered IP interface, or an unnumbered IP interface. The TLV will not be included if the egress interface is of type unnumbered-mpls-tp.
For lsp-ping, the dest-node-id may be entered as a 4-octet IP address in the form a.b.c.d or as a 32-bit integer ranging from 1 to 4294967295. For lsp-trace, the destination node ID and global ID are taken from the spoke-sdp context.
The send mode and reply mode are always taken to be an application level control channel for MPLS-TP.
The force parameter causes an LSP ping echo request to be sent on an LSP that has been brought oper-down by BFD (LSP-Ping echo requests would be dropped on oper-down LSPs). This parameter is not applicable to SAA.
The LSP ID used in the LSP Ping packet is derived from a context lookup based on lsp-name and path-type (active/working/protect).
dest-global-id and dest-node-id refer to the target global and node ID. They do not need to be entered for end-to-end ping and trace, and the system will use the destination global ID and node ID from the LSP ID.
The same command syntax is applicable for SAA tests configured under configure>saa>test.
MPLS-TP show commands
Static MPLS labels
The following new commands show the details of the static MPLS labels.
show>router>mpls-labels>label start-label [end-label [in-use | label-owner]]
show>router>mpls-labels>label-range
An example output is as follows:
*A:mlstp-dutA# show router mpls
mpls         mpls-labels
*A:mlstp-dutA# show router mpls label
label        label-range
*A:mlstp-dutA# show router mpls label-range

===============================================================================
Label Ranges
===============================================================================
Label Type      Start Label     End Label       Aging          Total Available
-------------------------------------------------------------------------------
Static-lsp      32              16415           -              16364
Static-svc      16416           32799           -              16376
Dynamic         32800           131071          0              98268
===============================================================================
MPLS-TP tunnel configuration
The following is a sample configuration output of a specific tunnel.
show>router>mpls>tp-lsp
*A:mlstp-dutA# show router mpls tp-lsp
  - tp-lsp [lsp-name] [status {up | down}] [from ip-address | to ip-address]
    [detail]
  - tp-lsp [lsp-name] path [protect | working] [detail]
  - tp-lsp [lsp-name] protection

 <lsp-name>           : [32 chars max] - accepts * as wildcard char
 <path>               : keyword - Display LSP path information.
 <protection>         : keyword - Display LSP protection information.
 <up|down>            : keywords - Specify state of the LSP
 <ip-address>         : a.b.c.d
 <detail>             : keyword - Display detailed information.
*A:mlstp-dutA# show router mpls tp-lsp
path
protection
to <a.b.c.d>
<lsp-name>
 "lsp-32"  "lsp-33"  "lsp-34"  "lsp-35"  "lsp-36"  "lsp-37"  "lsp-38"  "lsp-39"
 "lsp-40"  "lsp-41"
status {up|down}
from <ip-address>
detail

*A:mlstp-dutA# show router mpls tp-lsp "lsp-
"lsp-32"  "lsp-33"  "lsp-34"  "lsp-35"  "lsp-36"  "lsp-37"  "lsp-38"  "lsp-39"
"lsp-40"  "lsp-41"
*A:mlstp-dutA# show router mpls tp-lsp "lsp-32"

===============================================================================
MPLS MPLS-TP LSPs (Originating)
===============================================================================
LSP Name                           To               Tun     Protect   Adm  Opr
                                                    Id      Path
-------------------------------------------------------------------------------
lsp-32                             10.0.3.234       32      No        Up   Up
-------------------------------------------------------------------------------
LSPs : 1
===============================================================================
*A:mlstp-dutA# show router mpls tp-lsp "lsp-32" detail

===============================================================================
MPLS MPLS-TP LSPs (Originating) (Detail)
===============================================================================
-------------------------------------------------------------------------------
Type : Originating
-------------------------------------------------------------------------------
LSP Name    : lsp-32
LSP Type    : MplsTp                           LSP Tunnel ID  : 32
From Node Id: 0.0.3.233+                       To Node Id     : 0.0.3.234
Adm State   : Up                               Oper State     : Up
LSP Up Time : 0d 04:50:47                      LSP Down Time  : 0d 00:00:00
Transitions : 1                                Path Changes   : 2

DestGlobalId: 42                               DestTunnelNum  : 32
MPLS-TP path configuration
This can reuse and augment the output of the current show commands for static LSPs. They should also show if BFD is enabled on a specific path. If this referring to a transit path, this should also display (among others) the path-id (7 parameters) for a specific transit-path-name, or the transit-path-name for a specific the path-id (7 parameters)
show>router>mpls>tp-lsp>path
A sample output is as follows:
===============================================================================
*A:mlstp-dutA#  show router mpls tp-lsp path

===============================================================================
MPLS-TP LSP Path Information
===============================================================================
LSP Name      : lsp-32                           To            : 0.0.3.234
Admin State   : Up                               Oper State    : Up

-------------------------------------------------------------------------------
Path        NextHop           InLabel   OutLabel  Out I/F         Admin  Oper
-------------------------------------------------------------------------------
Working                       32        32        AtoB_1          Up     Down
Protect                       2080      2080      AtoC_1          Up     Up
===============================================================================
LSP Name      : lsp-33                           To            : 0.0.3.234
Admin State   : Up                               Oper State    : Up

-------------------------------------------------------------------------------
Path        NextHop           InLabel   OutLabel  Out I/F         Admin  Oper
-------------------------------------------------------------------------------
Working                       33        33        AtoB_1          Up     Down
Protect                       2082      2082      AtoC_1          Up     Up
===============================================================================
LSP Name      : lsp-34                           To            : 0.0.3.234
Admin State   : Up                               Oper State    : Up

-------------------------------------------------------------------------------
Path        NextHop           InLabel   OutLabel  Out I/F         Admin  Oper
-------------------------------------------------------------------------------
Working                       34        34        AtoB_1          Up     Down
Protect                       2084      2084      AtoC_1          Up     Up
===============================================================================
LSP Name      : lsp-35                           To            : 0.0.3.234
Admin State   : Up                               Oper State    : Up

-------------------------------------------------------------------------------
Path        NextHop           InLabel   OutLabel  Out I/F         Admin  Oper
-------------------------------------------------------------------------------
Working                       35        35        AtoB_1          Up     Down
Protect                       2086      2086      AtoC_1          Up     Up
===============================================================================
LSP Name      : lsp-36                           To            : 0.0.3.234
Admin State   : Up                               Oper State    : Up

-------------------------------------------------------------------------------
Path        NextHop           InLabel   OutLabel  Out I/F         Admin  Oper
-------------------------------------------------------------------------------
Working                       36        36        AtoB_1          Up     Down
Protect                       2088      2088      AtoC_1          Up     Up
===============================================================================
LSP Name      : lsp-37                           To            : 0.0.3.234
Admin State   : Up                               Oper State    : Up

-------------------------------------------------------------------------------
Path        NextHop           InLabel   OutLabel  Out I/F         Admin  Oper
-------------------------------------------------------------------------------
Working                       37        37        AtoB_1          Up     Down
Protect                       2090      2090      AtoC_1          Up     Up
===============================================================================
LSP Name      : lsp-38                           To            : 0.0.3.234
Admin State   : Up                               Oper State    : Up

-------------------------------------------------------------------------------
Path        NextHop           InLabel   OutLabel  Out I/F         Admin  Oper
-------------------------------------------------------------------------------
Working                       38        38        AtoB_1          Up     Down
Protect                       2092      2092      AtoC_1          Up     Up
===============================================================================
LSP Name      : lsp-39                           To            : 0.0.3.234
Admin State   : Up                               Oper State    : Up

-------------------------------------------------------------------------------
Path        NextHop           InLabel   OutLabel  Out I/F         Admin  Oper
-------------------------------------------------------------------------------
Working                       39        39        AtoB_1          Up     Down
Protect                       2094      2094      AtoC_1          Up     Up
===============================================================================
LSP Name      : lsp-40                           To            : 0.0.3.234
Admin State   : Up                               Oper State    : Up

-------------------------------------------------------------------------------
Path        NextHop           InLabel   OutLabel  Out I/F         Admin  Oper
-------------------------------------------------------------------------------
Working                       40        40        AtoB_1          Up     Down
Protect                       2096      2096      AtoC_1          Up     Up
===============================================================================
LSP Name      : lsp-41                           To            : 0.0.3.234
Admin State   : Up                               Oper State    : Up

-------------------------------------------------------------------------------
Path        NextHop           InLabel   OutLabel  Out I/F         Admin  Oper
-------------------------------------------------------------------------------
Working                       41        41        AtoB_1          Up     Down
Protect                       2098      2098      AtoC_1          Up     Up

*A:mlstp-dutA#  show router mpls tp-lsp "lsp-32" path working

===============================================================================
MPLS-TP LSP Working Path Information
    LSP: "lsp-32"
===============================================================================
LSP Name      : lsp-32                           To            : 0.0.3.234
Admin State   : Up                               Oper State    : Up

-------------------------------------------------------------------------------
Path        NextHop           InLabel   OutLabel  Out I/F         Admin  Oper
-------------------------------------------------------------------------------
Working                       32        32        AtoB_1          Up     Down
===============================================================================
*A:mlstp-dutA#  show router mpls tp-lsp "lsp-32" path protect

===============================================================================
MPLS-TP LSP Protect Path Information
    LSP: "lsp-32"
===============================================================================
LSP Name      : lsp-32                           To            : 0.0.3.234
Admin State   : Up                               Oper State    : Up

-------------------------------------------------------------------------------
Path        NextHop           InLabel   OutLabel  Out I/F         Admin  Oper
-------------------------------------------------------------------------------
Protect                       2080      2080      AtoC_1          Up     Up
===============================================================================
*A:mlstp-dutA#  show router mpls tp-lsp "lsp-32" path protect detail

===============================================================================
MPLS-TP LSP Protect Path Information
    LSP: "lsp-32" (Detail)
===============================================================================
LSP Name      : lsp-32                           To            : 0.0.3.234
Admin State   : Up                               Oper State    : Up

Protect path information
-------------------------------------------------------------------------------
Path Type     : Protect                          LSP Num       : 2
Path Admin    : Up                               Path Oper     : Up
Out Interface : AtoC_1                           Next Hop Addr : n/a
In Label      : 2080                             Out Label     : 2080
Path Up Time  : 0d 04:52:17                      Path Dn Time  : 0d 00:00:00
Active Path   : Yes                              Active Time   : 0d 00:52:56

MEP information
MEP State     : Up                               BFD           : cc
OAM Templ     : privatebed-oam-template          CC Status     : inService
                                                 CV Status     : unknown
Protect Templ : privatebed-protection-template   WTR Count Down: 0 seconds
RX PDU        : SF (1,1)                         TX PDU        : SF (1,1)
Defects       :
===============================================================================
*A:mlstp-dutA#  show router mpls tp-lsp "lsp-32" path working detail

===============================================================================
MPLS-TP LSP Working Path Information
    LSP: "lsp-32" (Detail)
===============================================================================
LSP Name      : lsp-32                           To            : 0.0.3.234
Admin State   : Up                               Oper State    : Up

Working path information
-------------------------------------------------------------------------------
Path Type     : Working                          LSP Num       : 1
Path Admin    : Up                               Path Oper     : Down
Down Reason   : ccFault ifDn
Out Interface : AtoB_1                           Next Hop Addr : n/a
In Label      : 32                               Out Label     : 32
Path Up Time  : 0d 00:00:00                      Path Dn Time  : 0d 00:53:01
Active Path   : No                               Active Time   : n/a

MEP information
MEP State     : Up                               BFD           : cc
OAM Templ     : privatebed-oam-template          CC Status     : outOfService
                                                 CV Status     : unknown
===============================================================================
*A:mlstp-dutA#
MPLS-TP protection
These should show the protection configuration for a specific tunnel, which path in a tunnel is currently working and which is protect, and whether the working or protect is currently active.
show>router>mpls>tp-lsp>protection
A sample output is as follows:
*A:mlstp-dutA#  show router mpls tp-lsp protection

===============================================================================
MPLS-TP LSP Protection Information
Legend: W-Working, P-Protect,
===============================================================================
LSP Name                      Admin Oper  Path    Ingr/Egr      Act. Rx PDU
                              State State   State Label         Path Tx PDU
-------------------------------------------------------------------------------
lsp-32                        Up    Up    W Down      32/32     No   SF (1,1)
                                          P Up      2080/2080   Yes  SF (1,1)
lsp-33                        Up    Up    W Down      33/33     No   SF (1,1)
                                          P Up      2082/2082   Yes  SF (1,1)
lsp-34                        Up    Up    W Down      34/34     No   SF (1,1)
                                          P Up      2084/2084   Yes  SF (1,1)
lsp-35                        Up    Up    W Down      35/35     No   SF (1,1)
                                          P Up      2086/2086   Yes  SF (1,1)
lsp-36                        Up    Up    W Down      36/36     No   SF (1,1)
                                          P Up      2088/2088   Yes  SF (1,1)
lsp-37                        Up    Up    W Down      37/37     No   SF (1,1)
                                          P Up      2090/2090   Yes  SF (1,1)
lsp-38                        Up    Up    W Down      38/38     No   SF (1,1)
                                          P Up      2092/2092   Yes  SF (1,1)
lsp-39                        Up    Up    W Down      39/39     No   SF (1,1)
                                          P Up      2094/2094   Yes  SF (1,1)
lsp-40                        Up    Up    W Down      40/40     No   SF (1,1)
                                          P Up      2096/2096   Yes  SF (1,1)
lsp-41                        Up    Up    W Down      41/41     No   SF (1,1)
                                          P Up      2098/2098   Yes  SF (1,1)
-------------------------------------------------------------------------------
No. of MPLS-TP LSPs: 10
===============================================================================
BFD
The existing show>router>bfd context is enhanced for MPLS-TP, as follows:
show>router>bfd>mpls-tp-lsp
Displays the MPLS–TP paths for which BFD is enabled.
show>router>bfd>session [src ip-address [dest ip-address | detail]] | [mpls-tp-path lsp-id… [detail]]
Should be enhanced to show the details of the BFD session on a particular MPLS-TP path, where lsp-id is the fully qualified lSP ID to which the BFD session is in associated.
A sample output is as follows:
*A:mlstp-dutA# show router bfd
  - bfd

      bfd-template    - Display BFD Template information
      interface       - Display Interfaces with BFD
      session         - Display session information

*A:mlstp-dutA# show router bfd bfd-template "privatebed-bfd-template"

===============================================================================
BFD Template privatebed-bfd-template
===============================================================================
Template Name           : privatebed-* Template Type             : cpmNp
Transmit Timer          : 10 msec      Receive Timer             : 10 msec
CV Transmit Interval    : 1000 msec
Template Multiplier     : 3            Echo Receive Interval     : 100 msec

Mpls-tp Association
privatebed-oam-template
===============================================================================
* indicates that the corresponding row element may have been truncated.
*A:mlstp-dutA# show router bfd session

===============================================================================
BFD Session
===============================================================================
Interface/Lsp Name            State                 Tx Intvl  Rx Intvl  Multipl
  Remote Address/Info         Protocols             Tx Pkts   Rx Pkts   Type
-------------------------------------------------------------------------------
wp::lsp-32                    Down (1)              1000      1000      3
    0::0.0.0.0                mplsTp                N/A       N/A       cpm-np
wp::lsp-33                    Down (1)              1000      1000      3
    0::0.0.0.0                mplsTp                N/A       N/A       cpm-np
wp::lsp-34                    Down (1)              1000      1000      3
    0::0.0.0.0                mplsTp                N/A       N/A       cpm-np
wp::lsp-35                    Down (1)              1000      1000      3
    0::0.0.0.0                mplsTp                N/A       N/A       cpm-np
wp::lsp-36                    Down (1)              1000      1000      3
    0::0.0.0.0                mplsTp                N/A       N/A       cpm-np
wp::lsp-37                    Down (1)              1000      1000      3
    0::0.0.0.0                mplsTp                N/A       N/A       cpm-np
wp::lsp-38                    Down (1)              1000      1000      3
    0::0.0.0.0                mplsTp                N/A       N/A       cpm-np
wp::lsp-39                    Down (1)              1000      1000      3
    0::0.0.0.0                mplsTp                N/A       N/A       cpm-np
wp::lsp-40                    Down (1)              1000      1000      3
    0::0.0.0.0                mplsTp                N/A       N/A       cpm-np
wp::lsp-41                    Down (1)              1000      1000      3
    0::0.0.0.0                mplsTp                N/A       N/A       cpm-np
pp::lsp-32                    Up (3)                1000      1000      3
    0::0.0.0.0                mplsTp                N/A       N/A       cpm-np
pp::lsp-33                    Up (3)                1000      1000      3
    0::0.0.0.0                mplsTp                N/A       N/A       cpm-np
pp::lsp-34                    Up (3)                1000      1000      3
    0::0.0.0.0                mplsTp                N/A       N/A       cpm-np
pp::lsp-35                    Up (3)                1000      1000      3
    0::0.0.0.0                mplsTp                N/A       N/A       cpm-np
pp::lsp-36                    Up (3)                1000      1000      3
    0::0.0.0.0                mplsTp                N/A       N/A       cpm-np
pp::lsp-37                    Up (3)                1000      1000      3
    0::0.0.0.0                mplsTp                N/A       N/A       cpm-np
pp::lsp-38                    Up (3)                1000      1000      3
    0::0.0.0.0                mplsTp                N/A       N/A       cpm-np
pp::lsp-39                    Up (3)                1000      1000      3
    0::0.0.0.0                mplsTp                N/A       N/A       cpm-np
pp::lsp-40                    Up (3)                1000      1000      3
    0::0.0.0.0                mplsTp                N/A       N/A       cpm-np
pp::lsp-41                    Up (3)                1000      1000      3
    0::0.0.0.0                mplsTp                N/A       N/A       cpm-np
-------------------------------------------------------------------------------
No. of BFD sessions: 20
-------------------------------------------------------------------------------
wp = Working path   pp = Protecting path
===============================================================================
MPLS TP node configuration
Displays the Global ID, Node ID and other general MPLS-TP configurations for the node.
show>router>mpls>mpls-tp
A sample output is as follows:
*A:mlstp-dutA# show router mpls mpls-tp
  - mpls-tp


      oam-template    - Display MPLS-TP OAM Template information
      protection-tem* - Display MPLS-TP Protection Template information
      status          - Display MPLS-TP system configuration
      transit-path    - Display MPLS-TP Tunnel information

*A:mlstp-dutA# show router mpls mpls-tp oam-template

===============================================================================
MPLS-TP OAM Templates
===============================================================================
Template Name : privatebed-oam-template Router ID     : 1
BFD Template  : privatebed-bfd-template Hold-Down Time: 0 centiseconds
                                        Hold-Up Time  : 20 deciseconds
===============================================================================
*A:mlstp-dutA# show router mpls mpls-tp protection-template

===============================================================================
MPLS-TP Protection Templates
===============================================================================
Template Name  : privatebed-protection-template  Router ID      : 1
Protection Mode: one2one                         Direction      : bidirectional
Revertive      : revertive                       Wait-to-Restore: 300sec
Rapid-PSC-Timer: 10ms                            Slow-PSC-Timer : 5sec
===============================================================================
*A:mlstp-dutA# show router mpls mpls-tp status

===============================================================================
MPLS-TP Status
===============================================================================
Admin Status  : Up
Global ID     : 42                               Node ID       : 0.0.3.233
Tunnel Id Min : 1                                Tunnel Id Max : 4096
===============================================================================
*A:mlstp-dutA# show router mpls mpls-tp transit-path
  - transit-path [<path-name>] [detail]

 <path-name>          : [32 chars max]
 <detail>             : keyword - Display detailed information.


A:mplstp-dutC# show router mpls mpls-tp transit-path
  - transit-path [<path-name>] [detail]

 <path-name>          : [32 chars max]
 <detail>             : keyword - Display detailed information.


A:mplstp-dutC# show router mpls mpls-tp transit-path
<path-name>
 "tp-32"   "tp-33"   "tp-34"   "tp-35"   "tp-36"   "tp-37"   "tp-38"   "tp-39"
 "tp-40"   "tp-41"
detail

A:mplstp-dutC# show router mpls mpls-tp transit-path "tp-32"

===============================================================================
MPLS-TP Transit tp-32 Path Information
===============================================================================
Path Name     : tp-32
Admin State   : Up                               Oper State    : Up

------------------------------------------------------------------
Path        NextHop           InLabel   OutLabel  Out I/F
------------------------------------------------------------------
FP                            2080      2081      CtoB_1
RP                            2081      2080      CtoA_1
===============================================================================
A:mplstp-dutC# show router mpls mpls-tp transit-path "tp-32" detail

===============================================================================
MPLS-TP Transit tp-32 Path Information (Detail)
===============================================================================
Path Name     : tp-32
Admin State   : Up                               Oper State    : Up
-------------------------------------------------------------------------------
Path ID configuration
Src Global ID : 42                               Dst Global ID : 42
Src Node ID   : 0.0.3.234                        Dst Node ID   : 0.0.3.233
LSP Number    : 2                                Dst Tunnel Num: 32

Forward Path configuration
In Label      : 2080                             Out Label     : 2081
Out Interface : CtoB_1                           Next Hop Addr : n/a

Reverse Path configuration
In Label      : 2081                             Out Label     : 2080
Out Interface : CtoA_1                           Next Hop Addr : n/a
===============================================================================
A:mplstp-dutC#
MPLS-TP interfaces
The existing show>router>interface command should be enhanced to display MPLS-TP- specific information.
The following is a sample output:
*A:mlstp-dutA# show router interface "AtoB_1"

===============================================================================
Interface Table (Router: Base)
===============================================================================
Interface-Name                   Adm         Opr(v4/v6)  Mode    Port/SapId
   IP-Address                                                    PfxState
-------------------------------------------------------------------------------
AtoB_1                           Down        Down/--     Network 1/2/3:1
   Unnumbered If[system]                                         n/a
-------------------------------------------------------------------------------
Interfaces : 1
Services using MPLS-TP PWs
The show>service command should be updated to display MPLS-TP-specific information such as the PW path ID and control channel status signaling parameters.
The following is a sample output:
*A:mlstp-dutA# show service id 1 all

===============================================================================
Service Detailed Information
===============================================================================
Service Id        : 1                   Vpn Id            : 0
Service Type      : Epipe
Name              : (Not Specified)
Description       : (Not Specified)
Customer Id       : 1                   Creation Origin   : manual
Last Status Change: 12/03/2012 15:26:20
Last Mgmt Change  : 12/03/2012 15:24:57
Admin State       : Up                  Oper State        : Up
MTU               : 1514
Vc Switching      : False
SAP Count         : 1                   SDP Bind Count    : 1
Per Svc Hashing   : Disabled
Force QTag Fwd    : Disabled

-------------------------------------------------------------------------------
ETH-CFM service specifics
-------------------------------------------------------------------------------
Tunnel Faults     : ignore


-------------------------------------------------------------------------------
Service Destination Points(SDPs)
-------------------------------------------------------------------------------
-------------------------------------------------------------------------------
 Sdp Id 32:1  -(0.0.3.234:42)
-------------------------------------------------------------------------------
Description     : (Not Specified)
SDP Id             : 32:1                     Type              : Spoke
Spoke Descr     : (Not Specified)
VC Type            : Ether                    VC Tag            : n/a
Admin Path MTU     : 0                        Oper Path MTU     : 9186
Delivery           : MPLS
Far End            : 0.0.3.234:42
Tunnel Far End     : n/a                      LSP Types         : MPLSTP
Hash Label         : Disabled                 Hash Lbl Sig Cap  : Disabled
Oper Hash Label    : Disabled

Admin State        : Up                       Oper State        : Up
Acct. Pol          : None                     Collect Stats     : Disabled
Ingress Label      : 16416                    Egress Label      : 16416
Ingr Mac Fltr-Id   : n/a                      Egr Mac Fltr-Id   : n/a
Ingr IP Fltr-Id    : n/a                      Egr IP Fltr-Id    : n/a
Ingr IPv6 Fltr-Id  : n/a                      Egr IPv6 Fltr-Id  : n/a
Admin ControlWord  : Preferred                Oper ControlWord  : True
Admin BW(Kbps)     : 0                        Oper BW(Kbps)     : 0
Last Status Change : 12/03/2012 15:26:20      Signaling         : None
Last Mgmt Change   : 12/03/2012 15:24:57      Force Vlan-Vc     : Disabled
Endpoint           : N/A                      Precedence        : 4
PW Status Sig      : Enabled
Class Fwding State : Down
Flags              : None
Local Pw Bits      : None
Peer Pw Bits       : None
Peer Fault Ip      : None
Peer Vccv CV Bits  : None
Peer Vccv CC Bits  : None
Application Profile: None
Standby Sig Slave  : False
Block On Peer Fault: False

Ingress Qos Policy : (none)                   Egress Qos Policy : (none)
Ingress FP QGrp    : (none)                   Egress Port QGrp  : (none)
Ing FP QGrp Inst   : (none)                   Egr Port QGrp Inst: (none)

Statistics            :
I. Fwd. Pkts.      : 272969957                I. Dro. Pkts.     : 0
E. Fwd. Pkts.      : 273017433                E. Fwd. Octets    : 16381033352

-------------------------------------------------------------------------------
Control Channel Status
-------------------------------------------------------------------------------
PW Status          : enabled                  Refresh Timer     : 66 secs
Peer Status Expire : false                    Clear On Timeout  : true

-------------------------------------------------------------------------------
SDP-BIND PW Path Information
-------------------------------------------------------------------------------
AGI                : 1:1
SAII Type2         : 42:0.0.3.234:1
TAII Type2         : 42:0.0.3.233:1

-------------------------------------------------------------------------------
RSVP/Static LSPs
-------------------------------------------------------------------------------
Associated LSP List :
Lsp Name           : lsp-32
Admin State        : Up                       Oper State        : Up

*A:mlstp-dutA# show service id [1..4] all | match "Control Channel" pre-
lines 1 post-lines 5
-------------------------------------------------------------------------------
Control Channel Status
-------------------------------------------------------------------------------
PW Status          : enabled                  Refresh Timer     : 66 secs
Peer Status Expire : false                    Clear On Timeout  : true

-------------------------------------------------------------------------------
-------------------------------------------------------------------------------
Control Channel Status
-------------------------------------------------------------------------------
PW Status          : enabled                  Refresh Timer     : 66 secs
Peer Status Expire : false                    Clear On Timeout  : true

-------------------------------------------------------------------------------
*A:mlstp-dutA#  show service id [1..4] all | match SDP-BIND pre-lines 1 post-lines 5
-------------------------------------------------------------------------------
SDP-BIND PW Path Information
-------------------------------------------------------------------------------
AGI                : 1:1
SAII Type2         : 42:0.0.3.234:1
TAII Type2         : 42:0.0.3.233:1

-------------------------------------------------------------------------------
SDP-BIND PW Path Information
-------------------------------------------------------------------------------
AGI                : 1:2
SAII Type2         : 42:0.0.3.234:2
TAII Type2         : 42:0.0.3.233:2

-------------------------------------------------------------------------------
SDP-BIND PW Path Information
-------------------------------------------------------------------------------
AGI                : 1:3
SAII Type2         : 42:0.0.3.234:3
TAII Type2         : 42:0.0.3.233:3

-------------------------------------------------------------------------------
SDP-BIND PW Path Information
-------------------------------------------------------------------------------
AGI                : 1:4
SAII Type2         : 42:0.0.3.234:4
TAII Type2         : 42:0.0.3.233:4
MPLS-TP debug commands
The following command provides the debug command for an MPLS-TP tunnel:
tools>dump>router>mpls>tp-tunnel lsp-name[clear]
The following is a sample output:
A:mlstp-dutA# tools dump router mpls tp-tunnel
- tp-tunnel <lsp-name> [clear]
- tp-tunnel id <tunnel-id> [clear]
<lsp-name> : [32 chars max]
<tunnel-id> : [1..61440]
<clear> : keyword - clear stats after reading
*A:mlstp-dutA# tools dump router mpls tp-tunnel "lsp-
"lsp-32" "lsp-33" "lsp-34" "lsp-35" "lsp-36" "lsp-37" "lsp-38" "lsp-39"
"lsp-40" "lsp-41"
*A:mlstp-dutA# tools dump router mpls tp-tunnel "lsp-32"
Idx: 1-32 (Up/Up): pgId 4, paths 2, operChg 1, Active: Protect
TunnelId: 42::0.0.3.233::32-42::0.0.3.234::32
PgState: Dn, Cnt/Tm: Dn 1/000 04:00:48.160 Up:3/000 00:01:25.840
MplsMsg: tpDn 0/000 00:00:00.000, tunDn 0/000 00:00:00.000
wpDn 0/000 00:00:00.000, ppDn 0/000 00:00:00.000
wpDel 0/000 00:00:00.000, ppDel 0/000 00:00:00.000
tunUp 1/000 00:00:02.070
Paths:
Work (Up/Dn): Lsp 1, Lbl 32/32, If 2/128 (1/2/3 : 0.0.0.0)
Tmpl: ptc: , oam: privatebed-oam-template (bfd: privatebed-bfd-template(np)-10 ms)
Bfd: Mode CC state Dn/Up handle 160005/0
Bfd-CC (Cnt/Tm): Dn 1/000 04:00:48.160 Up:1/000 00:01:23.970
State: Admin Up (1::1::1) port Up , if Dn , operChg 2
DnReasons: ccFault ifDn
Protect (Up/Up): Lsp 2, Lbl 2080/2080, If 3/127 (5/1/1 : 0.0.0.0)
Tmpl: ptc: privatebed-protection-template, oam: privatebed-oam-
template (bfd: privatebed-
bfd-template(np)-10 ms)
Bfd: Mode CC state Up/Up handle 160006/0
Bfd-CC (Cnt/Tm): Dn 0/000 00:00:00.000 Up:1/000 00:01:25.410
State: Admin Up (1::1::1) port Up , if Up , operChg 1
Aps: Rx - 5, raw 3616, nok 0(), txRaw - 3636, revert Y
Pdu: Rx - 0x1a-21::0101 (SF), Tx - 0x1a-21::0101 (SF)
State: PF:W:L LastEvt pdu (L-SFw/R-SFw)
Tmrs: slow
Defects: None Now: 000 05:02:19.130
Seq Event state TxPdu RxPdu Dir Act Time
=== ====== ======== ========== ========== ===== ==== ================
000 start UA:P:L SF (0,0) NR (0,0) Tx--> Work 000 00:00:02.080
001 pdu UA:P:L SF (0,0) SF (0,0) Rx<-- Work 000 00:01:24.860
002 pdu UA:P:L SF (0,0) NR (0,0) Rx<-- Work 000 00:01:26.860
003 pUp NR NR (0,0) NR (0,0) Tx--> Work 000 00:01:27.440
004 pdu NR NR (0,0) NR (0,0) Rx<-- Work 000 00:01:28.760
005 wDn PF:W:L SF (1,1) NR (0,0) Tx--> Prot 000 04:00:48.160
006 pdu PF:W:L SF (1,1) NR (0,1) Rx<-- Prot 000 04:00:48.160
007 pdu PF:W:L SF (1,1) SF (1,1) Rx<-- Prot 000 04:00:51.080
The following command shows the free MPLS tunnel IDs.
A:SASR1# /tools dump router mpls  mpls-tp check-lbl-range
  - mpls-tp check-lbl-range <range1> <range2>

<check-lbl-range>    : keyword
<range1>             : [32..65520]
<range2>             : [32..65520]
The following command provides a debug tool to view control-channel-status signaling packets.
*A:7210SAS# /debug service id 700 sdp 200:700 event-type ?{config-change|oper-
status-change|neighbor-discovery|control-channel-status}

*A:7210SAS# /debug service id 700 sdp 200:700 event-type control-channel-status

*A:7210SAS#
1 2012/08/31 09:56:12.09 EST MINOR: DEBUG #2001 Base PW STATUS SIG PKT (RX):
PW STATUS SIG PKT (RX)::
Sdp Bind 200:700 Instance 3
    Version          : 0x0
    PW OAM Msg Type  : 0x27
    Refresh Time     : 0xa
    Total TLV Length : 0x8
    Flags            : 0x0
    TLV Type         : 0x96a
    TLV Len          : 0x4
    PW Status Bits   : 0x0


2 2012/08/31 09:56:22.09 EST MINOR: DEBUG #2001 Base PW STATUS SIG PKT (RX):
PW STATUS SIG PKT (RX)::
Sdp Bind 200:700 Instance 3
    Version          : 0x0
    PW OAM Msg Type  : 0x27
    Refresh Time     : 0xa
    Total TLV Length : 0x8
    Flags            : 0x0
    TLV Type         : 0x96a
    TLV Len          : 0x4
    PW Status Bits   : 0x0


3 2012/08/31 09:56:29.44 EST MINOR: DEBUG #2001 Base PW STATUS SIG PKT (TX):
PW STATUS SIG PKT (TX)::
Sdp Bind 200:700 Instance 3
    Version          : 0x0
    PW OAM Msg Type  : 0x27
    Refresh Time     : 0x1e
    Total TLV Length : 0x8
    Flags            : 0x0
    TLV Type         : 0x96a
    TLV Len          : 0x4
    PW Status Bits   : 0x0
IP Performance Monitoring (IP PM)
The 7210 SAS supports Two-Way Active Measurement Protocol (TWAMP) and Two-Way Active Measurement Protocol Light (TWAMP Light).
On the 7210 SAS-R6, 7210 SAS-R12, 7210 SAS-Mxp, and 7210 SAS-T, the MVR RVPLS service configured with IGMPv3 snooping shares resources with TWAMP and TWAMP Light. An increase in one decreases the amount of resources available for the other. Contact your Nokia representative for more information about scaling of these features. For more information about IGMPv3 snooping, see the 7210 SAS-Mxp, S, Sx, T Services Guide.
Two-Way Active Measurement Protocol (TWAMP)
Two-Way Active Measurement Protocol (TWAMP) provides a standards-based method for measuring the round-trip IP performance (packet loss, delay and jitter) between two devices. TWAMP uses the methodology and architecture of One-Way Active Measurement Protocol (OWAMP) to define a way to measure two-way or round-trip metrics.
There are four logical entities in TWAMP:
the control-client
the session-sender
the server
the session-reflector
The control-client and session-sender are typically implemented in one physical device (the ‟client”) and the server and session-reflector in a second physical device (the ‟server”) with which the two-way measurements are being performed. The 7210 SAS acts as the server. The control-client and server establishes a TCP connection and exchange TWAMP-Control messages over this connection. When the control-client requires to start testing, the client communicates the test parameters to the server. If the server corresponds to conduct the described tests, the test begins as soon as the client sends a Start-Sessions message. As part of a test, the session sender sends a stream of UDP-based test packets to the session-reflector, and the session reflector responds to each received packet with a response UDP-based test packet. When the session-sender receives the response packets from the session-reflector, the information is used to calculate two-way delay, packet loss, and packet delay variation between the two devices.
Configuration notes
The following are the configuration notes:
Unauthenticated mode is supported. Encrypted and Authenticated modes are not supported.
TWAMP is supported only in the base router instance.
By default, the 7210 SAS uses TCP port number 862 to listen for TWAMP control connections. This is not user configurable.
Two-Way Active Measurement Protocol Light (TWAMP Light)
TWAMP Light is an optional model included in the TWAMP standard RFC5357 that uses standard TWAMP test packets but provides a lightweight approach to gathering ongoing IP delay performance data for base router and per-VPRN statistics. Full details are described in Appendix I of RFC 5357 (Active Two Way Measurement Protocol). The 7210 SAS implementation supports the TWAMP Light model for gathering delay and loss statistics.
For TWAMP Light, the TWAMP Client/Server model is replaced with the Session Controller/Responder model. In general terms, the Session Controller is the launch point for the test packets and the Responder performs the reflection function.
TWAMP Light maintains the TWAMP test packet exchange but eliminates the TWAMP TCP control connection with local configurations; however, not all negotiated control parameters are replaced with local configuration. For example, CoS parameters communicated over the TWAMP control channel are replaced with a reply-in-kind approach. The reply-in-kind model reflects back the received CoS parameters, which are influenced by the reflector’s QoS policies.
The responder function is configured under the config>router>twamp-light command hierarchy for base router reflection, and under the config>service>vprn>twamp-light command hierarchy for per VPRN reflection. The TWAMP Light reflector function is configured per context and must be activated before reflection can occur; the function is not enabled by default for any context. The reflector requires the operator to define the TWAMP Light UDP listening port that identifies the TWAMP Light protocol and the prefixes that the reflector will accept as valid sources for a TWAMP Light request. If the configured TWAMP Light listening UDP port is in use by another application on the system, a Minor OAM message will be presented indicating that the port is unavailable and that the activation of the reflector is not allowed.
f the source IP address in the TWAMP Light packet arriving on the responder does not match a configured IP address prefix, the packet is dropped. Multiple prefix entries may be configured per context on the responder. An inactivity timeout under the config>oam-test>twamp>twamp-light hierarchy defines the amount of time the reflector will keep the individual reflector sessions active in the absence of test packets. A responder requires CPM3 or better hardware.
TWAMP Light test packet launching is controlled by the OAM Performance Monitoring (OAM-PM) architecture and adheres to those rules; this includes the assignment of a test Id. TWAMP Light does not carry the 4-byte test ID in the packet to remain locally significant and uniform with other protocols under the control of the OAM-PM architecture. The OAM-PM construct allow the various test parameters to be defined. These test parameters include the IP session-specific information which allocates the test to the specific routing instance, the source and destination IP address, the destination UDP port (which must match the listening UDP port on the reflector) and a number of other options that allow the operator to influence the packet handling. The probe interval and padding size can be configured under the specific session. The size of the all ‟0” padding can be included to ensure that the TWAMP packet is the same size in both directions. The TWAMP PDU definition does not accomplish symmetry by default. A pad size of 27 bytes will accomplish symmetrical TWAMP frame sizing in each direction.
The OAM-PM architecture does not perform any validation of the session information. The test will be allowed to be activated regardless of the validity of this information. For example, if the configured source IP address is not local within the router instance to which the test is allocated, the test will start sending TWAMP Light packets but will not receive any responses.
The OAM Performance Monitoring (OAM-PM) section of this guide provides more information describing the integration of TWAMP Light and the OAM-PM architecture, including hardware dependencies.
The following is a summary of supported TWAMP Light functions.
base router instances for network interfaces and IES services:
IPv6 addresses are supported only with IP interfaces that support IPv6, such as an IES IP interface in access-uplink and network mode. IPv6 is not supported for IP interfaces that do not support IPv6; for example, routed VPLS services in access-uplink mode do not support IPv6, and therefore TWAMP Light IPv6 sessions are not supported with it.
per-VPRN service context
IPv4 and IPv6:
must be unicast
for IPv6, addresses cannot be a reserved or link local address
reflector prefix definition for acceptable TWAMP Light sources:
Prefix list may be added and removed without shutting down the reflector function.
If no prefixes are defined, the reflector will drop all TWAMP Light packets.
integration with OAM-PM architecture capturing delay and loss measurement statistics:
Not available from interactive CLI.
Multiple test sessions can be configured between the same source and destination IP endpoints. The tuple of Source IP, Destination IP, Source UDP, and Destination UDP provide a unique index for each test.
The following example shows a basic configuration using TWAMP Light to monitor two IP endpoints in a VPRN, including the default TWAMP Light values that were not overridden with configuration entries.
The following is a sample reflector configuration output.
config>test-oam>twamp>twamp-light# info detail
--------------------------------------------------------------------------
(default)      inactivity-timeout 100
--------------------------------------------------------------------------

config>service>vprn# info
---------------------------------------------------------------------------
            route-distinguisher 65535:500
            auto-bind ldp
            vrf-target target:65535:500
            interface "to-cpe31" create
                address 10.1.1.1/30
                sap 1/1/2:500 create
                exit
            exit
            static-route 192.168.1.0/24 next-hop 10.1.1.2
            bgp
                no shutdown
            exit
            twamp-light
                reflector udp-port 15000 create
                    description "TWAMP Light reflector VPRN 500"
                    prefix 10.2.1.1/32 create
                        description "Process only 10.2.1.1 TWAMP Light Packets"
                    exit
                    prefix 172.16.1.0/24 create
                        description "Process all 172.16.1.0 TWAMP Light packets"
                    exit
                    no shutdown
                exit
            exit
            no shutdown
------------------------------------------------------------------------------
The following is a sample session controller configuration output.
config>service>vprn# info
-------------------------------------------------------------------------
            route-distinguisher 65535:500
            auto-bind ldp
            vrf-target target:65535:500
            interface "to-cpe28" create
                address 10.2.1.1/30
                sap 1/1/4:500 create
                exit
            exit
            static-route 192.168.2.0/24 next-hop 10.2.1.2
            no shutdown
-------------------------------------------------------------------------

config>oam-pm>session# info detail
-------------------------------------------------------------------------
            bin-group 2
            meas-interval 15-mins create
                intervals-stored 8
            exit
            ip
                dest-udp-port 15000
                destination 10.1.1.1
                fc "l2"
(default)           no forwarding
                profile in
                router 500
                source 10.2.1.1
(default)          ttl 255
                twamp-light test-id 500 create
(default)              interval 100
(default)              pad-size 0
(default)              no test-duration
                   no shutdown
                exit
            exit
-------------------------------------------------------------------------
Ethernet Connectivity Fault Management
The IEEE and the ITU-T have cooperated to define the protocols, procedures and managed objects to support service-based fault management. Both IEEE 802.1ag standard (Ethernet Connectivity Fault Management (ETH-CFM)) and the ITU-T Y.1731 recommendation support a common set of tools that allow operators to deploy the necessary administrative constructs, management entities and functionality. The ITU-T has also implemented a set of advanced ETH-CFM and performance management functions and features that build on the proactive and on-demand troubleshooting tools.
CFM uses Ethernet frames and is distinguishable by Ethertype 0x8902. In certain cases, the different functions use a reserved multicast address that can also be used to identify specific functions at the MAC layer. However, the multicast MAC addressing is not used for every function or in every case. The Operational Code (OpCode) in the common CFM header is used to identify the type of function carried in the CFM packet. CFM frames are only processed by IEEE MAC bridges. With CFM, interoperability can be achieved between different vendor equipment in the service provider network up to and including customer premise bridges.
IEEE 802.1ag and ITU-T Y.1731 functions that are implemented are available on the 7210 SAS platforms.
The following table lists the CFM-related acronyms used in this section.
| Acronym | Expansion |
|---|---|
1DM |
One way Delay Measurement (Y.1731) |
AIS |
Alarm Indication Signal |
CCM |
Continuity Check Message |
CFM |
Connectivity Fault Management |
DMM |
Delay Measurement Message (Y.1731) |
DMR |
Delay Measurement Reply (Y.1731) |
LBM |
Loopback Message |
LBR |
Loopback Reply |
LTM |
Linktrace Message |
LTR |
Linktrace Reply |
ME |
Maintenance Entity |
MA |
Maintenance Association |
MA-ID |
Maintenance Association Identifier |
MD |
Maintenance Domain |
MEP |
Maintenance association End Point |
MEP-ID |
Maintenance association End Point Identifier |
MHF |
MIP Half Function |
MIP |
Maintenance domain Intermediate Point |
OpCode |
Operational Code |
RDI |
Remote Defect Indication |
TST |
Ethernet Test (Y.1731) |
ETH-CFM building blocks
The IEEE and the ITU-T use their own nomenclature when describing administrative contexts and functions. This introduces a level of complexity to configuration, description and different vendors naming conventions. The 7210 SAS OS CLI has chosen to standardize on the IEEE 802.1ag naming where overlap exists. ITU-T naming is used when no equivalent is available in the IEEE standard. In the following definitions, both the IEEE name and ITU-T names are provided for completeness, using the format IEEE Name/ITU-T Name.
Maintenance Domain (MD)/Maintenance Entity (ME) is the administrative container that defines the scope, reach and boundary for faults. It is typically the area of ownership and management responsibility. The IEEE allows for various formats to name the domain, allowing up to 45 characters, depending on the format selected. ITU-T supports only a format of none and does not accept the IEEE naming conventions:
0
Undefined and reserved by the IEEE.
1
No domain name. It is the only format supported by Y.1731 as the ITU-T specification does not use the domain name. This is supported in the IEEE 802.1ag standard but not in currently implemented for 802.1ag defined contexts.
2,3,4
Provides the ability to input various different textual formats, up to 45 characters. The string format (2) is the default and therefore the keyword is not shown when looking at the configuration.
Maintenance Association (MA)/Maintenance Entity Group (MEG) is the construct where the different management entities will be contained. Each MA is uniquely identified by its MA-ID. The MA-ID is comprised of the by the MD level and MA name and associated format. This is another administrative context where the linkage is made between the domain and the service using the bridging-identifier configuration option. The IEEE and the ITU-T use their own specific formats. The MA short name formats (0-255) have been divided between the IEEE (0-31, 64-255) and the ITU-T (32-63), with five currently defined (1-4, 32). Even though the different standards bodies do not have specific support for the others formats a Y.1731 context can be configured using the following IEEE format options:
1 (Primary VID) - values 0 to 4094
2 (String) - raw ASCII, excluding 0-31 decimal/0-1F hex (which are control characters) form the ASCII table
3 (2-octet integer) - 0 to 65535
4 (VPN ID) - hex value as described in RFC 2685, Virtual Private Networks Identifier
32 (icc-format) - exactly 13 characters from the ITU-T recommendation T.50
When a VID is used as the short MA name, 802.1ag will not support VLAN translation because the MA-ID must match all the MEPs. The default format for a short MA name is an integer. Integer value 0 means the MA is not attached to a VID. This is useful for VPLS services on 7210 SAS platforms because the VID is locally significant.
Maintenance Domain Level (MD Level)/Maintenance Entity Group Level (MEG Level) is the numerical value (0-7) representing the width of the domain. The wider the domain, higher the numerical value, the farther the ETH-CFM packets can travel. It is important to understand that the level establishes the processing boundary for the packets. Strict rules control the flow of ETH-CFM packets and are used to ensure correct handling, forwarding, processing and dropping of these packets. To keep it simple ETH-CFM packets with higher numerical level values will flow through MEPs on MIPs on SAPs configured with lower level values. This allows the operator to implement different areas of responsibility and nest domains within each other. Maintenance association (MA) includes a set of MEPs, each configured with the same MA-ID and MD level used verify the integrity of a single service instance.
Maintenance Endpoint (MEP)/MEG Endpoint (MEP) are the workhorses of ETH-CFM. A MEP is the unique identification within the association (0-8191). Each MEP is uniquely identified by the MA-ID, MEPID tuple. This management entity is responsible for initiating, processing and terminating ETH-CFM functions, following the nesting rules. MEPs form the boundaries which prevent the ETH-CFM packets from flowing beyond the specific scope of responsibility. A MEP has direction, up or down. Each indicates the directions packets will be generated; UP toward the switch fabric, down toward the SAP away from the fabric. Each MEP has an active and passive side. Packets that enter the active point of the MEP will be compared to the existing level and processed accordingly. Packets that enter the passive side of the MEP are passed transparently through the MEP. Each MEP contained within the same maintenance association and with the same level (MA-ID) represents points within a single service. MEP creation on a SAP is allowed only for Ethernet ports with NULL, Q-tags, Q-in-Q encapsulations. MEPs may also be created on SDP bindings.
Maintenance Intermediate Point (MIP)/MEG Intermediate Point (MIP) are management entities between the terminating MEPs along the service path. These provide insight into the service path connecting the MEPs. MIPs only respond to Loopback Messages (LBM) and Linktrace Messages (LTM). All other CFM functions are transparent to these entities. Only one MIP is allowed per SAP or SDP. The creation of the MIPs can be done when the lower level domain is created (explicit). This is controlled by the use of the mhf-creation mode within the association under the bridge-identifier. MIP creation is supported on a SAP and SDP, not including Mesh SDP bindings. By default, no MIPs are created.
There are two locations in the configuration where ETH-CFM is defined. The domains, associations (including linkage to the service id), MIP creation method, common ETH-CFM functions and remote MEPs are defined under the top level eth-cfm command. It is important to note, when Y.1731 functions are required the context under which the MEPs are configured must follow the Y.1731 specific formats (domain format of none, MA format icc-format). When these parameters have been entered, the MEP and possibly the MIP can be defined within the service under the SAP or SDP.
ETH-CFM support matrix for the 7210 SAS-T (network mode), ETH-CFM support matrix for the 7210 SAS-T (access-uplink mode), ETH-CFM support matrix for 7210 SAS-Mxp devices, ETH-CFM support matrix for 7210 SAS-R6 and 7210 SAS-R12 devices, ETH-CFM support matrix for 7210 SAS-Sx/S 1/10GE devices, and ETH-CFM support matrix for 7210 SAS-Sx 10/100GE devices are general tables that indicate the ETH-CFM support for the different services and endpoints. It is not meant to indicate the services that are supported or the requirements for those services on the individual platforms.
| Service | Ethernet connection type | MEP | MIP | Primary VLAN | ||
|---|---|---|---|---|---|---|
| Down MEP | Up MEP | Ingress MIP | Egress MIP | |||
Epipe |
SAP |
✓ |
✓ |
✓ |
✓ |
✓ 1 |
SDP |
✓ |
✓ |
✓ |
✓ |
||
VPLS |
SAP |
✓ |
✓ |
✓ |
✓ 1 |
|
Spoke-SDP |
✓ |
✓ |
✓ |
|||
Mesh-SDP |
✓ |
✓ |
||||
RVPLS |
SAP |
|||||
IES |
IES IPv4 interface |
|||||
PBB Epipe |
I-SAP |
✓ |
||||
PBB VPLS |
I-SAP |
|||||
PBB B-VPLS |
B-SAP |
|||||
IES |
SAP |
|||||
VPRN |
SAP |
|||||
| Service | Ethernet connection type | MEP | MIP | Primary VLAN | ||
|---|---|---|---|---|---|---|
| Down MEP | Up MEP | Ingress MIP | Egress MIP | |||
Epipe |
SAP (Access and Access-uplink SAP) |
✓ |
✓ |
✓ |
✓ |
|
VPLS |
SAP (Access and Access-uplink SAP) |
✓ |
✓ |
✓ |
||
RVPLS |
SAP |
|||||
IES |
IES IPv4 interface |
|||||
SAP |
||||||
| Service | Ethernet connection type | MEP | MIP | Primary VLAN | ||
|---|---|---|---|---|---|---|
| Down MEP | Up MEP | Ingress MIP | Egress MIP | |||
Epipe |
SAP |
✓ |
✓ |
✓ |
✓ |
✓ 1 |
SDP |
✓ |
✓ |
✓ |
✓ |
||
VPLS |
SAP |
✓ |
✓ |
✓ |
✓ 1 |
|
Spoke-SDP |
✓ |
✓ |
✓ |
|
||
Mesh-SDP |
✓ |
✓ |
||||
RVPLS |
SAP |
|||||
IES |
IES IPv4 interface |
|||||
PBB Epipe |
I-SAP |
|||||
PBB VPLS |
I-SAP |
|||||
PBB B-VPLS |
B-SAP |
|||||
IES |
SAP |
|||||
VPRN |
SAP |
|||||
| Service | Ethernet connection type | MEP | MIP | Primary VLAN | ||
|---|---|---|---|---|---|---|
| Down MEP | Up MEP | Ingress MIP | Egress MIP | |||
Epipe |
SAP |
✓ |
✓ |
✓ |
✓ |
✓ 2 |
SDP |
✓ |
✓ |
✓ |
✓ |
||
VPLS |
SAP |
✓ |
✓ 3 |
✓ |
✓ |
✓ 4 |
Spoke-SDP |
✓ |
✓ 3 |
✓ |
|||
Mesh-SDP |
✓ 3 |
|||||
R-VPLS |
SAP |
|||||
IES |
IES IPv4 interface |
|||||
PBB Epipe |
I-SAP |
|||||
PBB VPLS |
I-SAP |
|||||
PBB B-VPLS |
B-SAP |
|||||
IES |
SAP |
|||||
VPRN |
SAP |
|||||
| Service | Ethernet connection type | MEP | MIP | Primary VLAN | ||
|---|---|---|---|---|---|---|
| Down MEP | Up MEP | Ingress MIP | Egress MIP | |||
Epipe |
SAP |
✓ |
✓ |
✓ |
✓ |
✓ 1 |
SDP |
✓ |
✓ |
✓ |
✓ |
||
VPLS |
SAP |
✓ |
✓ |
✓ |
✓ 1 |
|
Spoke-SDP |
✓ |
✓ |
✓ |
|||
Mesh-SDP |
✓ |
✓ |
||||
RVPLS |
SAP |
|||||
IES |
IES IPv4 interface |
|||||
PBB Epipe |
I-SAP |
|||||
PBB VPLS |
I-SAP |
|||||
PBB B-VPLS |
B-SAP |
|||||
IES |
SAP |
|||||
VPRN |
SAP |
|||||
| Service | Ethernet connection type | MEP | MIP | Primary VLAN | ||
|---|---|---|---|---|---|---|
| Down MEP | Up MEP | Ingress MIP | Egress MIP | |||
Epipe |
SAP |
✓ |
✓ |
✓ |
✓ |
✓ 1 |
SDP |
✓ |
✓ |
✓ |
✓ |
||
VPLS |
SAP |
✓ |
✓ |
✓ |
✓ 1 |
|
Spoke-SDP |
✓ |
✓ |
✓ |
|||
Mesh-SDP |
✓ |
✓ |
||||
RVPLS |
SAP |
|||||
IES |
IES IPv4 interface |
|||||
PBB Epipe |
I-SAP |
|||||
PBB VPLS |
I-SAP |
|||||
PBB B-VPLS |
B-SAP |
|||||
IES |
SAP |
|||||
VPRN |
SAP |
|||||
The following figures show the detailed IEEE representation of MEPs, MIPs, levels and associations, using the standards defined icons.
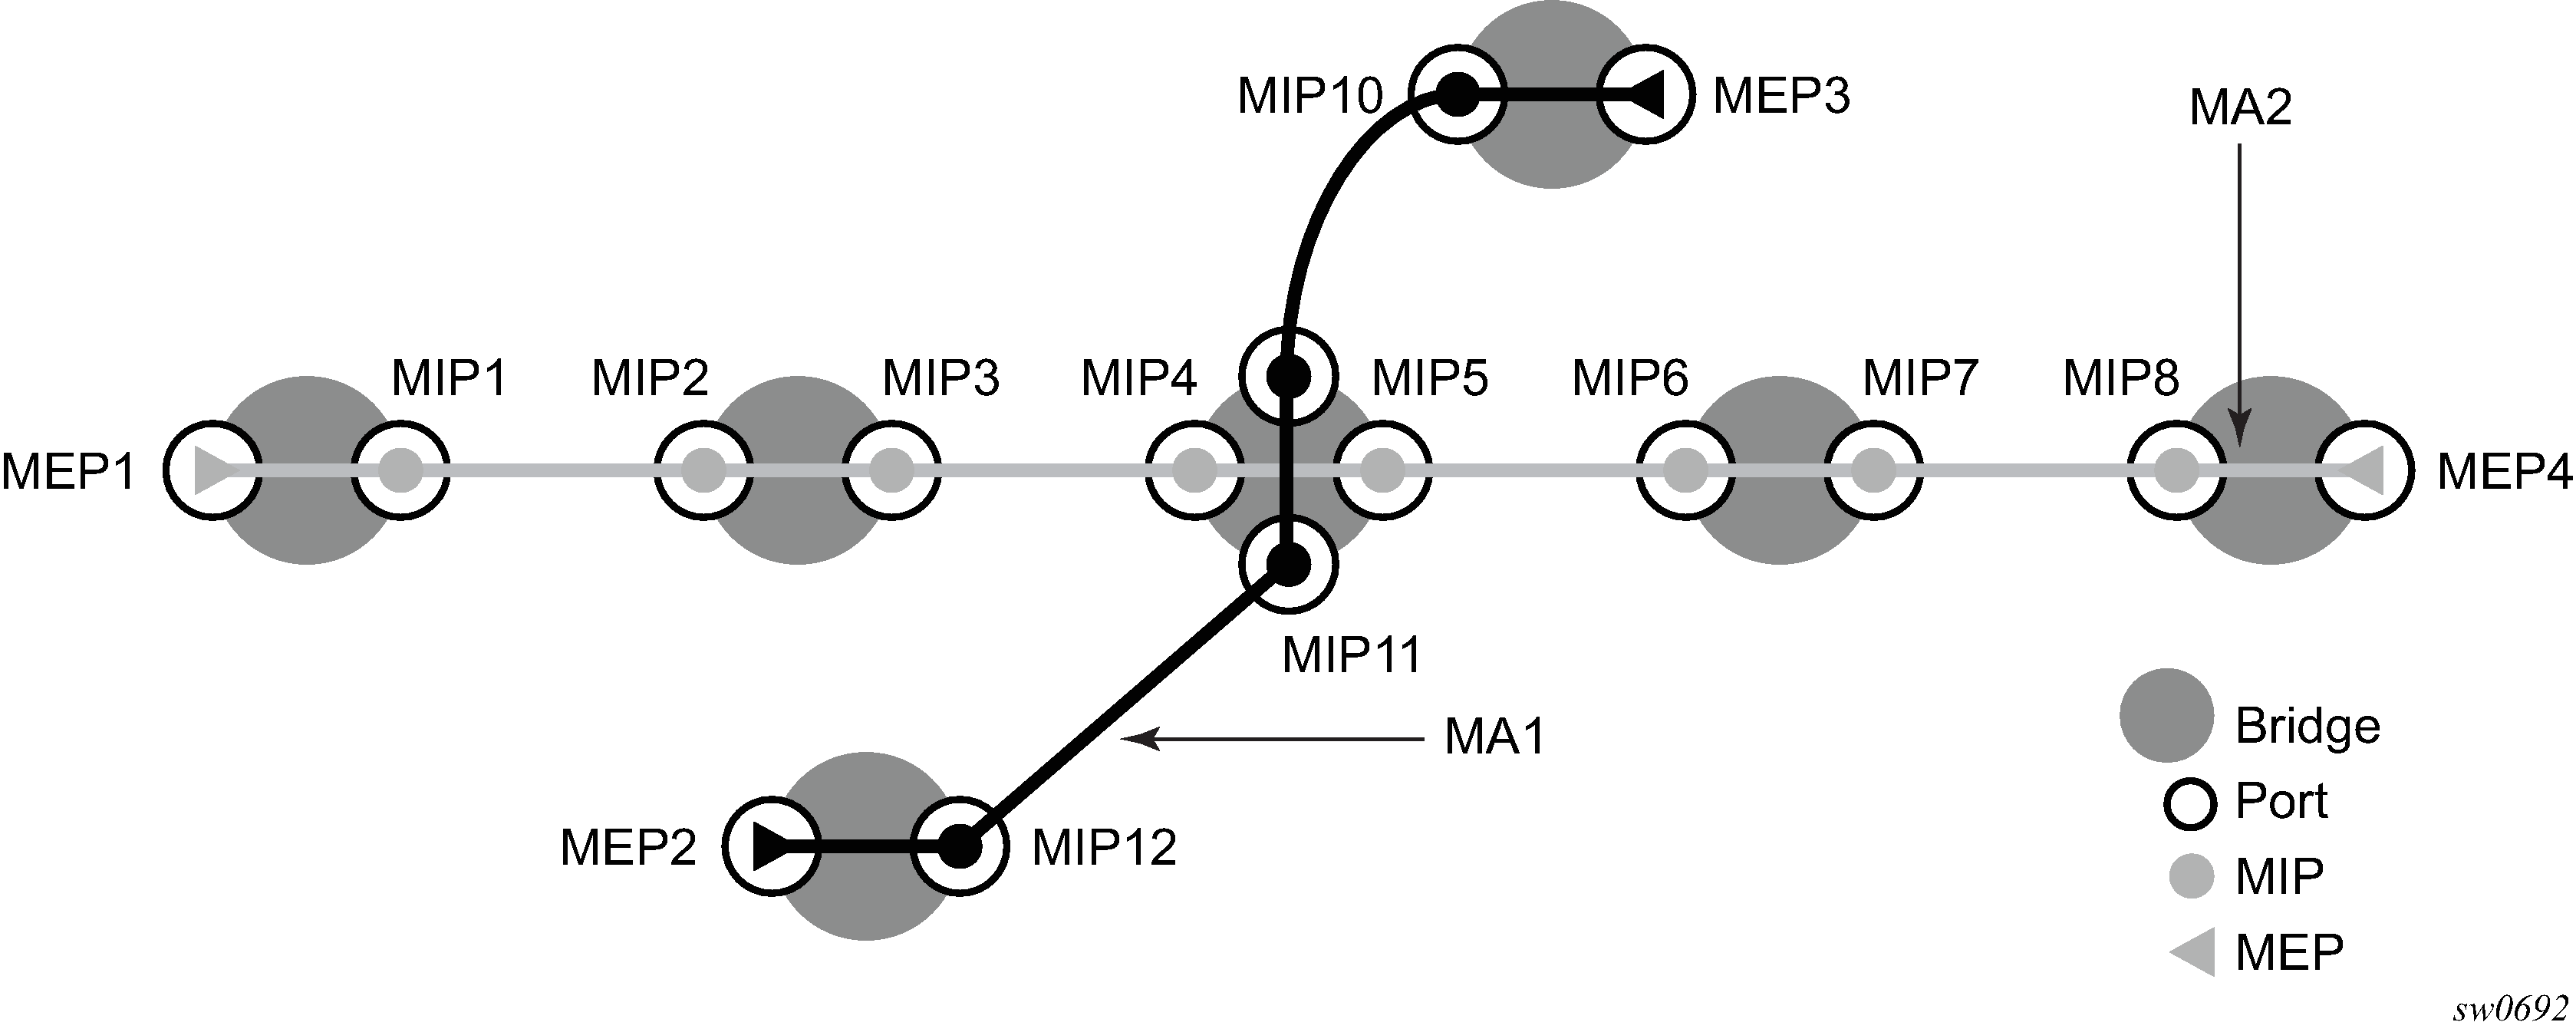
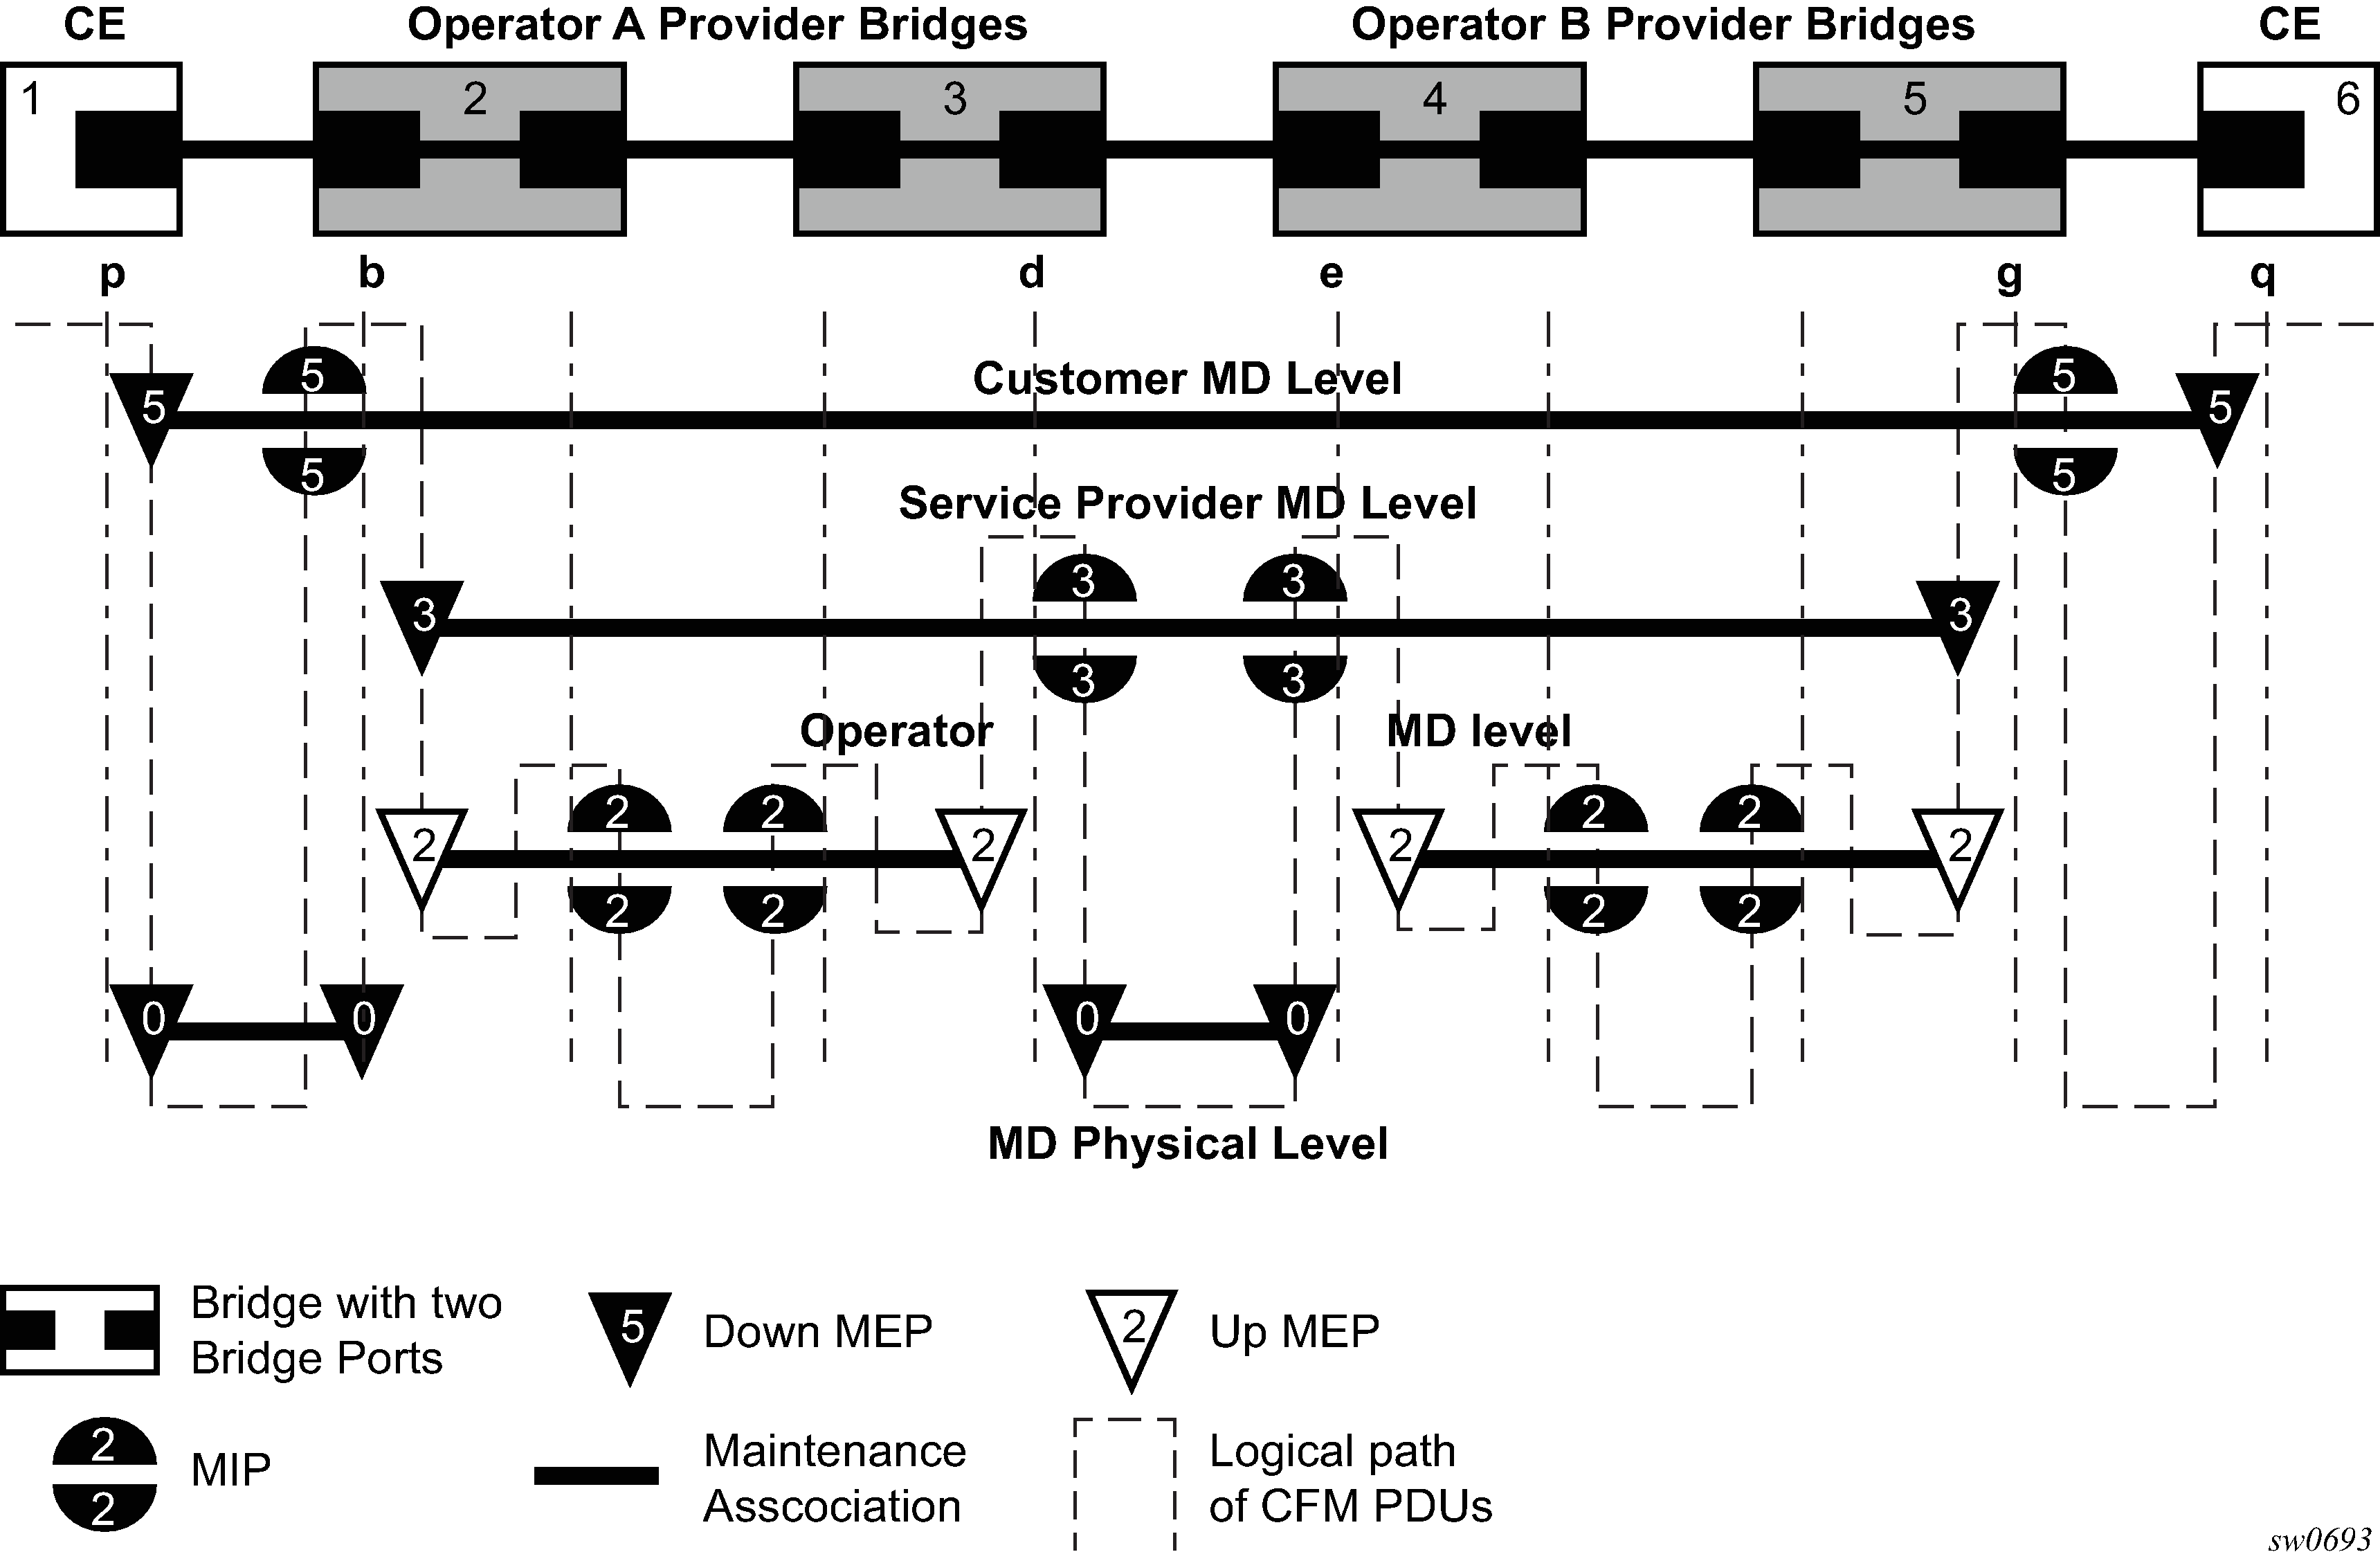
Loopback
A loopback message is generated by a MEP to its peer MEP (see the following figure). The functions are similar to an IP ping to verify Ethernet connectivity between the nodes.
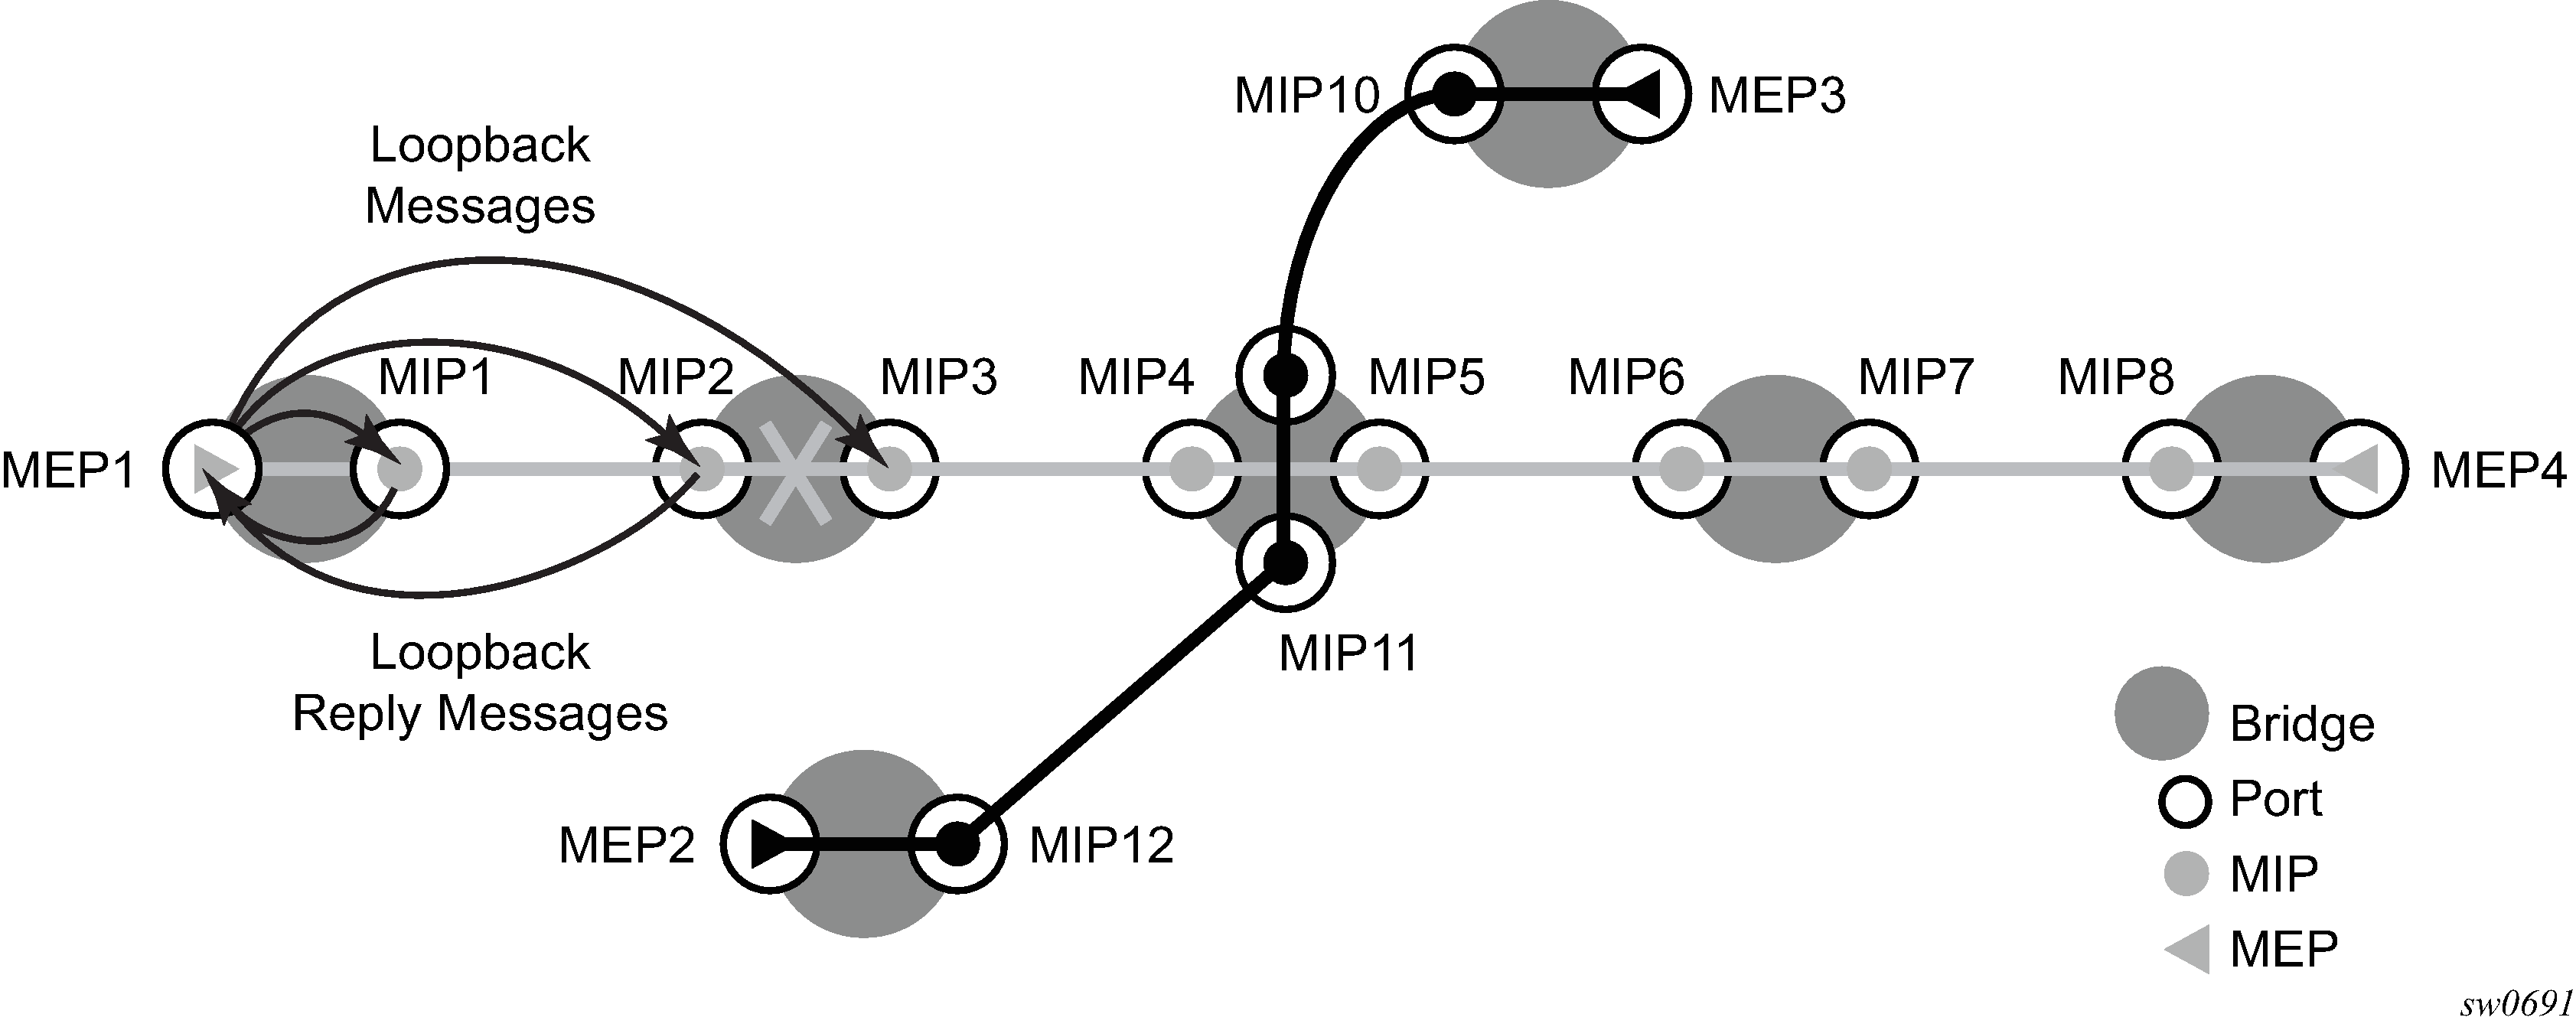
The following loopback-related functions are supported:
Loopback message functionality on a MEP or MIP can be enabled or disabled.
A MEP supports generating loopback messages and responding to loopback messages with loopback reply messages.
A MIP supports responding to loopback messages with loopback reply messages when loopback messages are targeted to itself.
The Sender ID TLV may optionally be configured to carry the Chassis ID. When configured, the following information will be included in LBM messages:
Only the Chassis ID portion of the TLV will be included.
The Management Domain and Management Address fields are not supported on transmission.
As per the specification, the LBR function copies and returns any TLVs received in the LBM message. This means that the LBR message will include the original Sender ID TLV.
The Sender ID TLV is supported for service (id-permission) MEPs.
The Sender ID TLV is supported for both MEPs and MIPs.
Loopback test results are displayed on the originating MEP. There is a limit of 10 outstanding tests per node.
Linktrace
A linktrace message is originated by an MEP and targeted to a peer MEP in the same MA and within the same MD level (see CFM linktrace). Its function is similar to IP traceroute. Linktrace traces a specific MAC address through the service. The peer MEP responds with a linktrace reply message after successful inspection of the linktrace message. The MIPs along the path also process the linktrace message and respond with linktrace replies to the originating MEP if the received linktrace message that has a TTL greater than 1; the MIPs also forward the linktrace message if a lookup of the target MAC address in the Layer 2 FIB is successful. The originating MEP will receive multiple linktrace replies and from processing the linktrace replies, it can put together the route to the target bridge.
A traced MAC address (the targeted MAC address) is carried in the payload of the linktrace message. Each MIP and MEP receiving the linktrace message checks whether it has learned the target MAC address. To use linktrace, the target MAC address must have been learned by the nodes in the network. If the address has been learned, a linktrace message is sent back to the originating MEP. A MIP forwards the linktrace message out of the port where the target MAC address was learned.
The linktrace message has a multicast destination address. On a broadcast LAN, it can be received by multiple nodes connected to that LAN; However, only one node will send a reply.
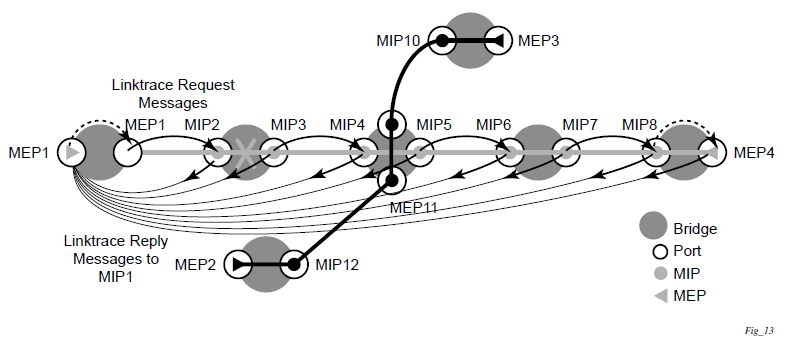
The following linktrace-related functions are supported:
Linktrace functions can be enabled or disabled on an MEP.
A MEP supports generating linktrace messages and responding with linktrace reply messages.
A MIP supports responding to linktrace messages with linktrace reply messages when encoded TTL is greater than 1; The MIPs forward the linktrace messages accordingly if a lookup of the target MAC address in the Layer 2 FIB is successful.
The Sender ID TLV may optionally be configured to carry the Chassis ID. When configured, the following information will be included in LTM and LTR messages:
Only the Chassis ID portion of the TLV will be included.
The Management Domain and Management Address fields are not supported on transmission.
The LBM message will include the Sender ID TLV that is configured on the launch point. The LBR message will include the Sender ID TLV information from the reflector (MIP or MEP) if it is supported.
The Sender ID TLV is supported for service (id-permission) MEPs.
The Sender ID TLV is supported for both MEPs and MIPs.
The display output has been updated to include the Sender ID TLV contents if they are included in the LBR.
oam eth-cfm linktrace 00:00:00:00:00:30 mep 28 domain 14 association 2
Index Ingress Mac          Egress Mac           Relay     Action
----- -------------------- -------------------- ---------- ----------
1     00:00:00:00:00:00    00:00:00:00:00:30    n/a       terminate
SenderId TLV: ChassisId (local)
              access-012-west
----- -------------------- -------------------- ---------- ----------
No more responses received in the last 6 seconds.
-
Linktrace test results are displayed on the originating MEP. There is a limit of 10 outstanding tests per node. Storage is provided for up to 10 MEPs and for the last 10 responses. If more than 10 responses are received older entries will be overwritten.
Continuity Check (CC)
A Continuity Check Message (CCM) is a multicast frame that is generated by a MEP and multicast to all other MEPs in the same MA. The CCM does not require a reply message. To identify faults, the receiving MEP maintains an internal list of remote MEPs it should be receiving CCM messages from.
This list is based on the remote MEP ID configuration within the association the MEP is created in. When the local MEP does not receive a CCM from one of the configured remote MEPs within a preconfigured period, the local MEP raises an alarm.
The following figure shows a CFM continuity check.
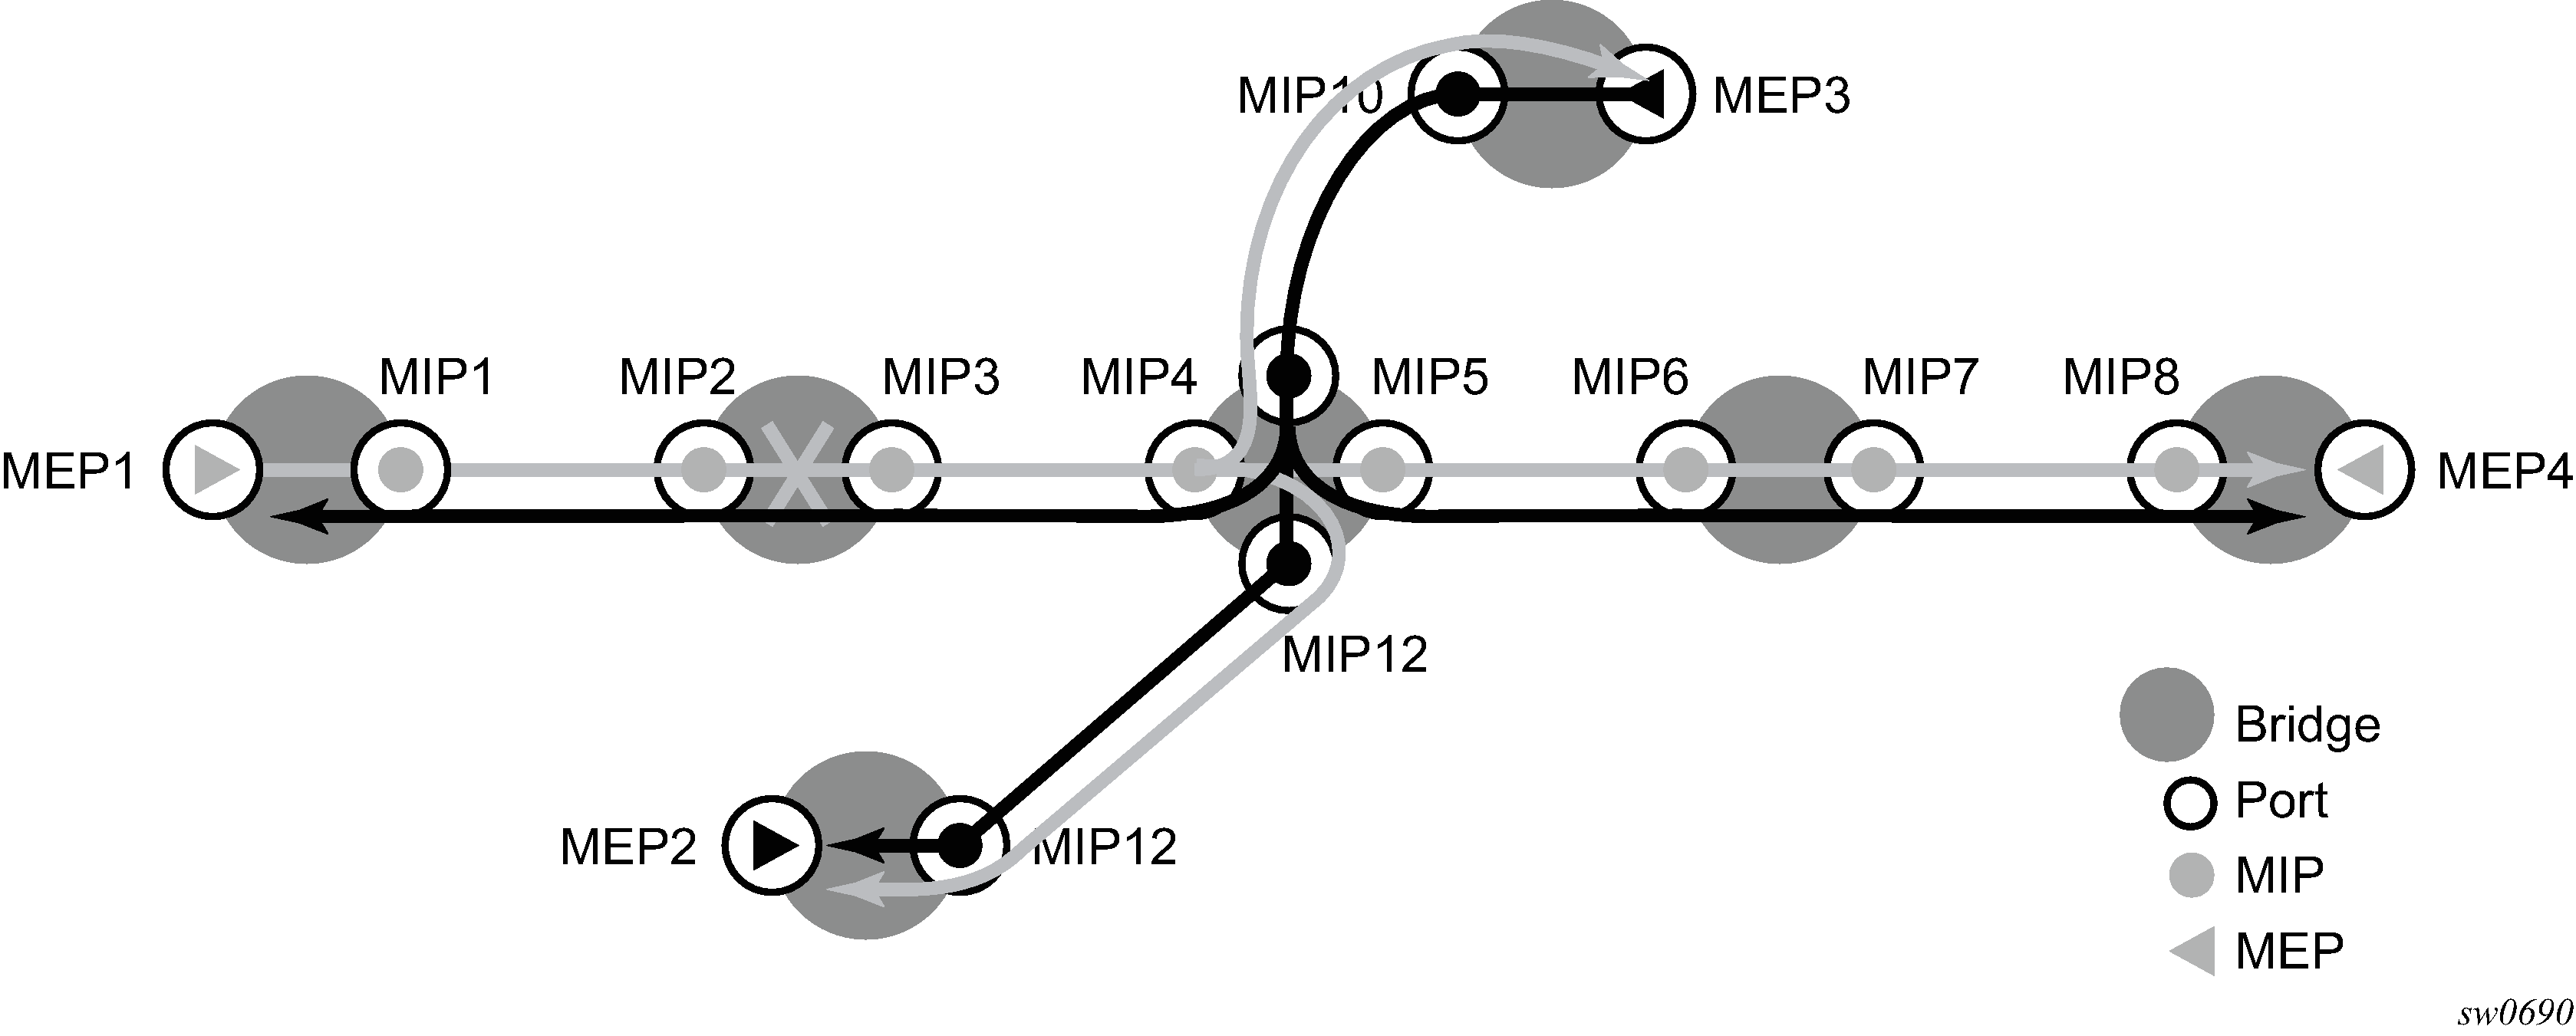
The following figure shows a CFM CC failure scenario.
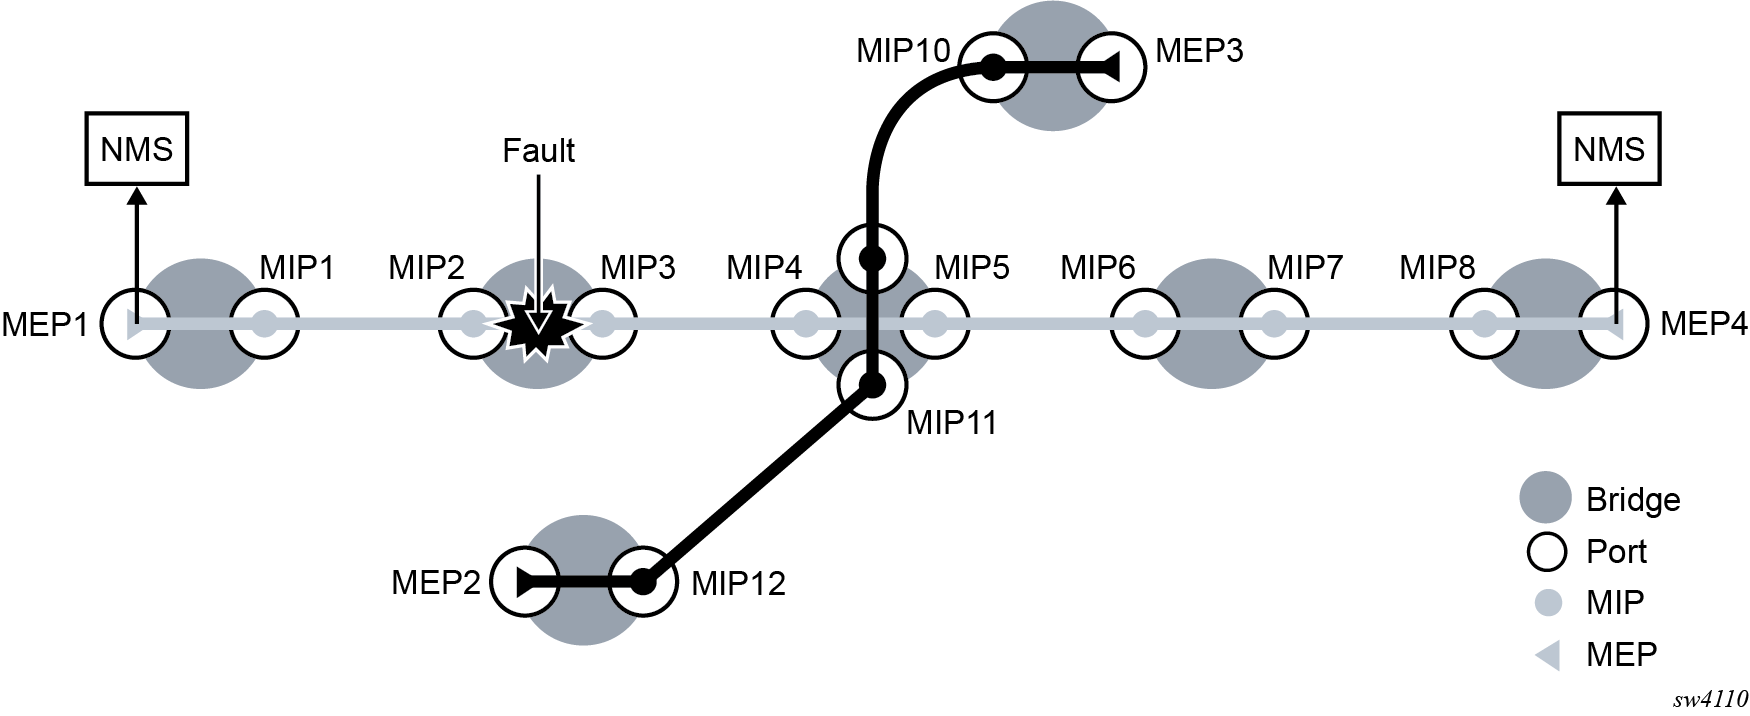
The following functions are supported:
CC can be enabled and disabled for an MEP.
MEP entries can be configured and deleted in the CC MEP monitoring database manually. Only remote MEPs must be configured. Local MEPs are automatically added to the database when they are created.
The CCM transmit interval is configurable. See the Diagnostics command reference for more information about supported timer intervals on different platforms for MEPs used in the service context and G.8032 control instance context.
CCM will declare a fault, when:
the CCM stops hearing from one of the remote MEPs for 3.5 times CC interval
the CCM hears from a MEP with a LOWER MD level
the CCM hears from a MEP that is not part of the local MEP’s MA
the CCM hears from a MEP that is in the same MA but not in the configured MEP list
the CCM hears from a MEP that is in the same MA with the same MEP ID as the receiving MEP
the CC interval of the remote MEP does not match the local configured CC interval
the remote MEP is declaring a fault
An alarm is raised and a trap is sent if the defect is greater than or equal to the configured low-priority-defect value.
Remote Defect Indication (RDI) is supported but by default is not recognized as a defect condition because the low-priority-defect setting default does not include RDI.
The Sender ID TLV may optionally be configured to carry the Chassis ID. When configured, the following information will be included in CCM messages:
Only the Chassis ID portion of the TLV will be included.
The Management Domain and Management Address fields are not supported on transmission.
The Sender ID TLV is not supported with subsecond CCM-enabled MEPs.
The Sender ID TLV is supported for service (id-permission) MEPs.
Alarm Indication Signal (ETH-AIS Y.1731)
Alarm Indication Signal (AIS) provides an Y.1731 capable MEP the ability to signal a fault condition in the reverse direction of the MEP, out the passive side. When a fault condition is detected the MEP will generate AIS packets at the configured client levels and at the specified AIS interval until the condition is cleared. Currently a MEP configured to generate AIS must do so at a level higher than its own. The MEP configured on the service receiving the AIS packets is required to have the active side facing the receipt of the AIS packet and must be at the same level the AIS, The absence of an AIS packet for 3.5 times the AIS interval set by the sending node will clear the condition on the receiving MEP.
It is important to note that AIS generation is not supported to an explicitly configured endpoint. An explicitly configured endpoint is an object that contains multiple individual endpoints, as in PW redundancy.
Test (ETH-TST Y.1731)
Ethernet test affords operators an Y.1731 capable MEP the ability to send an in service on demand function to test connectivity between two MEPs. The test is generated on the local MEP and the results are verified on the destination MEP. Any ETH-TST packet generated that exceeds the MTU will be silently dropped by the lower level processing of the node.
Y.1731 time stamp capability
Accurate results for one-way and two-way delay measurement tests using Y.1731 messages are obtained if the nodes are capable of time stamping packets in hardware:
7210 SAS-Sx 10/100GE support is as follows:
Y.1731 2-DM messages for both Down MEPs and UP MEPs, 1-DM for both Down MEPs and UP MEPs, and 2-SLM for both Down MEPs and UP MEPs use software-based timestamps on Tx and hardware based timestamp on Rx. It uses the system clock (free-running or synchronized to NTP) to obtain the timestamps.
7210 SAS-T (network mode), 7210 SAS-Sx 1/10GE, 7210 SAS-Mxp, 7210 SAS-R6 and 7210 SAS-R12 support is as follows:
Y.1731 2-DM messages for both Down MEPs and UP MEPs, 1-DM for both Down MEPs and UP MEPs, and 2-SLM for both Down MEPs and UP MEPs use software-based timestamps on transmission and hardware-based timestamps on receipt. The timestamps are obtained as follows:
from NTP, when NTP is enabled and PTP is disabled
from PTP, when PTP is enabled (irrespective of whether NTP is disabled or enabled)
from PTP, when PTP is enabled and NTP is configured to use PTP for system time
from free-running system time, when both NTP and PTP are disabled.
The 7210 SAS-T (access-uplink mode) support is as follows:
Y.1731 2-DM messages for Down MEPs uses hardware timestamps for both Rx (packets received by the node) and Tx (packets sent out of the node). The timestamps is obtained from a free-running hardware clock. It provides accurate 2-way delay measurements and it is not recommended to use it for computing 1-way delay.
Y.1731 2-DM messages for UP MEPs, 1-DM for both Down MEPs and UP MEPs, and 2-SLM for both Down MEPs and UP MEPs use software based timestamps on Tx and hardware based timestamp on Rx. The timestamps are obtained as follows:
from NTP, when NTP is enabled and PTP is disabled
from PTP, when PTP is enabled (irrespective of whether NTP is disabled or enabled)
from PTP, when PTP is enabled and NTP is configured to use PTP for system time
from free-running system time, when both NTP and PTP are disabled.
On the 7210 SAS-T, 7210 SAS-Mxp, 7210 SAS-R6, 7210 SAS-R12 after PTP is enabled once, if the user needs to go back to NTP time scale, or system free-run time scale, a node reboot is required.
ITU-T Y.1731 Ethernet Bandwidth Notification
This feature is only supported on the 7210 SAS-Mxp, 7210 SAS-R6, and 7210 SAS-R12.
The Ethernet Bandwidth Notification (ETH-BN) function is used by a server MEP to signal link bandwidth changes to a client MEP.
This functionality is for point-to-point microwave radios. When a microwave radio uses adaptive modulation, the capacity of the radio can change based on the condition of the microwave link. For example, in adverse weather conditions that cause link degradation, the radio can change its modulation scheme to a more robust one (which will reduce the link bandwidth) to continue transmitting.
This change in bandwidth is communicated from the server MEP on the radio, using an Ethernet Bandwidth Notification Message (ETH-BNM), to the client MEP on the connected router. The server MEP transmits periodic frames with ETH-BN information, including the interval, the nominal and currently available bandwidth. A port MEP with the ETH-BN feature enabled will process the information contained in the CFM PDU and appropriately adjust the rate of traffic sent to the radio.
A port MEP that is not a LAG member port supports the client side reception and processing of the ETH-BN CFM PDU sent by the server MEP. By default, processing is disabled. The config>port>ethernet>eth-cfm>mep eth-bn>receive CLI command sets the ETH-BN processing state on the port MEP. A port MEP supports untagged packet processing of ETH-CFM PDUs at domain levels 0 and 1 only. The port client MEP sends the ETH-BN rate information received to be applied to the port egress rate in a QoS update. A pacing mechanism limits the number of QoS updates sent. The config>port>ethernet>eth-cfm>mep>eth-bn>rx-update-pacing CLI command allows the updates to be paced using a configurable range of 1 to 600 seconds (the default is 5 seconds). The pacing timer begins to count down following the most recent QoS update sent to the system for processing. When the timer expires, the most recent update that arrived from the server MEP is compared to the most recent value sent for system processing. If the value of the current bandwidth is different from the previously processed value, the update is sent and the process begins again. Updates with a different current bandwidth that arrive when the pacing timer has already expired are not subject to a timer delay. See the 7210 SAS-Mxp, R6, R12, S, Sx, T Interface Configuration Guide for more information about these CLI commands.
A complimentary QoS configuration is required to allow the system to process current bandwidth updates from the CFM engine. The config>port>ethernet>eth-bn-egress-rate-changes CLI command is required to enable the QoS function to update the port egress rates based on the current available bandwidth updates from the CFM engine. By default, the function is disabled.
Both the CFM and QoS functions must be enabled for the changes in current bandwidth to dynamically update the egress rate.
When the MEP enters a state that prevents it from receiving the ETH-BNM, the current bandwidth last sent for processing is cleared and the egress rate reverts to the configured rate. Under these conditions, the last update cannot be guaranteed as current. Explicit notification is required to dynamically update the port egress rate. The following types of conditions lead to ambiguity:
administrative MEP shut down
port admin down
port link down
eth-bn no receive transitioning the ETH-BN function to disable
If the eth-bn-egress-rate-changes command is disabled using the no option, CFM continues to send updates, but the updates are held without affecting the port egress rate.
The ports supporting ETH-BN MEPs can be configured for the network, access, hybrid, and access-uplink modes. When ETH-BN is enabled on a port MEP and the config>port>ethernet>eth-cfm>mep>eth-bn>receive and the QoS config>port>ethernet>eth-bn-egress-rate-changes contexts are configured, the egress rate is dynamically changed based on the current available bandwidth indicated by the ETH-BN server.
For SAPs configured on an access port or hybrid port, changes in port bandwidth on reception of ETH-BNM messages will result in changes to the port egress rate, but the SAP egress aggregate shaper rate and queue egress shaper rate provisioned by the user are unchanged, which may result in an oversubscription of the committed bandwidth. Consequently, Nokia recommends that the user should change the SAP egress aggregate shaper rate and queue egress shaper rate for all SAPs configured on the port from an external management station after egress rate changes are detected on the port.
The port egress rate is capped by the minimum of the configured egress-rate, and the maximum port rate. The minimum egress rate using ETH-BN is 1024 kb/s. If a current bandwidth of zero is received, it does not affect the egress port rate and the previously processed current bandwidth will continue to be used.
The client MEP requires explicit notification of changes to update the port egress rate. The system does not timeout any previously processed current bandwidth rates using a timeout condition. The specification does allow a timeout of the current bandwidth if a frame has not been received in 3.5 times the ETH-BNM interval. However, the implicit approach can lead to misrepresented conditions and has not been implemented.
When you start or restart the system, the configured egress rate is used until an ETH-BNM arrives on the port with a new bandwidth request from the ETH-BN server MEP.
An event log is generated each time the egress rate is changed based on reception of a BNM. If a BNM is received that does not result in a bandwidth change, no event log is generated.
The destination MAC address can be a Class 1 multicast MAC address (that is, 01-80-C2-00-0x) or the MAC address of the port MEP configured. Standard CFM validation and identification must be successful to process CFM PDUs.
For information about the eth-bn-egress-rate-changes command, see the 7210 SAS-Mxp, R6, R12, S, Sx, T Interface Configuration Guide.
The Bandwidth Notification Message (BNM) PDU used for ETH-BN information is a sub-OpCode within the Ethernet Generic Notification Message (ETH-GNM).
The following table shows the BNM PDU format fields.
| Label | Description |
|---|---|
MEG Level |
Carries the MEG level of the client MEP (0 to 7). This field must be set to either 0 or 1 to be recognized as a port MEP. |
Version |
The current version is 0 |
OpCode |
The value for this PDU type is GNM (32) |
Flags |
Contains one information element: Period (3 bits), which indicates how often ETH-BN messages are transmitted by the server MEP. The following are the valid values:
|
TLV Offset |
This value is set to 13 |
Sub-OpCode |
The value for this PDU type is BNM (1) |
Nominal Bandwidth |
The nominal full bandwidth of the link, in Mb/s. This information is reported in the display but not used to influence QoS egress rates. |
Current Bandwidth |
The current bandwidth of the link in Mb/s. The value is used to influence the egress rate. |
Port ID |
A non-zero unique identifier for the port associated with the ETH-BN information, or zero if not used. This information is reported in the display, but is not used to influence QoS egress rates. |
End TLV |
An all zeros octet value On the 7210 SAS, port-level MEPs with level 0 or 1 should be implemented to support this application. A port-level MEP must support CCM, LBM, LTM, RDI, and ETH-BN, but can be used for ETH-BN only. |
The show eth-cfm mep eth-bandwidth-notification display output includes the ETH-BN values received and extracted from the PDU, including a last reported value and the pacing timer. If the n/a value appears in the field, it indicates that field has not been processed.
The base show eth-cfm mep output is expanded to include the disposition of the ETH-BN receive function and the configured pacing timer.
The show port port-id detail is expanded to include an Ethernet Bandwidth Notification Message Information section. This section includes the ETH-BN Egress Rate disposition and the current Egress BN rate being used.
ETH-BN configuration guidelines
The following guidelines apply to the ETH-BN configuration:
In a committed information rate (CIR) loop, scheduling is packet-based round robin with weight 1. This scheduling applies to SAP and port queues, and between SAP aggregates and network aggregates when the node is operating in the SAP scheduler mode. Refer to the 7210 SAS-Mxp, R6, R12, S, Sx, T Quality of Service Guide for more information about schedulers.
When the node is operating in the port-scheduler-mode, the access egress QoS policy is attached to the access port. Users can configure queue rates for the access egress QoS policy using either the rate or percent-rate command. The percent-rate command configures queue rates as a percentage of the port shaper rate that is currently in effect.
When using the ETH-BN feature, Nokia recommends using the percent-rate command to configure queue rates in the access egress QoS policy so that the system can update queue rates based on the ETH-BN port egress rate changes and oversubscription of the port scheduler is avoided.
To implement port-level policy attachment changes or queue mode changes for access egress or network queue policies, Nokia recommends shutting down the ports to which the policy is attached and waiting until the queues clear before modifying the QoS policy.
When modifying the queue mode on a queue for a SAP egress QoS policy that is already attached to SAPs, or when modifying a SAP egress QoS policy attached to any SAP, Nokia recommends shutting down the SAPs that the policy is attached to and waiting until the queues clear before modifying the QoS policy. Use the show pools access-egress and network-egress commands to check for zero queue depth.
Egress rate changes because of ETH-BN may lead to CIR oversubscription, which is not supported on the 7210 SAS-Mxp, 7210 SAS-R6, and 7210 SAS-R12. Use the following guidelines to avoid CIR oversubscription:
To use SAP scheduler mode for access or hybrid port mode, configure the CIR on queues in the SAP egress policy and SAP aggregates or network aggregates based on the lower ETH-BN expected rate, and ensure that the CIR is not oversubscribed. A change in the ETH-BN rate will not cause CIR oversubscription because the values are based on the lowest ETH-BN rate.
-
After an ETH-BN rate change is detected, update the QoS policy CIR and PIR values, and SAP and network aggregate rates from the management station to prevent CIR oversubscription.
Port-based MEPs
The 7210 SAS supports port-based MEPs for use with CFM ETH-BN. The port MEP must be configured at level 0 or 1 and can be used for ETH-BN message reception and processing as described in ITU-T Y.1731 Ethernet Bandwidth Notification. Port-based MEPs only support CFM CC, LT, LS, and RDI message processing; other CFM and Y.1731 messages are not supported.
Port-based MEPs are designed for the ETH-BN application. Nokia does not recommend the use of port-based MEPs with other applications.
ETH-CFM statistics
This feature is supported on all 7210 SAS platforms as described in this document, including those operating in access-uplink mode.
A number of statistics are available to view the current processing requirements for CFM. Any packet that is counted against the CFM resource is included in the statistics counters. The counters do not include sub-second CCM and ETH-CFM PDUs generated by non-ETH-CFM functions (which include OAM-PM and SAA) or filtered by a security configuration.
SAA and OAM-PM use standard CFM PDUs. The reception of these packets is included in the receive statistics. However, SAA and OAM-PM launch their own test packets and do not consume ETH-CFM transmission resources.
Per-system and per-MEP statistics are included with a per-OpCode breakdown. These statistics help operators determine the busiest active MEPs on the system and provide a breakdown of per-OpCode processing at the system and MEP level.
Use the show eth-cfm statistics command to view the statistics at the system level. Use the show eth-cfm mep mep-id domain md-index association ma-index statistics command to view the per-MEP statistics. Use the clear eth-cfm mep mep-id domain md-index association ma-index statistics command to clear statistics. The clear command clears the statistics for only the specified function. For example, clearing the system statistics does not clear the individual MEP statistics because each MEP maintains its own unique counters.
All known OpCodes are listed in the transmit and receive columns. Different versions for the same OpCode are not displayed. This does not imply that the network element supports all functions listed in the table. Unknown OpCodes are dropped.
Use the tools dump eth-cfm top-active-meps command to display the top ten active MEPs in the system. This command provides a nearly real-time view of the busiest active MEPS by displaying the active (not shutdown) MEPs and inactive (shutdown) MEPs in the system. ETH-CFM MEPs that are shutdown continue to consume CPM resources because the main task is syncing the PDUs. The counts begin from the last time that the command was issued using the clear option.
tools dump eth-cfm top-active-meps
Calculating most active MEPs in both direction without clear ...

MEP                  Rx Stats     Tx Stats     Total Stats
-------------------- ------------ ------------ ------------
12/4/28              3504497      296649       3801146
14/1/28              171544       85775        257319
14/2/28              150942       79990        230932

tools dump eth-cfm top-active-meps clear
Calculating most active MEPs in both direction with clear ...

MEP                  Rx Stats     Tx Stats     Total Stats
-------------------- ------------ ------------ ------------
12/4/28              3504582      296656       3801238
14/1/28              171558       85782        257340
14/2/28              150949       79997        230946

tools dump eth-cfm top-active-meps clear
Calculating most active MEPs in both direction with clear ...

MEP                  Rx Stats     Tx Stats     Total Stats
-------------------- ------------ ------------ ------------
12/4/28              28           2            30
14/1/28              5            2            7
14/2/28              3            2            5
Synthetic Loss Measurement (ETH-SL)
Nokia applied pre-standard OpCodes 53 (Synthetic Loss Reply) and 54 (Synthetic Loss Message) for the purpose of measuring loss using synthetic packets.
These will be changes to the assigned standard values in a future release. This means that the Release 4.0R6 is prestandard and will not interoperate with future releases of SLM or SLR that supports the standard OpCode values.
This synthetic loss measurement approach is a single-ended feature that allows the operator to run on-demand and proactive tests to determine ‟in”, ‟out” loss and ‟unacknowledged” packets. This approach can be used between peer MEPs in both point to point and multipoint services. Only remote MEP peers within the association and matching the unicast destination will respond to the SLM packet.
The specification uses various sequence numbers to determine in which direction the loss occurred. Alcatel-Lucent has implemented the required counters to determine loss in each direction. To correctly use the information that is gathered the following terms are defined:
count
The count is the number of probes that are sent when the last frame is not lost. When the last frames is or are lost, the count and unacknowledged equals the number of probes sent.
out-loss (far-end)
Out-loss packets are lost on the way to the remote node, from test initiator to the test destination.
in-loss (near-end)
In-loss packets are lost on the way back from the remote node to the test initiator.
unacknowledged
Unacknowledged number of packets are at the end of the test that were not responded to.
The per probe specific loss indicators are available when looking at the on-demand test runs, or the individual probe information stored in the MIB. When tests are scheduled by Service Assurance Application (SAA) the per probe data is summarized and per probe information is not maintained. Any ‟unacknowledged” packets will be recorded as ‟in-loss” when summarized.
The on-demand function can be executed from CLI or SNMP. The on demand tests are meant to provide the carrier a way to perform on the spot testing. However, this approach is not meant as a method for storing archived data for later processing. The probe count for on demand SLM has a range of one to 100 with configurable probe spacing between one second and ten seconds. This means it is possible that a single test run can be up to 1000 seconds.
Although possible, it is more likely the majority of on demand case can increase to 100 probes or less at a one second interval. A node may only initiate and maintain a single active on demand SLM test at any specific time. A maximum of one storage entry per remote MEP is maintained in the results table. Subsequent runs to the same peer can overwrite the results for that peer. This means, when using on demand testing the test should be run and the results checked before starting another test.
The proactive measurement functions are linked to SAA. This backend provides the scheduling, storage and summarization capabilities. Scheduling may be either continuous or periodic. It also allows for the interpretation and representation of data that may enhance the specification. As an example, an optional TVL has been included to allow for the measurement of both loss and delay or jitter with a single test. The implementation does not cause any interoperability because the optional TVL is ignored by equipment that does not support this. In mixed vendor environments loss measurement continues to be tracked but delay and jitter can only report round trip times. It is important to point out that the round trip times in this mixed vendor environments include the remote nodes processing time because only two time stamps will be included in the packet. In an environment where both nodes support the optional TLV to include time stamps unidirectional and round trip times is reported. Because all four time stamps are included in the packet the round trip time in this case does not include remote node processing time. Of course, those operators that want to run delay measurement and loss measurement at different frequencies are free to run both ETH-SL and ETH-DM functions. ETH-SL is not replacing ETH-DM. Service Assurance is only briefly described here to provide some background on the basic functionality. To know more about SAA functions see Service Assurance Agent overview.
The ETH-SL packet format contains a test-id that is internally generated and not configurable. The test-id is visible for the on demand test in the display summary. It is possible for a remote node processing the SLM frames receives overlapping test-ids as a result of multiple MEPs measuring loss between the same remote MEP. For this reason, the uniqueness of the test is based on remote MEP-ID, test-id and Source MAC of the packet.
ETH-SL is applicable to up and down MEPs and as per the recommendation transparent to MIPs. There is no coordination between various fault conditions that could impact loss measurement. This is also true for conditions where MEPs are placed in shutdown state as a result of linkage to a redundancy scheme like MC-LAG. Loss measurement is based on the ETH-SL and not coordinated across different functional aspects on the network element. ETH-SL is supported on service based MEPs.
It is possible that two MEPs may be configured with the same MAC on different remote nodes. This causes various issues in the FDB for multipoint services and is considered a misconfiguration for most services. It is possible to have a valid configuration where multiple MEPs on the same remote node have the same MAC. In fact, this is likely to happen. In this release, only the first responder is used to measure packet loss. The second responder is dropped. Because the same MAC for multiple MEPs is only truly valid on the same remote node this should is an acceptable approach.
There is no way for the responding node to understand when a test is completed. For this reason a configurable ‟inactivity-timer” determines the length of time a test is valid. The timer will maintain an active test as long as it is receiving packets for that specific test, defined by the test-id, remote MEP Id and source MAC. When there is a gap between the packets that exceeds the inactivity-timer the responding node responds with a sequence number of one regardless of what the sequence number was the instantiating node sent. This means the remote MEP accepts that the previous test has expired and these probes are part of a new test. The default for the inactivity timer is 100 second and has a range of 10 to 100 seconds.
The responding node is limited to a fixed number of SLM tests per platform. Any test that attempts to involve a node that is already actively processing more than the system limit of the SLM tests shows up as ‟out loss” or ‟unacknowledged” packets on the node that instantiated the test because the packets are silently discarded at the responder. It is important for the operator to understand this is silent and no log entries or alarms is raised. It is also important to keep in mind that these packets are ETH-CFM based and the different platforms stated receive rate for ETH-CFM must not be exceeded. ETH-SL provides a mechanism for operators to pro-actively trend packet loss for service based MEPs.
Configuration example
The following figure shows the configuration required for proactive SLM test using SAA.
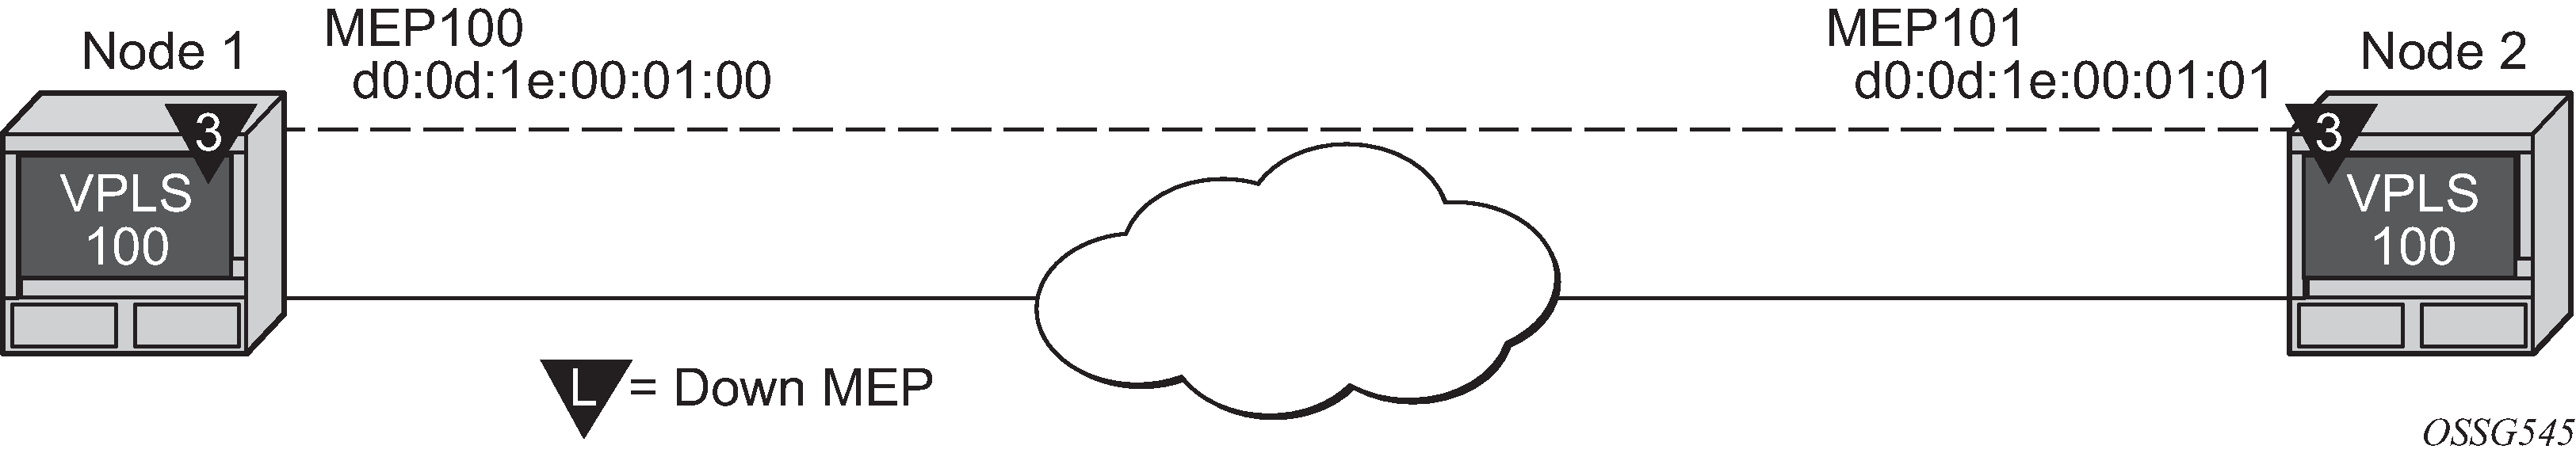
The output from the MIB is shown as follows as an example of an on-demand test. Node 1 is tested for this example. The SAA configuration does not include the accounting policy required to collect the statistics before they are overwritten. NODE2 does not have an SAA configuration. NODE2 includes the configuration to build the MEP in the VPLS service context.
config>eth-cfm# info
----------------------------------------------
     domain 3 format none level 3
          association 1 format icc-based name "03-0000000100"
               bridge-identifier 100
               exit
               ccm-interval 1
               remote-mepid 101
          exit
     exit
----------------------------------------------
*A:7210SAS>config>service>vpls# info
----------------------------------------------
stp
shutdown
exit
sap 1/1/3:100.100 create
exit
sap lag-1:100.100 create
eth-cfm
mep 100 domain 3 association 1 direction down
ccm-enable
mac-address d0:0d:1e:00:01:00
no shutdown
exit
exit
exit
no shutdown
----------------------------------------------
*A:7210SAS>config>service>vpls

*A:7210SAS>config>saa# info detail
----------------------------------------------
        test "SLM" owner "TiMOS CLI"
            no description
            type
                eth-cfm-two-way-
slm 00:01:22:22:33:34 mep 1 domain 1 association 1 size 0 fc "nc" count 100 timeout
1 interval 1
            exit
            trap-gen
                no probe-fail-enable
                probe-fail-threshold 1
                no test-completion-enable
                no test-fail-enable
                test-fail-threshold 1
exit
continuous
no shutdown
exit
----------------------------------------------
*A:7210SAS>config>saa#

*A:7210SAS# show saa SLM42

===============================================================================
SAA Test Information
===============================================================================
Test name                    : SLM42
Owner name                   : TiMOS CLI
Description                  : N/A
Accounting policy            : None
Continuous                   : Yes
Administrative status        : Enabled
Test type                    : eth-cfm-two-way-slm 00:25:ba:02:a6:50 mep 4
                               domain 1 association 1 fc "h1" count 100
                               timeout 1 interval 1
Trap generation              : None
Test runs since last clear   : 117
Number of failed test runs   : 1
Last test result             : Success
-------------------------------------------------------------------------------
Threshold
Type        Direction Threshold  Value      Last Event          Run #
-------------------------------------------------------------------------------
Jitter-in   Rising    None       None       Never               None
            Falling   None       None       Never               None
Jitter-out  Rising    None       None       Never               None
            Falling   None       None       Never               None
Jitter-rt   Rising    None       None       Never               None
            Falling   None       None       Never               None
Latency-in  Rising    None       None       Never               None
            Falling   None       None       Never               None
Latency-out Rising    None       None       Never               None
            Falling   None       None       Never               None
Latency-rt  Rising    None       None       Never               None
            Falling   None       None       Never               None
Loss-in     Rising    None       None       Never               None
            Falling   None       None       Never               None
Loss-out    Rising    None       None       Never               None
            Falling   None       None       Never               None
Loss-rt     Rising    None       None       Never               None
            Falling   None       None       Never               None

===============================================================================
Test Run: 116
Total number of attempts: 100
Number of requests that failed to be sent out: 0
Number of responses that were received: 100
Number of requests that did not receive any response: 0
Total number of failures: 0, Percentage: 0
 (in ms)            Min          Max      Average       Jitter
Outbound  :         8.07         8.18         8.10        0.014
Inbound   :        -7.84        -5.46        -7.77        0.016
Roundtrip :        0.245         2.65        0.334        0.025
Per test packet:
  Sequence     Outbound      Inbound    RoundTrip Result
         1         8.12        -7.82        0.306 Response Received
         2         8.09        -7.81        0.272 Response Received
         3         8.08        -7.81        0.266 Response Received
         4         8.09        -7.82        0.270 Response Received
         5         8.10        -7.82        0.286 Response Received
         6         8.09        -7.81        0.275 Response Received
         7         8.09        -7.81        0.271 Response Received
         8         8.09        -7.82        0.277 Response Received
         9         8.11        -7.81        0.293 Response Received
        10         8.10        -7.82        0.280 Response Received
        11         8.11        -7.82        0.293 Response Received
        12         8.10        -7.82        0.287 Response Received
        13         8.10        -7.82        0.286 Response Received
        14         8.09        -7.82        0.276 Response Received
        15         8.10        -7.82        0.284 Response Received
        16         8.09        -7.82        0.271 Response Received
        17         8.11        -7.81        0.292 Response Received
===============================================================================
#oam eth-cfm two-way-slm-test 00:25:ba:04:39:0c mep 4 domain 1 association 1 send-
count
10 interval 1 timeout 1
Sending 10 packets to 00:25:ba:04:39:0c from MEP 4/1/1 (Test-id: 143
Sent 10 packets, 10 packets received from MEP ID 3, (Test-id: 143)
(0 out-loss, 0 in-loss, 0 unacknowledged)

*A:7210SAS>show# eth-cfm mep 4 domain 1 association 1 two-way-slm-test

===============================================================================
Eth CFM Two-way SLM Test Result Table (Test-id: 143)
===============================================================================
Peer Mac Addr      Remote MEP       Count     In Loss    Out Loss         Unack
-------------------------------------------------------------------------------
00:25:ba:04:39:0c           3          10           0           0            0
===============================================================================
*A:7210SAS>show#
ETH-CFM QoS considerations
UP MEPs and DOWN MEPs have been aligned as of this release to better emulate service data. When an UP MEP or DOWN MEP is the source of the ETH-CFM PDU the priority value configured, as part of the configuration of the MEP or specific test, will be treated as the Forwarding Class (FC) by the egress QoS policy. If there is no egress QoS policy the priority value will be mapped to the CoS values in the frame. However, egress QoS Policy may overwrite this original value. The Service Assurance Agent (SAA) uses fc fc-name to accomplish similar functionality.
UP MEPs and DOWN MEPs terminating an ETH-CFM PDU will use the received FC as the return priority for the appropriate response, again feeding into the egress QoS policy as the FC.
ETH-CFM PDUs received on the MPLS-SDP bindings will now correctly pass the EXP bit values to the ETH-CFM application to be used in the response.
These are default behavioral changes without CLI options.
ETH-CFM configuration guidelines
The following lists ETH-CFM configuration guidelines:
-
Up MEPs and bidirectional MIPs are not created by default on system bootup, and additional resources must be allocated to enable Up MEP and bidirectional MIP functionality. By default, no resources are allocated. Before Up MEPs and bidirectional MIPs can be created, the user must first use the configure>system>resource-profile context to explicitly allocate hardware resources for use with these features. The software will reject the configuration to create an Up MEP or bidirectional MIP and generate an error until resources are allocated. See the 7210 SAS-Mxp, R6, R12, S, Sx, T Basic System Configuration Guide for more information.
-
7210 SAS platforms support functionality for ingress and egress MIPs. In most services, only ingress MIPs are supported. Some services also support both ingress and egress MIPs, also called bidirectional MIPs. An ingress MIP or a Down MIP processes messages in the ingress direction when the OAM message is received on ingress of the SAP or port (subject to other checks). An egress MIP or an UP MIP refers to a MIP that processes messages in the egress direction when the OAM message is being sent out of the SAP/port. See ETH-CFM support matrix for the 7210 SAS-T (network mode), ETH-CFM support matrix for the 7210 SAS-T (access-uplink mode), ETH-CFM support matrix for 7210 SAS-Mxp devices, ETH-CFM support matrix for 7210 SAS-R6 and 7210 SAS-R12 devices, ETH-CFM support matrix for 7210 SAS-Sx/S 1/10GE devices, and ETH-CFM support matrix for 7210 SAS-Sx 10/100GE devices for more information about ingress MIP, egress MIP, and bidirectional MIP support for service entities.
-
On 7210 SAS platforms, Ethernet Linktrace Response (ETH-LTR) is always sent out with priority 7.
-
7210 SAS platforms, send out all CFM packets as in-profile. Currently, there is no mechanism in the SAA tools to specify the profile of the packet.
-
On the 7210 SAS-R6 and 7210 SAS-R12, and on the 7210 SAS-Sx/S 1/10GE operating in the standalone-VC mode, before configuring bidirectional MIPs for an Epipe SAP or Epipe SDP binding, resources must be allocated to both Down MEPs and Up MEPs. That is, bidirectional MIPs in an Epipe service use the resources from both the Down MEP and Up MEP resource pools. By default, no resources are allocated for bidirectional MIPs, and configuration attempts before resource allocation are not permitted by the system and will generate a system error/log. See the 7210 SAS-Mxp, R6, R12, S, Sx, T Basic System Configuration Guide for more information.
-
Sender ID TLV processing (insertion and reception) is not supported for CCM messages for MEPs that are implemented in hardware; that is, on 7210 SAS-T Down MEPs in access-uplink mode. For these MEPs, Sender ID TLV processing is supported only for LTM and LBM messages.
-
Sender ID TLV processing is supported only for service MEPs. It is not supported for G.8032 MEPs.
-
Facility MEPs are not supported on the 7210 SAS. G8032 MEPs are supported on the 7210 SAS.
-
Ethernet rings are not configurable under all service types. Any service restrictions for MEP direction or MIP support will override the generic capability of the Ethernet ring MPs. See the 7210 SAS-Mxp, R6, R12, S, Sx, T Interface Configuration Guide for more information about Ethernet rings.
-
On 7210 SAS devices, when two bidirectional MIPs are configured in an Epipe service on both the service entities and endpoints (for example, on both the SAP and SDP configured in the Epipe service), only the MIP ingressing in the direction of linktrace messages responds. This is applicable to 7210 SAS platforms that support both ingress and egress MIPs (also referred to as bidirectional MIPs).
OAM mapping
OAM mapping is a mechanism that enables a way of deploying OAM end-to-end in a network where different OAM tools are used in different segments. For instance, an Epipe service could span across the network using Ethernet access (CFM used for OAM), pseudowire (T-LDP status signaling used for OAM), and Ethernet access (CFM used for OAM).
In the 7210 SAS implementation, the Service Manager (SMGR) is used as the central point of OAM mapping. It receives and processes the events from different OAM components, then decides the actions to take, including triggering OAM events to remote peers.
Fault propagation for CFM is by default disabled at the MEP level to maintain backward compatibility. When required, it can be explicitly enabled by configuration.
Fault propagation for a MEP can only be enabled when the MA is composed of no more than two MEPs (point-to-point).
CFM connectivity fault conditions
CFM MEP declares a connectivity fault when its defect flag is equal to or higher than its configured lowest defect priority. The defect can be any of the following depending on configuration:
DefRDICCM
DefMACstatus
DefRemoteCCM
DefErrorCCM
DefXconCCM
The following additional fault condition applies to Y.1731 MEPs:
reception of AIS for the local MEP level
Setting the lowest defect priority to allDef may cause problems when fault propagation is enabled in the MEP. In this scenario, when MEP A sends CCM to MEP B with interface status down, MEP B will respond with a CCM with RDI set. If MEP A is configured to accept RDI as a fault, then it gets into a dead lock state, where both MEPs will declare fault and never be able to recover.
The default lowest defect priority is DefMACstatus, which will not be a problem when interface status TLV is used. It is also very important that different Ethernet OAM strategies should not overlap the span of each other. In some cases, independent functions attempting to perform their normal fault handling can negatively impact the other. This interaction can lead to fault propagation in the direction toward the original fault, a false positive, or worse, a deadlock condition that may require the operator to modify the configuration to escape the condition. For example, overlapping Link Loss Forwarding (LLF) and ETH-CFM fault propagation could cause these issues.
For the DefRemoteCCM fault, it is raised when any remote MEP is down. So whenever a remote MEP fails and fault propagation is enabled, a fault is propagated to SMGR.
CFM fault propagation methods
When CFM is the OAM module at the other end, it is required to use any of the following methods (depending on local configuration) to notify the remote peer:
Generating AIS for certain MEP levels
Sending CCM with interface status TLV ‟down”
Stopping CCM transmission
7210 platforms expect that the fault notified using interface status TLV, is cleared explicitly by the remote MEP when the fault is no longer present on the remote node. On the 7210 SAS, use of CCM with interface status TLV Down is not recommended to be configured with a Down MEP, unless it is known that the remote MEP clears the fault explicitly.
User can configure UP MEPs to use Interface Status TLV with fault propagation. Special considerations apply only to Down MEPs.
When a fault is propagated by the service manager, if AIS is enabled on the SAP/SDP-binding, then AIS messages are generated for all the MEPs configured on the SAP/SDP-binding using the configured levels.
Note that the existing AIS procedure still applies even when fault propagation is disabled for the service or the MEP. For example, when a MEP loses connectivity to a configured remote MEP, it generates AIS if it is enabled. The new procedure that is defined in this document introduces a new fault condition for AIS generation, fault propagated from SMGR, that is used when fault propagation is enabled for the service and the MEP.
The transmission of CCM with interface status TLV must be done instantly without waiting for the next CCM transmit interval. This rule applies to CFM fault notification for all services.
Notifications from SMGR to the CFM MEPs for fault propagation should include a direction for the propagation (up or down: up means in the direction of coming into the SAP/SDP-binding; down means in the direction of going out of the SAP/SDP-binding), so that the MEP knows what method to use. For instance, an up fault propagation notification to a down MEP will trigger an AIS, while a down fault propagation to the same MEP can trigger a CCM with interface TLV with status down.
For a specific SAP/SDP-binding, CFM and SMGR can only propagate one single fault to each other for each direction (up or down).
When there are multiple MEPs (at different levels) on a single SAP/SDP-binding, the fault reported from CFM to SMGR will be the logical OR of results from all MEPs. Basically, the first fault from any MEP will be reported, and the fault will not be cleared as long as there is a fault in any local MEP on the SAP/SDP-binding.
Epipe services
Down and up MEPs are supported for Epipe services, as well as fault propagation. When there are both up and down MEPs configured in the same SAP/SDP-binding and both MEPs have fault propagation enabled, a fault detected by one of them will be propagated to the other, which in turn will propagate fault in its own direction.
CFM detected fault
When a MEP detects a fault and fault propagation is enabled for the MEP, CFM needs to communicate the fault to SMGR, so SMGR will mark the SAP/SDP-binding faulty but still oper-up. CFM traffic can still be transmitted to or received from the SAP/SDP-binding to ensure when the fault is cleared, the SAP will go back to normal operational state. Because the operational status of the SAP/SDP-binding is not affected by the fault, no fault handling is performed. For example, applications relying on the operational status are not affected.
If the MEP is an up MEP, the fault is propagated to the OAM components on the same SAP/SDP-binding; if the MEP is a down MEP, the fault is propagated to the OAM components on the mate SAP/SDP-binding at the other side of the service.
SAP/SDP-binding failure (including pseudowire status)
When a SAP/SDP-binding becomes faulty (oper-down, admin-down, or pseudowire status faulty), SMGR needs to propagate the fault to up MEPs on the same SAP/SDP-bindings about the fault, as well as to OAM components (such as down MEPs) on the mate SAP/SDP-binding.
Service down
This section describes procedures for the scenario where an Epipe service is down because of the following:
Service is administratively shutdown. When service is administratively shutdown, the fault is propagated to the SAP/SDP-bindings in the service.
If the Epipe service is used as a PBB tunnel into a B-VPLS, the Epipe service is also considered operationally down when the B-VPLS service is administratively shutdown or operationally down. If this is the case, fault is propagated to the Epipe SAP.
In addition, one or more SAPs/SDP-bindings in the B-VPLS can be configured to propagate fault to this Epipe (see the following fault-propagation-bmac). If the B-VPLS is operationally up but all of these entities have detected fault or are down, the fault is propagated to this Epipe’s SAP.
Interaction with pseudowire redundancy
When a fault occurs on the SAP side, the pseudowire status bit is set for both active and standby pseudowires. When only one of the pseudowire is faulty, SMGR does not notify CFM. The notification occurs only when both pseudowire becomes faulty. The SMGR propagates the fault to CFM.
Because there is no fault handling in the pipe service, any CFM fault detected on an SDP binding is not used in the pseudowire redundancy’s algorithm to choose the most suitable SDP binding to transmit on.
LLF and CFM fault propagation
LLF and CFM fault propagation are mutually exclusive. CLI protection is in place to prevent enabling both LLF and CFM fault propagation in the same service, on the same node and at the same time. However, there are still instances where irresolvable fault loops can occur when the two schemes are deployed within the same service on different nodes. This is not preventable by the CLI. At no time should these two fault propagation schemes be enabled within the same service.
802.3ah EFM OAM mapping and interaction with service manager
802.3ah EFM OAM declares a link fault when any of the following occurs:
loss of OAMPDU for a certain period of time
receiving OAMPDU with link fault flags from the peer
When 802.3ah EFM OAM declares a fault, the port goes into operation state down. The SMGR communicates the fault to CFM MEPs in the service. OAM fault propagation in the opposite direction (SMGR to EFM OAM) is not supported.
Fault propagation to access dot1q/QinQ ports on the 7210 SAS-T in access-uplink mode
A fault on the access-uplink port brings down all access ports with services independent of the encapsulation type of the access port (null, dot1q, or QinQ), that is, support Link Loss Forwarding (LLF). A fault propagated from the access-uplink port to access ports is based on configuration. A fault is propagated only in a single direction from the access-uplink port to access port.
A fault on the access-uplink port is detected using Loss of Signal (LoS) and EFM-OAM.
The following figure shows local fault propagation.
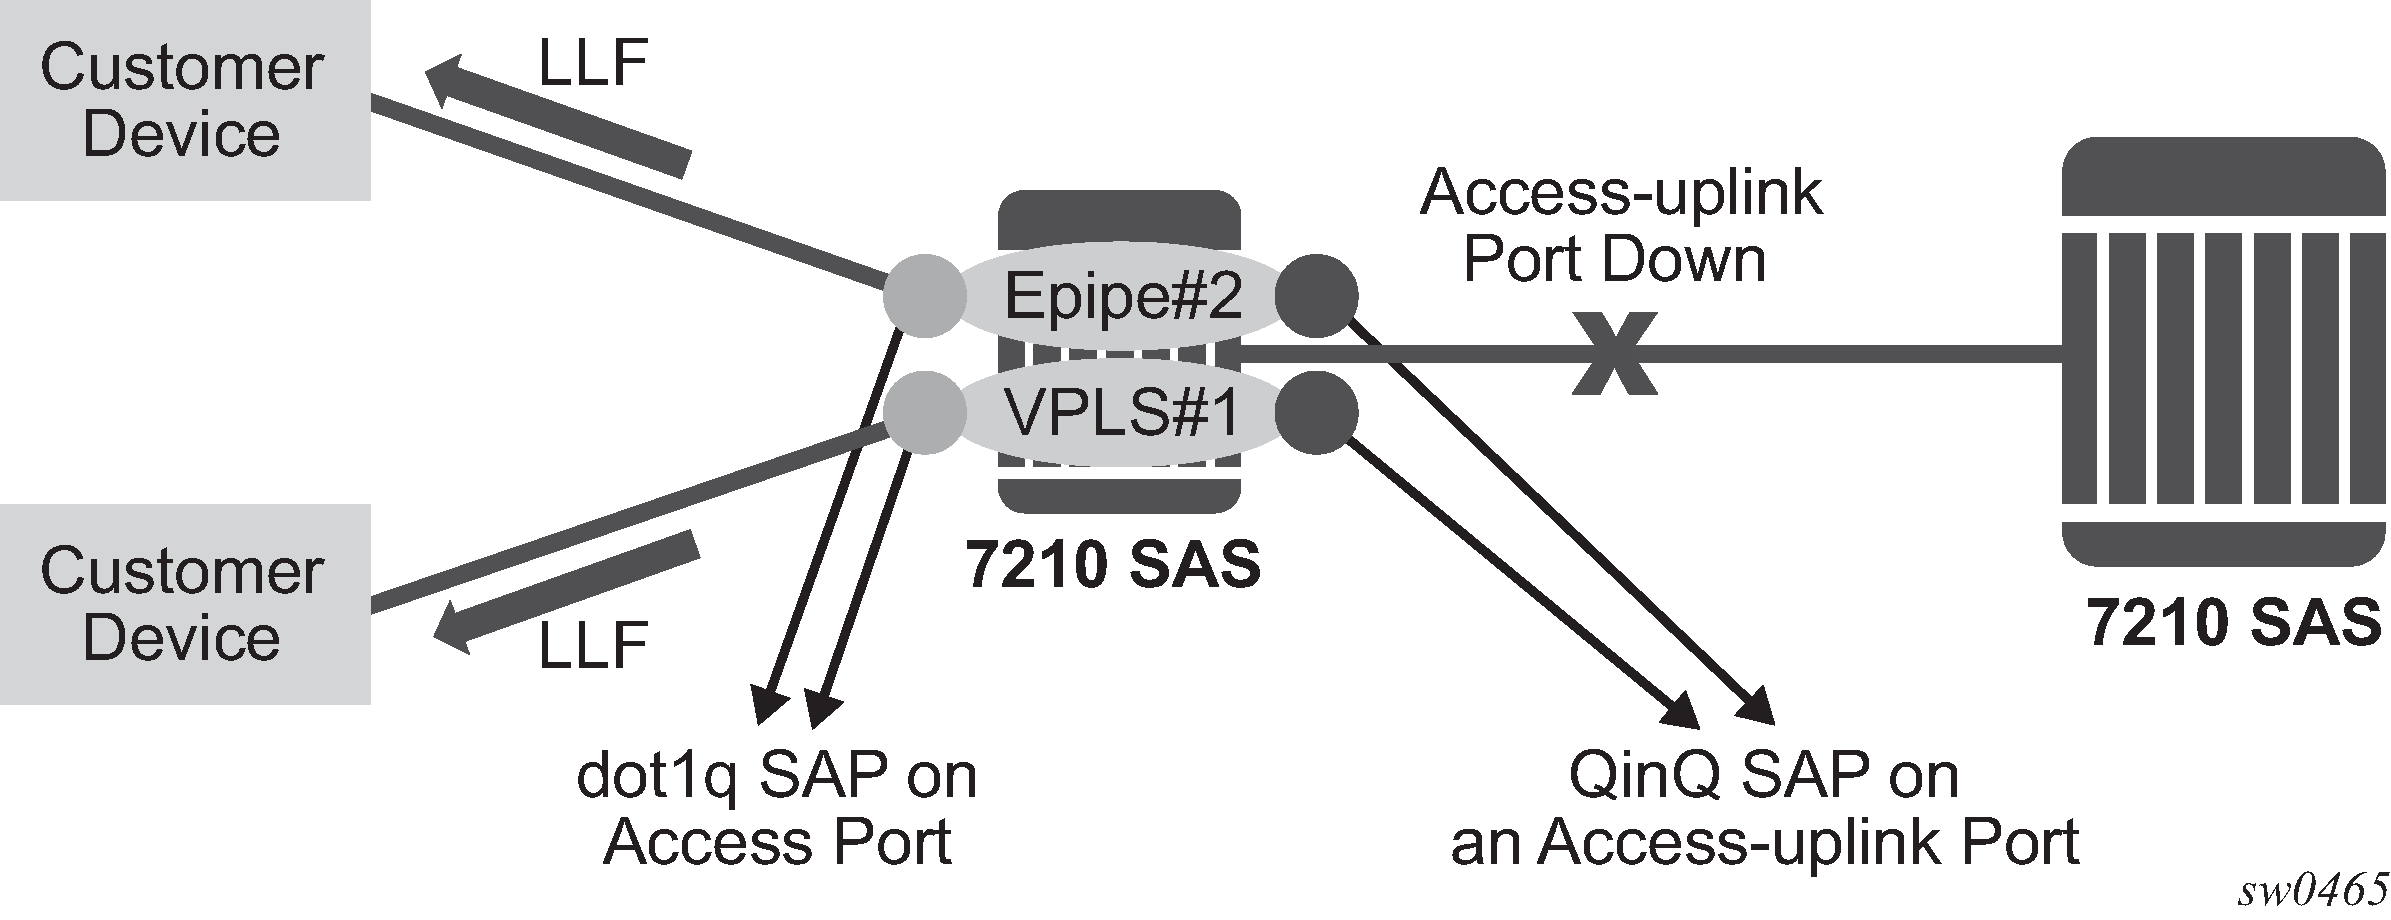
Configuring fault propagation
The operational group functionality, also referred to as oper-group, is used to detect faults on access-uplink ports and propagate them to all interested access ports regardless of their encapsulation. On the 7210 SAS operating in access-uplink mode, ports can be associated with oper-groups. Perform the following procedure to configure the use of the oper-group functionality for fault detection on a port and monitor-oper-group to track the oper-group status and propagate the fault based on the operational state of the oper-group.
Create an oper-group (for example, ‟uplink-to-7210”).
Configure an access-uplink port to track its operational state (for example, 1/1/20) and associate it with the oper-group created in step 1 (that is, uplink-to-7210).
Configure dot1q access ports for which the operational state must be driven by the operational state of the access-uplink port (for example, 1/1/1 and 1/1/5) as the monitor-oper-group.
To detect a fault on the access-uplink port and change the operational state, use either the LoS or EFM OAM feature.
When the operational state of the access-uplink port changes from up to down, the state of all access ports configured to monitor the group changes to down. Similarly, a change in state from down to up changes the operational state of the access port to up. When the operational state of the access port is brought down, the laser of the port is also shut down. The hold-timers command is supported to avoid the flapping of links.
Configuration example for fault propagation using oper-group
oper-group system configuration output
*A:7210SAS>config>system>oper-group# info detail
----------------------------------------------
            hold-time
                group-down 0
                group-up 4
            exit
----------------------------------------------
*A:7210SAS>config>system>oper-group#
See the 7210 SAS-Mxp, R6, R12, S, Sx, T Basic System Configuration Guide for more information about this CLI.
Fault propagation to access dot1q/QinQ ports on the 7210 SAS-Sx/S 1/10GE and 7210 SAS-Sx 10/100GE in standalone mode
An uplink port refers to an access port or LAG or hybrid port or LAG that is facing the network core.
A fault on the uplink port or LAG brings down all access ports with services independent of the encapsulation type of the access port (null, dot1q, or QinQ), that is, support Link Loss Forwarding (LLF). A fault propagated from the uplink port or LAG to access ports is based on configuration. A fault is propagated only in a single direction from the uplink port or LAG to access port.
A fault on the uplink port or LAG is detected using Loss of Signal (LoS) and EFM-OAM.
The following figure show local fault propagation.
Configuring fault propagation
The oper-group functionality is used to detect faults on uplink ports or LAGs and propagate them to all interested access ports regardless of their encapsulation. On the 7210 SAS, ports or LAGs can be associated with oper-groups. Perform the following procedure to configure the use of the oper-group functionality for fault detection on a port or LAG and monitor-oper-group to track the oper-group status and propagate the fault based on the operational state of the oper-group:
Create an oper-group (for example, ‟uplink-to-7210”).
Configure an uplink port or LAG to track its operational state (for example, 1/1/20) and associate it with the oper-group created in1 (that is, uplink-to-7210).
Configure dot1q access ports for which the operational state must be driven by the operational state of the uplink port or LAG (for example, 1/1/1 and 1/1/5) as the monitor-oper-group.
To detect a fault on the uplink port or LAG and change the operational state, use either the LoS or EFM OAM feature.
When the operational state of the uplink port or LAG changes from up to down, the state of all access ports configured to monitor the group changes to down. Similarly, a change in state from down to up changes the operational state of the access port to up. When the operational state of the access port is brought down, the laser of the port is also shut down. The hold-timers command is supported to avoid the flapping of links.
Configuration example for fault propagation using oper-group
oper-group system configuration output
*A:7210SAS>config>system>oper-group# info detail
----------------------------------------------
            hold-time
                group-down 0
                group-up 4
            exit
----------------------------------------------
*A:7210SAS>config>system>oper-group#
See the 7210 SAS-Mxp, R6, R12, S, Sx, T Basic System Configuration Guide for more information about this CLI.
Service Assurance Agent overview
In the last few years, service delivery to customers has drastically changed. Services such as VPLS and VPRN are offered. The introduction of Broadband Service Termination Architecture (BSTA) applications such as Voice over IP (VoIP), TV delivery, video and high speed Internet services force carriers to produce services where the health and quality of Service Level Agreement (SLA) commitments are verifiable to the customer and internally within the carrier.
SAA is a feature that monitors network operations using statistics such as jitter, latency, response time, and packet loss. The information can be used to troubleshoot network problems, problem prevention, and network topology planning.
The results are saved in SNMP tables are queried by either the CLI or a management system. Threshold monitors allow for both rising and falling threshold events to alert the provider if SLA performance statistics deviate from the required parameters.
SAA two-way timing
SAA allows two-way timing for several applications. This provides the carrier and their customers with data to verify that the SLA agreements are being correctly enforced.
Traceroute implementation
The 7210 SAS devices insert the timestamp in software (by control CPU).
When interpreting these timestamps care must be taken that some nodes are not capable of providing timestamps, therefore timestamps must be associated with the same IP address that is being returned to the originator to indicate what hop is being measured.
NTP
Because NTP precision can vary (+/- 1.5ms between nodes even under best case conditions), SAA one-way latency measurements may display negative values, especially when testing network segments with very low latencies. The one-way time measurement relies on the accuracy of NTP between the sending and responding nodes.
Writing SAA results to accounting files
SAA statistics enables writing statistics to an accounting file. When results are calculated an accounting record is generated.
To write the SAA results to an accounting file in a compressed XML format at the termination of every test, the results must be collected, and, in addition to creating the entry in the appropriate MIB table for this SAA test, a record must be generated in the appropriate accounting file.
Accounting file management
Because the SAA accounting files have a similar role to existing accounting files that are used for billing purposes, existing file management information is leveraged for these accounting (billing) files.
Assigning SAA to an accounting file ID
When an accounting file has been created, accounting information can be specified and will be collected by the config>log>acct-policy>to file log-file-id context.
Continuous testing
When you configure a test, use the config>saa>test>continuous command to make the test run continuously. Use the no continuous command to disable continuous testing and shutdown to disable the test completely. When you have configured a test as continuous, you cannot start or stop it by using the saa test-name [owner test-owner] {start | stop} [no-accounting] command.
Configuring SAA test parameters
The following is a sample SAA configuration output.
*A:Dut-A>config>saa# info
----------------------------------------------------------------------
....
        test "Dut-A:1413:1501" owner "TiMOS"
description "Dut-A:1413:1501"
            type
                vccv-ping 1413:1501 fc "nc" timeout 10 size 200 count 2
            exit
            loss-event rising-threshold 2
            latency-event rising-threshold 100
no jitter-event
            no shutdown
        exit
....
----------------------------------------------------------------------
*A:Dut-A#
Y.1564 testhead OAM tool
Port loopback with mac-swap and Y.1564 testhead is supported only for Epipe and VPLS services.
ITU-T Y.1564 defines the out-of-service test methodology to be used and parameters to be measured to test service SLA conformance during service turn up. It primarily defines 2 test phases. The first test phase defines service configuration test, which consists of validating whether the service is configured correctly. As part of this test the throughput, Frame Delay, Frame Delay Variation (FDV), and Frame Loss Ratio (FLR) is measured for each service. This test is typically run for a short duration. The second test phase consists of validating the quality of services delivered to the end customer and is referred to as the service performance test. These tests are typically run for a longer duration and all traffic is generated up to the configured CIR for all the services simultaneously and the service performance parameters are measured for each the service.
The 7210 SAS supports service configuration test for user configured rate and measurement of delay, delay variation and frame loss ratio with the testhead OAM tool. The 7210 SAS testhead OAM tool supports bidirectional measurement and it can generate test traffic for only one service at a specific time. It can validate if the user specified rate is available and compute the delay, delay variation and frame loss ratio for the service under test at the specified rate. It is capable of generating traffic up to 1G rate. On some 7210 SAS devices, the user needs to configure the resources of the front-panel port for use with this feature and some other 7210 SAS platforms resources needed for this feature is automatically allocated by software from the internal ports. For more information, see the following Configuration guidelines, to which 7210 SAS platforms need user configuration and on which 7210 SAS platforms software allocates it automatically.
The following figure shows the remote loopback required and the flow of the frame through the network generated by the testhead tool.
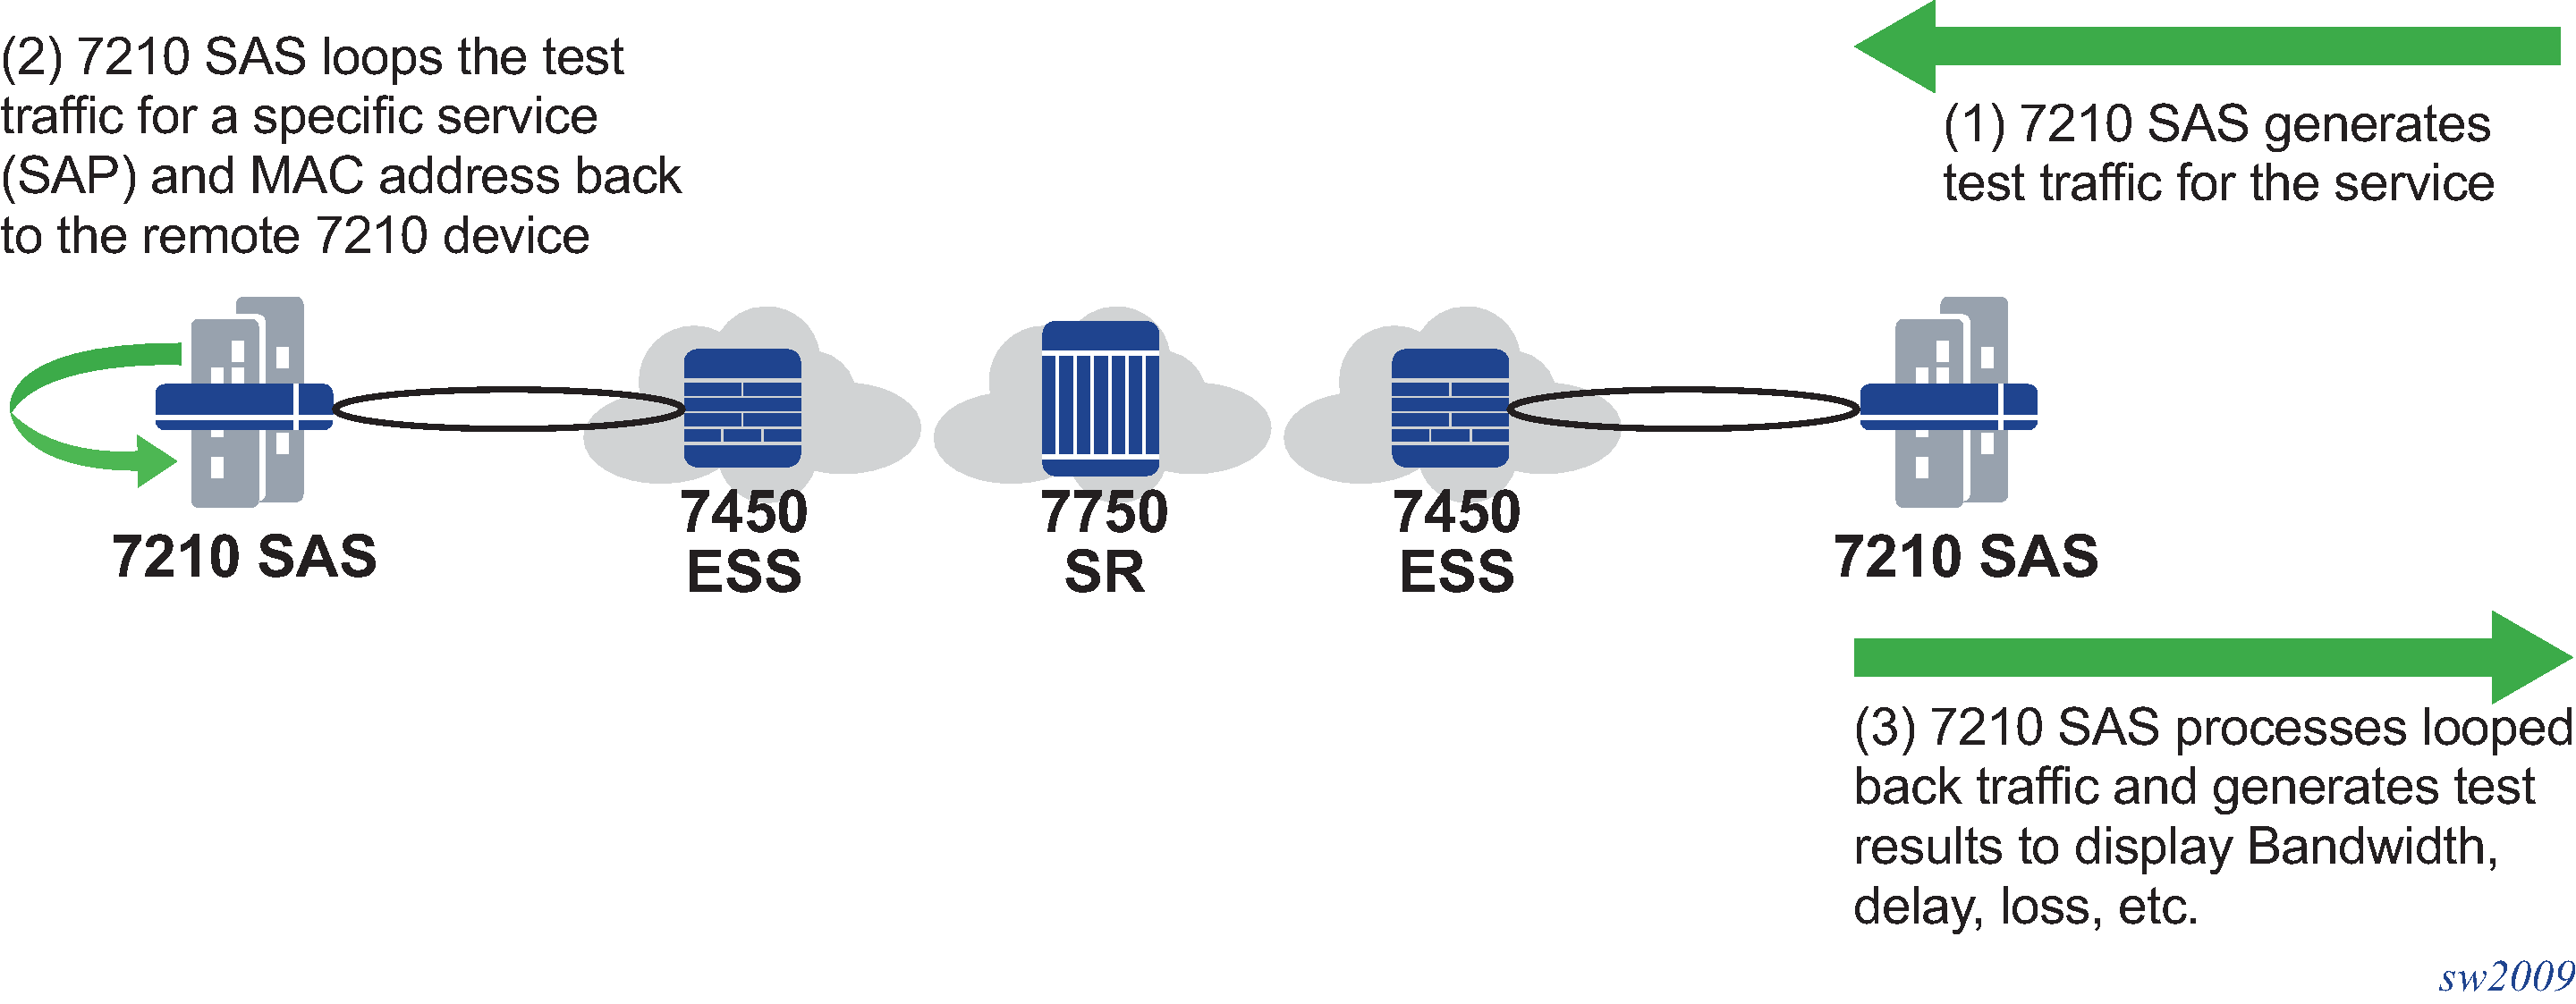
The tool allows the user to specify the frame payload header parameters independent of the test SAP configuration parameters to allow the user flexibility to test for different possible frame header encapsulations. This allows user to specify the appropriate VLAN tags, Ethertype, and Dot1p values, independent of the SAP configuration like with actual service testing. That is, the software does not use the parameters (For example: SAP ID, Source MAC, and Destination MAC) during the invocation of the testhead tool to build the test frames. Instead it uses the parameters specified using the frame-payload CLI command tree. The software does not verify that the parameters specified match the service configuration used for testing, for example, software does not match if the VLAN tags specified matches the SAP tags, the Ethertype specified matches the user configured port Ethertype, and so on. It is expected that the user configures the frame-payload appropriately so that the traffic matches the SAP configuration.
The 7210 SAS supports Y.1564 testhead for performing CIR or PIR tests in color-aware mode. With this functionality, users can perform service turn-up tests to validate the performance characteristics (delay, jitter, and loss) for committed rate (CIR) and excess rate above CIR (that is, PIR rate). The testhead OAM tool uses the in-profile packet marking value and out-of-profile packet marking value, to differentiate between committed traffic and PIR traffic in excess of CIR traffic. Traffic within CIR (that is, committed traffic) is expected to be treated as in-profile traffic in the network and traffic in excess of CIR (that is, PIR traffic) is expected to be treated as out-of-profile traffic in the network, allowing the network to prioritize committed traffic over PIR traffic. The testhead OAM tool allows the user to configure individual thresholds for green or in-profile packets and out-of-profile or yellow packets. It is used by the testhead OAM tool to compare the measured value for green or in-profile packets and out-of-profile or yellow packets against the configured thresholds and report success or failure.
The functionality listed as follows is supported by the testhead OAM tool:
Supports configuration of only access SAPs as the test measurement point.
Supports all port encapsulation supported on all service SAP types, with some exceptions as noted in the following Configuration guidelines.
Supported for only VPLS and Epipe service.
Supports two-way measurement of service performance metrics. The tests measure throughput, frame delay, frame delay variation, and frame loss ratio.
For two-way measurement of the service performance metrics, such as frame delay and frame delay variation, test frames (also called as marker packets) are injected at a low rate at periodic intervals. Frame delay and Frame delay variation is computed for these frames. Hardware-based timestamps are used for delay computation.
The 7210 SAS supports configuration of a rate value and provides an option to measure the performance metrics. The testhead OAM tool generates traffic up to the specified rate and measures service performance metrics such as delay, jitter, and loss for in-profile and out-of-profile traffic.
Testhead tool can generate traffic up to about 1G rate. CIR and PIR rate can be specified by the user and is rounded off the nearest rate the hardware supports by using the adaptation rule configured by the user.
Allows the user to specify the different frame-sizes from 64 bytes - 9212 bytes.
User can configure the following frame payload types: L2 payload, IP payload, and IP/TCP/UDP payload. Testhead tool will use the configured values for the IP header fields and TCP header fields based on the payload type configured. User is provided with an option to specify the data pattern to used in the payload field of the frame/packet.
Allows the user to configure the duration of the test up to a maximum of 24 hours, 60 minutes, and 60 seconds. The test performance measurements by are done after the specified rate is achieved. At any time user can probe the system to know the current status and progress of the test.
Supports configuration of the Forwarding Class (FC). It is expected that user will define consistent QoS classification policies to map the packet header fields to the FC specified on the test SAP ingress on the local node, in the network on the nodes through which the service transits, and on the SAP ingress in the remote node.
Allows the user to configure a test-profile, also known as, a policy template that defines the test configuration parameters. User can start a test using a preconfigured test policy for a specific SAP and service. The test profile allows the user to configure the acceptance criteria. The acceptance criteria allows user to configure the thresholds that indicates the acceptable range for the service performance metrics. An event is generated if the test results exceed the configured thresholds. For more information, see the following CLI section.
At the end of the test, the measured values for FD, FDV, and FLR are compared against the configured thresholds to determine the PASS or FAIL criteria and to generate a trap to the management station. If the acceptance criteria is not configured, the test result is declared to be PASS, if the throughput is achieved and frame-loss is 0 (zero).
ITU-T Y.1564 specifies different test procedures as follows. CIR and PIR configuration tests are supported by the testhead tool, as follows:
CIR and PIR configuration test (color-aware and non-color aware).
Traffic policing test (color-aware and non-color aware) is supported. Traffic policing tests can be executed by the user by specifying a PIR to be 125% of the desired PIR. Traffic policing test can be executed in either color-aware mode or color-blind (non-color-aware) mode.
ITU-T Y.1564 specifies separate test methodology for color-aware and non-color-aware tests. The standard requires a single test to provide the capability to generate both green-color/in-profile traffic for rates within CIR and yellow-color or out-of-profile traffic for rates above CIR and within EIR. The 7210 SAS testhead marks test packets appropriately when generating the traffic, as SAP ingress does not support color-aware metering, it is not possible to support EIR color-aware, and traffic policing color-aware tests end-to-end in a network (that is, from test SAP to test SAP). Instead, It is possible to use the tests to measure the performance parameters from the other endpoint (example Access-uplink SAP) in the service, through the network, to the remote test SAP, and back again to the local test SAP.
The 7210 SAS Y.1564 testhead is applicable only for VPLS and Epipe services.
Prerequisites for using the testhead tool
This section describes the prerequisites for using the testhead tool.
Generic prerequisites for use of testhead tool (applicable for all 7210 SAS platforms)
The following describes the generic prerequisites for the use of the Testhead tool:
It is expected that the user will configure the appropriate ACL and QoS policies to ensure that the testhead traffic is processed as desired by the local and remote node/SAP. In particular, QoS policies in use must ensure that the rate in use for the SAP ingress meters exceed or are equal to the user configured rate for testhead tests and the classification policies map the testhead packets to the appropriate FCs/queues (the FC classification must match the FC specified in the CLI command testhead-test) using the packet header fields configured in the frame-payload. Similarly, ACL policies must ensure that testhead traffic is not blocked.
The testhead OAM tool does not check the state of the service or the SAPs on the local endpoint before initiating the tests. The operator must ensure that the service and SAPs used for the test are UP before the tests are started. If they are not, the testhead tool will report a failure.
The port configuration of the ports used for validation (for example, access port on which the test SAP is configured and access-uplink port) must not be modified after the testhead tool is invoked. Any modifications can be made only when the testhead tool is not running.
Testhead tool can be used to test only unicast traffic flows. It must not be used to test BUM traffic flows.
Only out-of-service performance metrics can be measured using the testhead OAM tool. For in-service performance metrics, user has the option to use SAA based Y.1731/CFM tools.
The following describes some prerequisites to use the testhead tool:
The configuration guidelines and prerequisites that are to be followed when the port loopback with MAC swap feature is used standalone, applies to its use along with the testhead tool. For more information, see the description in the 7210 SAS-Mxp, R6, R12, S, Sx, T Interface Configuration Guide.
Users must configure resources for ACL MAC criteria in ingress-internal-tcam using the command config>system>resource-profile>ingress-internal-tcam>cl-sap-ingress>mac-match-enable. Additionally users must allocate resources to egress ACL MAC or IPv4 or IPv6 64-bit criteria using the command config>system>resource-profile>egress-internal-tcam>acl-sap-egress>mac-ipv4-match-enable or mac-ipv6-64bit-enable or mac-ipv4-match-enable). The testhead tool uses resources from these resource pools. If no resources are allocated to these pools or no resources are available for use in these pools, then the testhead fails to function. Testhead needs a minimum of about 6 entries from the ingress internal TCAM pool and 2 entries from the egress internal TCAM pool. If users allocate resources to egress ACLs IPv6 128-bit match criteria (using the command config> system> resource-profile> egress-internal-tcam>acl-sap-egress> ipv6-128bit-match-enable), then the testhead tool fails to function.
For both Epipe and VPLS service, the test can be used to perform only a point-to-point test between the specific source and destination MAC address. Port loopback MAC swap functionality must be used for both Epipe and VPLS services. The configured source and destination MAC address is associated with the two SAPs configured in the service and used as the two endpoints. That is, the user configured source MAC and destination MAC addresses are used by the testhead tool on the local node to identify the packets as belonging to testhead application and are processed appropriately at the local end and at the remote end these packets are processed by the port loopback with mac-swap application.
Configure the MACs (source and destination) statically for VPLS service.
Port loopback must be in use on both the endpoints (that is, the local node, the port on which the test SAP is configured and the remote node, the port on which the remote SAP is configured for both Epipe and VPLS services. Port loopback with mac-swap must be setup by the user on both the local end and the remote end before invoking the testhead tool. These must match appropriately for traffic to flow, else there will be no traffic flow and the testhead tool reports a failure at the end of the completion of the test run.
Additionally, port loopback with mac-swap must be used at both the ends and if any services/SAPs are configured on the test port, they need to be shutdown to avoid packets being dropped on the non-test SAP. The frames generated by the testhead tool will egress the access SAP and ingress back on the same port, using the resources of the 2 internal loopback ports (one for testhead and another for mac-swap functionality), before being sent out to the network side (typically an access-uplink SAP) to the remote end”. At the remote end, it is expected that the frames will egress the SAP under test and ingress back in again through the same port, going through another loopback (with mac-swap) before being sent back to the local node where the testhead application is running.
The FC specified is used to determine the queue to enqueue the marker packets generated by testhead application on the egress of the test SAP on the local node.
The use of port loopback is service affecting. It affects all the services configured on the port. It is not recommended to use a SAP, if the port on which they are configured, is used to transport the service packets toward the core. As, a port loopback is required for the testhead to function correctly, doing so might result in loss of connectivity to the node when in-band management is in use. Additionally, all services being transported to the core will be affected.
It also affects service being delivered on that SAP. Only out-of-service performance metrics can be measured using testhead OAM tool. For in-service performance metrics, user has the option to use SAA based Y.1731/CFM tools.
Testhead tool uses marker packets with special header values. The QoS policies and ACL policies need to ensure that same treatment as accorded to testhead traffic is given to marker packets. Marker packets are IPv4 packet with IP option set and IP protocol set to 252. It uses the source and destination MAC addresses, Dot1p, IP ToS, IP DSCP, IP TTL, IP source address and destination address as configured in the frame-payload. It does not use the IP protocol and TCP/UDP port numbers from the frame-payload configured. If the payload-type is ‟l2”, IP addresses are set to 0.0.0.0, IP TTL is set to 0, IP TOS is set to 0 and DSCP is set to be, if these values are not explicitly configured in the frame-payload. Ethertype configured in the frame-payload is not used for marker packets, it is always set to Ethertype = 0x0800 (Ethertype for IPv4) as marker packets are IPv4 packets.
QoS policies applied in the network needs to configured such that the classification for marker packets is similar to service packets. An easy way to do this is by using the header fields that are common across marker packets and service packets, such as MAC (src and dst) addresses, VLAN ID, Dot1p, IPv4 (source and destination) addresses, IP DSCP, and IP ToS. Use of other fields which are different for marker packets and service packets is not recommended. ACL policies in the network must ensure that marker packets are not dropped.
The mac-swap loopback port, the testhead loopback port and the uplink port must not be modified after the testhead tool is invoked. Any modifications can be made only when the testhead tool is not running.
Link-level protocols (For example: LLDP, EFM, and other protocols) must not be enabled on the port on which the test SAP is configured. In general, no other traffic must be sent out of the test SAP when the testhead tool is running.
The frame payload must be configured such that number of tags match the number of SAP tags. For example: For 0.* SAP, the frame payload must be untagged or priority tagged and it cannot contain another tag following the priority tag.
Configuration guidelines
This section provides the configuration guidelines for the testhead OAM tool. It is applicable to all the platforms described in this guide unless a specific platform is called out explicitly:
On the 7210 SAS-Sx 10/100GE platform, the following limitation must be addressed in the testhead configuration: the testhead loopback port and MAC swap loopback port must be configured with the same Ethernet speeds and have the same operational speeds. Failure to do so will cause the testhead session start to fail.
SAPs configured on LAG cannot be configured for testing with testhead tool. Other than the test SAP, other service endpoints (For example: SAPs/SDP-Bindings) configured in the service can be over a LAG.
The user needs to configure the resources of another port for use with the testhead OAM tool. The user can configure the resources of the internal virtual ports (if available) or configure the resources of a front-panel port for use with testhead OAM tool. Please see the CLI command config>system>loopback-no-svc-port in the 7210 SAS-Mxp, R6, R12, S, Sx, T Interface Configuration Guidefor more details. Interfaces to know if front-panel port resources are needed and use the command show>system>internal-loopback-ports [detail] to know if internal port resources are available in use by other applications. The port configured for testhead tool use cannot be shared with other applications that need the loopback port. The resources of the loopback port are used by the testhead tool for traffic generation.
Note:On 7210 SAS-R6 and 7210 SAS-R12, the ports allocated for testhead OAM tool, the MAC swap OAM tool and the test SAP must be on the same line card and cannot be on different line cards.
Port loopback with mac-swap is used at both ends and all services on the port on which the test SAP is configured and SAPs in the VPLS service, other than the test SAP should be shutdown or should not receive any traffic.
The configured CIR/PIR rate is rounded off to the nearest available hardware rates. User is provided with an option to select the adaptation rule to use (similar to support available for QoS policies).
The 7210 SAS supports all port speeds (that is, up to 1G rate). Users need to configure the appropriate loopback port to achieve a desired rate. For example, user must dedicate the resources of a 1G port, if intended to test rates to go up to 1G.
ITU-T Y.1564 recommends to provide an option to configure the CIR step-size and the step-duration for the service configuration tests. This is not supported directly in 7210 SAS. It can be achieved by SAM or a third-party NMS system or an application with configuration of the desired rate and duration to correspond to the CIR step-size and step duration and repeating the test a second time, with a different value of the rate (that is, CIR step size) and duration (that is, step duration) and so on.
Testhead waits for about 5 seconds at the end of the configured test duration before collecting statistics. This allows for all in-flight packets to be received by the node and accounted for in the test measurements. User cannot start another test during this period.
When using testhead to test bandwidth available between SAPs configured in a VPLS service, operators must ensure that no other SAPs in the VPLS service are exchanging any traffic, particularly BUM traffic and unicast traffic destined for either the local test SAP or the remote SAP. BUM traffic eats into the network resources which is also used by testhead traffic.
It is possible that test packets (both data and marker packets) remain in the loop created for testing when the tests are killed. This is highly probable when using QoS policies with very less shaper rates resulting in high latency for packets flowing through the network loop. User must remove the loop at both ends when the test is complete or when the test is stopped and wait for a suitable time before starting the next test for the same service, to ensure that packets drain out of the network for that service. If this is not done, then the subsequent tests may process and account these stale packets, resulting in incorrect results. Software cannot detect stale packets in the loop as it does not associate or check each and every packet with a test session
Traffic received from the remote node and looped back into the test port (where the test SAP is configured) on the local end (that is, the end where the testhead tool is invoked) is dropped by hardware after processing (and is not sent back to the remote end). The SAP ingress QoS policies and SAP ingress filter policies must match the packet header fields specified by the user in the testhead profile, except that the source/destination MAC addresses are swapped.
Latency is not be computed if marker packets are not received by the local node where the test is generated and printed as 0 (zero), in such cases. If jitter = 0 and latency > 0, it means that jitter calculated is less than the precision used for measurement. There is also a small chance that jitter was not actually calculated, that is, only one value of latency has been computed. This typically indicates a network issue, instead of a testhead issue.
When the throughput is not met, FLR cannot be calculated. If the measured throughput is approximately +/-10% of the user configured rate, FLR value is displayed; else software prints ‟Not Applicable”. The percentage of variance of measured bandwidth depends on the packet size in use and the configured rate.
Users must not use the CLI command to clear statistics of the test SAP port, testhead loopback port, or MAC swap loopback port when the testhead tool is running. The port statistics are used by the tool to determine the Tx/Rx frame count.
Testhead tool generates traffic at a rate slightly above the CIR. The additional bandwidth is attributable to the marker packets used for latency measurements. This is not expected to affect the latency measurement or the test results in a significant way.
If the operational throughput is 1kbps and it is achieved in the test loop, the throughput computed could still be printed as 0 if it is less than 1Kb/s (0.99 kb/s, for example). Under such cases, if FLR is PASS, the tool indicates that the throughput has been achieved.
The testhead tool displays a failure result if the received count of frames is less than the injected count of frames, even though the FLR may be displayed as 0. This happens because of truncation of FLR results to 6 decimal places and can happen when the loss is very less.
As the rate approaches 1Gbps or the maximum bandwidth achievable in the loop, user needs to account for the marker packet rate and the meter behavior while configuring the CIR rate. That is, if the user needs to test 1Gbps for 512 bytes frame size, then they will need to configure about 962396Kbps, instead of 962406Kbps, the maximum rate that can be achieved for this frame-size. In general, they would need to configure about 98%-99% (based on packet size) of the maximum possible rate to account for marker packets when they need to test at rates which are closer to bandwidth available in the network. The reason for this is that at the maximum rate, injection of marker packets by CPU will result in drops of either the injected data traffic or the marker packets themselves, as the net rate exceeds the capacity. These drops cause the testhead to always report a failure, unless the rate is marginally reduced.
The testhead uses the Layer 2 rate, which is calculated by subtracting the Layer 1 overhead that is caused when the IFG and Preamble are added to every Ethernet frame (typically about 20 bytes (IFG = 12 bytes and Preamble = 8 bytes)). The testhead tool uses the user-configured frame size to compute the Layer 2 rate and does not allow the user to configure a value greater than that rate. For 512-byte Ethernet frames, the L2 rate is 962406 Kb/s and the Layer 1 rate is 1 Gb/s.
It is not expected that the operator will use the testhead tool to measure the throughput or other performance parameters of the network during the course of network event. The network events could be affecting the other SAP/SDP-Binding/PW configured in the service. Examples are transition of a SAP because of G8032 ring failure, transition of active/ standby SDP-Binding/PW because of link or node failures.
The 2-way delay (also known as ‟latency”) values measured by the testhead tool is more accurate than obtained using OAM tools, as the timestamps are generated in hardware.
The 7210 SAS does not support color-aware metering on access SAP ingress, therefore, any color-aware packets generated by the testhead is ignored on access SAP ingress. 7210 SAS service access port, access-uplink port, or network port can mark the packets appropriately on egress to allow the subsequent nodes in the network to differentiate the in-profile and out-of-profile packets and provide them with appropriate QoS treatment. The 7210 SAS access-uplink ingress and network port ingress is capable of providing appropriate QoS treatment to in-profile and out-of-profile packets.
The marker packets are sent over and above the configured CIR or PIR rate, the tool cannot determine the number of green packets injected and the number of yellow packets injected individually. Therefore, marker packets are not accounted in the injected or received green or in-profile and yellow or out-of-profile packet counts. They are only accounted for the Total Injected and the Total Received counts. So, the FLR metric accounts for marker packet loss (if any), while green or yellow FLR metric does not account for any marker packet loss.
Marker packets are used to measure green or in-profile packets latency and jitter and the yellow or out-of-profile packets latency and jitter. These marker packets are identified as green or yellow based on the packet marking (Example: dot1p). The latency values can be different for green and yellow packets based on the treatment provided to the packets by the network QoS configuration.
The following table describes SAP encapsulation supported by the testhead tool.
Table 9. SAP encapsulations supported by testhead tool Epipe service configured with svc-sap-type Test SAP encapsulations null-star
Null, :* , 0.* , Q.*
Any
Null , :0 , :Q , :Q1.Q2
dot1q-preserve
:Q
The following combination of 1G and 10G port can be used, as long as the rate validated is less than or equal to 1Gb/s:
The test SAP is a 10G port, the uplink is 1G port and other ports (that is, uplink, MAC swap, and testhead) are 1G port.
The test SAP is a 10G port, the uplink is a 10G port and other ports (that is, MAC swap and testhead) are 1G port.
The test SAP is a 1G port, the uplink is a 10G port and other ports (that is, MAC swap and testhead) are 1G port.
Configuring testhead tool parameters
The following is a sample port loopback MAC swap configuration output using the service and SAP.
configure> system> loopback-no-svc-port testhead <port-id>
*A:7210SAS>config>system# info
----------------------------------------------
.............
resource-profile
            ingress-internal-tcam
                qos-sap-ingress-resource 5
                exit
                acl-sap-ingress 5
                exit
            exit
            egress-internal-tcam
            exit
        exit
        loopback-no-svc-port mac-swap 1/1/8 testhead 1/1/11
..............
The following is a sample port loopback with MAC swap configuration output on the remote end.
*A:7210SAS# configure system loopback-no-svc-port mac-swap 1/1/8
*A:7210SAS# configure system
*A:7210SAS>config>system# info
----------------------------------------------
        alarm-contact-input 1
            shutdown
        exit
        alarm-contact-input 2
            shutdown
        exit
        alarm-contact-input 3
            shutdown
        exit
        alarm-contact-input 4
            shutdown
        exit
        resource-profile
            ingress-internal-tcam
                qos-sap-ingress-resource 5
                exit
                acl-sap-ingress 5
                exit
            exit
            egress-internal-tcam
            exit
        exit
        loopback-no-svc-port mac-swap 1/1/8 testhead 1/1/11
.................
The following is a sample testhead profile configuration output.
*A:7210SAS# configure test-oam testhead-profile 1
*A:7210SAS>config>test-oam>testhd-prof# info
----------------------------------------------
description "Testhead_Profile_1"
            frame-size 512
            rate cir 100 adaptation-rule max pir 200
            dot1p in-profile 2 out-profile 4
            frame-payload 1 payload-type tcp-ipv4 create
                description "Frame_Payload_1"
                dscp "af11"
                dst-ip ipv4 10.2.2.2
                dst-mac 00:00:00:00:00:02
                src-mac 00:00:00:00:00:01
                dst-port 50
                src-port 40
                ip-proto 6
                ip-tos 8
                ip-ttl 64
                src-ip ipv4 10.1.1.1
            exit
acceptance-criteria 1 create
                jitter-rising-threshold 100
                jitter-rising-threshold-in 100
                jitter-rising-threshold-out 100
                latency-rising-threshold 100
                latency-rising-threshold-in 100
                latency-rising-threshold-out 100
                loss-rising-threshold 100
                loss-rising-threshold-in 100
                loss-rising-threshold-out 100
                cir-threshold 1000
                pir-threshold 2000
            exit

----------------------------------------------
*A:7210SAS>config>test-oam>testhd-prof#
The following command is used to execute the testhead profile.
*A:7210SAS# oam testhead testhead-profile 1 frame-payload 1 sap 1/1/2 test-
me owner ownerme color-aware enable
OAM Performance Monitoring (OAM-PM)
OAM-PM provides an architecture for gathering and computing key performance indicators (KPIs) using standard protocols and a robust collection model. The architecture comprises the following foundational components:
session
The session is the overall collection of different tests, test parameters, measurement intervals, and mappings to configured storage models. It is the overall container that defines the attributes of the session.
standard PM packets
Standard PM packets are the protocols defined by various standards bodies which contains the necessary fields to collect statistical data for the performance attribute they represent. OAM-PM leverages single-ended protocols. Single-ended protocols typically follow a message response model, message sent by a launch point, response updated and reflected by a responder.
measurement intervals (MI)
MI are time-based non-overlapping windows that capture all results that are received in that window of time.
data structures
Data structures are the unique counters and measurement results that represent the specific protocol.
bin group
Bin groups are ranges in microseconds that count the results that fit into the range.
The following figure shows the hierarchy of the architecture. This diagram is only meant to show the relationship between the components. It is not meant to depict all details of the required parameters.
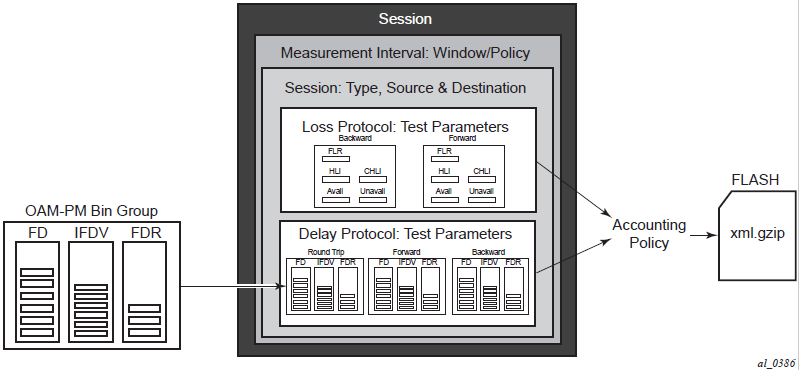
OAM-PM configurations are not dynamic environments. All aspects of the architecture must be carefully considered before configuring the various architectural components, making external references to other related components, or activating the OAM-PM architecture. No modifications are allowed to any components that are active or have any active sub-components. Any function being referenced by an active OAM-PM function or test cannot be modified or shut down. For example, to change any configuration element of a session, all active tests must be in a shutdown state. To change any bin group configuration (described later in this section) all sessions that reference the bin group must have every test shutdown. The description parameter is the only exception to this rule.
Session source and destination configuration parameters are not validated by the test that makes use of that information. When the test is activated with a no shutdown command, the test engine will attempt to send the test packets even if the session source and destination information does not accurately represent the entity that must exist to successfully transmit packets. If the entity does not exist, the transmit count for the test will be zero.
OAM-PM is not a hitless operation. If a high availability event occurs that causes the backup CPM to become the active CPM, or when ISSU functions are performed, the test data will not be correctly reported. There is no synchronization of state between the active and the backup control modules. All OAM-PM statistics stored in volatile memory will be lost. When the reload or high availability event is completed and all services are operational then the OAM-PM functions will commence.
It is possible that during times of network convergence, high CPU utilizations, or contention for resources, OAM-PM may not be able to detect changes to an egress connection or allocate the necessary resources to perform its tasks.
Session
This is the overall collection of different tests, the test parameters, measurement intervals, and mapping to configured storage models. It is the overall container that defines the attributes of the session:
session type
A session type is the impetus of the test, which is either proactive (default) or on-demand. Individual test timing parameters are influenced by this setting. A proactive session will start immediately following the execution of a no shutdown command for the test. A proactive test will continue to execute until a manual shutdown stops the individual test. On-demand tests will also start immediately following the no shutdown command. However, the operator can override the no test-duration default and configure a fixed amount of time that the test will execute, up to 24 hours (86400 seconds). If an on-demand test is configured with a test-duration, it is important to shut down tests when they are completed. In the event of a high availability event causing the backup CPM to become the active CPM, all on-demand tests that have a test-duration statement will restart and run for the configured amount of time regardless of their progress on the previously active CPM.
test family
The test family is the main branch of testing that addresses a specific technology. The available test for the session are based on the test family. The destination, source, and priority are common to all tests under the session and are defined separately from the individual test parameters.
test parameters
Test parameters are the parameters included in individual tests, as well as the associated parameters including start and stop times and the ability to activate and deactivate the individual test.
measurement interval
A measurement interval is the assignment of collection windows to the session with the appropriate configuration parameters and accounting policy for that specific session.
The session can be viewed as the single container that brings all aspects of individual tests and the various OAM-PM components under a single umbrella. If any aspects of the session are incomplete, the individual test cannot be activated with a no shutdown command, and an "Invalid Ethernet session parameters" error will occur.
Standard PM packets
A number of standards bodies define performance monitoring packets that can be sent from a source, processed, and responded to by a reflector. The protocols available to carry out the measurements are based on the test family type configured for the session.
Ethernet PM delay measurements are carried out using the Two Way Delay Measurement Protocol version 1 (DMMv1) defined in Y.1731 by the ITU-T. This allows for the collection of Frame Delay (FD), InterFrame Delay Variation (IFDV), Frame Delay Range (FDR), and Mean Frame Delay (MFD) measurements for round trip, forward, and backward directions.
DMMv1 adds the following to the original DMM definition:
the Flag Field (1 bit – LSB) is defined as the Type (Proactive=1 | On-Demand=0)
the TestID TLV (32 bits) is carried in the Optional TLV portion of the PDU
DMMv1 and DMM are backwards compatible and the interaction is defined in Y.1731 ITU-T-2011 Section 11 "OAM PDU validation and versioning".
Ethernet PM loss measurements are carried out using Synthetic Loss Measurement (SLM), which is defined in Y.1731 by the ITU-T. This allows for the calculation of Frame Loss Ratio (FLR) and availability.
A session can be configured with one or more tests. Depending on the session test type family, one or more test configurations may need to be included in the session to gather both delay and loss performance information. Each test that is configured shares the common session parameters and the common measurement intervals. However, each test can be configured with unique per-test parameters. Using Ethernet as an example, both DMM and SLM would be required to capture both delay and loss performance data.
Each test must be configured with a test ID as part of the test parameters, which uniquely identifies the test within the specific protocol. A test ID must be unique within the same test protocol. Again using Ethernet as an example, DMM and SLM tests within the same session can use the same test ID because they are different protocols. However, if a test ID is applied to a test protocol (like DMM or SLM) in any session, it cannot be used for the same protocol in any other session. When a test ID is carried in the protocol, as it is with DMM and SLM, this value does not have global significance. When a responding entity must index for the purpose of maintaining sequence numbers, as in the case of SLM, the test ID, Source MAC, and Destination MAC are used to maintain the uniqueness of the responder. This means that the test ID has only local, and not global, significance.
Measurement intervals
A measurement interval is a window of time that compartmentalizes the gathered measurements for an individual test that have occurred during that time. Allocation of measurement intervals, which equates to system memory, is based on the metrics being collected. This means that when both delay and loss metrics are being collected, they allocate their own set of measurement intervals. If the operator is executing multiple delay and loss tests under a single session, then multiple measurement intervals will be allocated, with one interval allocated per criteria per test.
Measurement intervals can be 15 minutes (15-min), one hour (1-hour) and 1 day (1-day) in duration. The boundary-type defines the start of the measurement interval and can be aligned to the local time of day clock, with or without an optional offset. The boundary-type can be aligned using the test-aligned option, which means that the start of the measurement interval coincides with the activation of the test. By default the start boundary is clock-aligned without an offset. When this configuration is deployed, the measurement interval will start at zero, in relation to the length. When a boundary is clock-aligned and an offset is configured, the specified amount of time will be applied to the measurement interval. Offsets are configured on a per-measurement interval basis and only applicable to clock-aligned measurement intervals. Only offsets less than the measurement interval duration are allowed. The following table describes some examples of the start times of each measurement interval.
| Offset | 15-min | 1-hour | 1-day |
|---|---|---|---|
0 (default) |
00, 15, 30, 45 |
00 (top of the hour) |
midnight |
10 minutes |
10, 25, 40, 55 |
10 min after the hour |
10 min after midnight |
30 minutes |
rejected |
30 min after the hour |
30 min after midnight |
60 minutes |
rejected |
rejected |
01:00 AM |
Although test-aligned approaches may seem beneficial for simplicity, there are some drawbacks that need to be considered. The goal of the time-based and well defined collection windows allows for the comparison of measurements across common windows of time throughout the network and for relating different tests or sessions. It is suggested that proactive sessions use the default clock-aligned boundary type. On-demand sessions may make use of test-aligned boundaries. On-demand tests are typically used for troubleshooting or short term monitoring that does not require alignment or comparison to other PM data.
The statistical data collected and the computed results from each measurement interval are maintained in volatile system memory by default. The number of intervals stored is configurable per measurement interval. Different measurement intervals will have different defaults and ranges. The interval-stored parameter defines the number of completed individual test runs to store in volatile memory. There is an additional allocation to account for the active measurement interval. To look at the statistical information for the individual tests and a specific measurement interval stored in volatile memory, the show oam-pm statistics … interval-number command can be used. If there is an active test, it can be viewed by using the interval number 1. In this case, the first completed record would be interval number 2, and previously completed records would increment up to the maximum intervals stored value plus one.
As new tests for the measurement interval are completed, the older entries are renumbered to maintain their relative position to the current test. If the retained test data for a measurement interval consumes the final entry, any subsequent entries cause the removal of the oldest data.
There are drawbacks to this storage model. Any high availability function that causes an active CPM switch will flush the results that are in volatile memory. Another consideration is the large amount of system memory consumed using this type of model. With the risks and resource consumption this model incurs, an alternate method of storage is supported.
An accounting policy can be applied to each measurement interval to write the completed data in system memory to non-volatile flash memory in an XML format. The amount of system memory consumed by historically completed test data must be balanced with an appropriate accounting policy. Nokia recommends that only necessary data be stored in non-volatile memory to avoid unacceptable risk and unnecessary resource consumption. It is further suggested that a large overlap between the data written to flash memory and stored in volatile memory is unnecessary.
The statistical information in system memory is also available through SNMP. If this method is chosen, a balance must be struck between the intervals retained and the times at which the SNMP queries collect the data. Determining the collection times through SNMP must be done with caution. If a file is completed while another file is being retrieved through SNMP, then the indexing will change to maintain the relative position to the current run. Correct spacing of the collection is key to ensuring data integrity.
The OAM-PM XML file contains the keywords and MIB references described in the following table.
| XML file keyword | Description | TIMETRA-OAM-PM-MIB object |
|---|---|---|
oampm |
— |
None - header only |
Keywords shared by all OAM-PM protocols |
||
sna |
OAM-PM session name |
tmnxOamPmCfgSessName |
mi |
Measurement interval record |
None - header only |
dur |
Measurement interval duration (minutes) |
tmnxOamPmCfgMeasIntvlDuration (enumerated) |
ivl |
Measurement interval number |
tmnxOamPmStsIntvlNum |
sta |
Start timestamp |
tmnxOamPmStsBaseStartTime |
ela |
Elapsed time (seconds) |
tmnxOamPmStsBaseElapsedTime |
ftx |
Frames sent |
tmnxOamPmStsBaseTestFramesTx |
frx |
Frames received |
tmnxOamPmStsBaseTestFramesRx |
sus |
Suspect flag |
tmnxOamPmStsBaseSuspect |
dmm |
Delay record |
None - header only |
mdr |
Minimum frame delay, round-trip |
tmnxOamPmStsDelayDmm2wyMin |
xdr |
Maximum frame delay, round-trip |
tmnxOamPmStsDelayDmm2wyMax |
adr |
Average frame delay, round-trip |
tmnxOamPmStsDelayDmm2wyAvg |
mdf |
Minimum frame delay, forward |
tmnxOamPmStsDelayDmmFwdMin |
xdf |
Maximum frame delay, forward |
tmnxOamPmStsDelayDmmFwdMax |
adf |
Average frame delay, forward |
tmnxOamPmStsDelayDmmFwdAvg |
mdb |
Minimum frame delay, backward |
tmnxOamPmStsDelayDmmBwdMin |
xdb |
Maximum frame delay, backward |
tmnxOamPmStsDelayDmmBwdMax |
adb |
Average frame delay, backward |
tmnxOamPmStsDelayDmmBwdAvg |
mvr |
Minimum inter-frame delay variation, round-trip |
tmnxOamPmStsDelayDmm2wyMin |
xvr |
Maximum inter-frame delay variation, round-trip |
tmnxOamPmStsDelayDmm2wyMax |
avr |
Average inter-frame delay variation, round-trip |
tmnxOamPmStsDelayDmm2wyAvg |
mvf |
Minimum inter-frame delay variation, forward |
tmnxOamPmStsDelayDmmFwdMin |
xvf |
Maximum inter-frame delay variation, forward |
tmnxOamPmStsDelayDmmFwdMax |
avf |
Average inter-frame delay variation, forward |
tmnxOamPmStsDelayDmmFwdAvg |
mvb |
Minimum inter-frame delay variation, backward |
tmnxOamPmStsDelayDmmBwdMin |
xvb |
Maximum inter-frame delay variation, backward |
tmnxOamPmStsDelayDmmBwdMax |
avb |
Average inter-frame delay variation, backward |
tmnxOamPmStsDelayDmmBwdAvg |
mrr |
Minimum frame delay range, round-trip |
tmnxOamPmStsDelayDmm2wyMin |
xrr |
Maximum frame delay range, round-trip |
tmnxOamPmStsDelayDmm2wyMax |
arr |
Average frame delay range, round-trip |
tmnxOamPmStsDelayDmm2wyAvg |
mrf |
Minimum frame delay range, forward |
tmnxOamPmStsDelayDmmFwdMin |
xrf |
Maximum frame delay range, forward |
tmnxOamPmStsDelayDmmFwdMax |
arf |
Average frame delay range, forward |
tmnxOamPmStsDelayDmmFwdAvg |
mrb |
Minimum frame delay range, backward |
tmnxOamPmStsDelayDmmBwdMin |
xrb |
Maximum frame delay range, backward |
tmnxOamPmStsDelayDmmBwdMax |
arb |
Average frame delay range, backward |
tmnxOamPmStsDelayDmmBwdAvg |
fdr |
Frame delay bin record, round-trip |
None - header only |
fdf |
Frame delay bin record, forward |
None - header only |
fdb |
Frame delay bin record, backward |
None - header only |
fvr |
Inter-frame delay variation bin record, round-trip |
None - header only |
fvf |
Inter-frame delay variation bin record, forward |
None - header only |
fvb |
Inter-frame delay variation bin record, backward |
None - header only |
frr |
Frame delay range bin record, round-trip |
None - header only |
frf |
Frame delay range bin record, forward |
None - header only |
frb |
Frame delay range bin record, backward |
None - header only |
lbo |
Configured lower bound of the bin |
tmnxOamPmCfgBinLowerBound |
cnt |
Number of measurements within the configured delay range 1 |
tmnxOamPmStsDelayDmmBinFwdCount tmnxOamPmStsDelayDmmBinBwdCount tmnxOamPmStsDelayDmmBin2wyCount |
slm |
Synthetic loss measurement record |
None - header only |
txf |
Transmitted frames in the forward direction |
tmnxOamPmStsLossSlmTxFwd |
rxf |
Received frames in the forward direction |
tmnxOamPmStsLossSlmRxFwd |
txb |
Transmitted frames in the backward direction |
tmnxOamPmStsLossSlmTxBwd |
rxb |
Received frames in the backward direction |
tmnxOamPmStsLossSlmRxBwd |
avf |
Available count in the forward direction |
tmnxOamPmStsLossSlmAvailIndFwd |
avb |
Available count in the forward direction |
tmnxOamPmStsLossSlmAvailIndBwd |
uvf |
Unavailable count in the forward direction |
tmnxOamPmStsLossSlmUnavlIndFwd |
uvb |
Unavailable count in the forward direction |
tmnxOamPmStsLossSlmUnavlIndBwd |
uaf |
Undetermined available count in the forward direction |
tmnxOamPmStsLossSlmUndtAvlFwd |
uab |
Undetermined available count in the backward direction |
tmnxOamPmStsLossSlmUndtAvlBwd |
uuf |
Undetermined unavailable count in the forward direction |
tmnxOamPmStsLossSlmUndtUnavlFwd |
uub |
Undetermined unavailable count in the backward direction |
tmnxOamPmStsLossSlmUndtUnavlBwd |
hlf |
Count of HLIs in the forward direction |
tmnxOamPmStsLossSlmHliFwd |
hlb |
Count of HLIs in the backward direction |
tmnxOamPmStsLossSlmHliBwd |
chf |
Count of CHLIs in the forward direction |
tmnxOamPmStsLossSlmChliFwd |
chb |
Count of CHLIs in the backward direction |
tmnxOamPmStsLossSlmChliBwd |
mff |
Minimum FLR in the forward direction |
tmnxOamPmStsLossSlmMinFlrFwd |
xff |
Maximum FLR in the forward direction |
tmnxOamPmStsLossSlmMaxFlrFwd |
aff |
Average FLR in the forward direction |
tmnxOamPmStsLossSlmAvgFlrFwd |
mfb |
Minimum FLR in the backward direction |
tmnxOamPmStsLossSlmMinFlrBwd |
xfb |
Maximum FLR in the backward direction |
tmnxOamPmStsLossSlmMaxFlrBwd |
afb |
Average FLR in the backward direction |
tmnxOamPmStsLossSlmAvgFlrBwd |
By default, the 15-min measurement interval stores 33 test runs (32+1) with a configurable range of 1 to 96, and the 1-hour measurement interval stores 9 test runs (8+1) with a configurable range of 1 to 24. The only storage for the 1-day measurement interval is 2 (1+1). This value for the 1-day measurement interval cannot be changed.
All three measurement intervals may be added to a single session if required. Each measurement interval that is included in a session is updated simultaneously for each test that is executing. If a measurement interval length is not required, it should not be configured. In addition to the three predetermined length measurement intervals, a fourth ‟always on” raw measurement interval is allocated at test creation. Data collection for the raw measurement interval commences immediately following the execution of a no shutdown command. It is a valuable tool for assisting in real-time troubleshooting as it maintains the same performance information and relates to the same bins as the fixed length collection windows. The operator may clear the contents of the raw measurement interval and flush stale statistical data to look at current conditions. This measurement interval has no configuration options, cannot be written to flash memory, and cannot be disabled; It is a single never-ending window.
Memory allocation for the measurement intervals is performed when the test is configured. Volatile memory is not flushed until the test is deleted from the configuration, a high availability event causes the backup CPM to become the newly active CPM, or some other event clears the active CPM system memory. Shutting down a test does not release the allocated memory for the test.
Measurement intervals also include a suspect flag. The suspect flag is used to indicate that data collected in the measurement interval may not be representative. The flag will be set to true only under the following conditions:
Time of day clock is adjusted by more than 10 seconds.
Test start does not align with the start boundary of the measurement interval. This would be common for the first execution for clock aligned tests.
Test stopped before the end of the measurement interval boundary
The suspect flag is not set when there are times of service disruption, maintenance windows, discontinuity, low packet counts, or other such events. Higher level systems would be required to interpret and correlate those types of event for measurement intervals which executed during the time that relate to the specific interruption or condition. Because each measurement interval contains a start and stop time, the information is readily available for higher level systems to discount the specific windows of time.
Data structures and storage
There are two main metrics that are the focus of OAM-PM: delay and loss. The different metrics have two unique storage structures and will allocate their own measurement intervals for these structures. This occurs regardless of whether the performance data is gathered with a single packet or multiple packet types.
Delay metrics include Frame Delay (FD), InterFrame Delay Variation (IFDV), Frame Delay Range (FDR) and Mean Frame Delay (MFD). Unidirectional and round trip results are stored for each metric:
Frame Delay
The Frame Delay is the amount of time required to send and receive the packet.
InterFrame Delay Variation
IFDV is the difference in the delay metrics between two adjacent packets.
Frame Delay Range
The Frame Delay Range is the difference between the minimum frame delay and the individual packet
Mean Frame Delay
The Mean Frame Delay is the mathematical average for the frame delay over the entire window.
FD, IFDV and FDR statistics are binnable results. FD, IFDV, FDR and MFD all include minimum, maximum, and average values. Unidirectional and round trip results are stored for each metric.
Unidirectional frame delay and frame delay range measurements require exceptional time of day clock synchronization. If the time of day clock does not exhibit extremely tight synchronization, unidirectional measurements will not be representative. In one direction, the measurement will be artificially increased by the difference in the clocks. In the other direction, the measurement will be artificially decreased by the difference in the clocks. This level of clocking accuracy is not available with NTP. To achieve this level of time of day clock synchronization, Precision Time Protocol (PTP) 1588v2 should be considered.
Round trip metrics do not require clock synchronization between peers, since the four timestamps allow for accurate representation of the round trip delay. The mathematical computation removes remote processing and any difference in time of day clocking. Round trip measurements do require stable local time of day clocks.
Any delay metric that is negative will be treated as zero and placed in bin 0, the lowest bin which has a lower boundary of 0 microseconds.
Delay results are mapped to the measurement interval that is active when the result arrives back at the source.
There are no supported log events based on delay metrics.
Loss metrics are only unidirectional and will report frame loss ratio (FLR) and availability information. Frame loss ratio is the computation of loss (lost/sent) over time. Loss measurements during periods of unavailability are not included in the FLR calculation as they are counted against the unavailability metric.
Availability requires relating three different functions. First, the individual probes are marked as available or unavailable based on sequence numbers in the protocol. A number of probes are rolled up into a small measurement window, typically 1 s. Frame loss ratio is computed over all the probes in a small window. If the resulting percentage is higher than the configured threshold, the small window is marked as unavailable. If the resulting percentage is lower than the threshold, the small window is marked as available. A sliding window is defined as some number of small windows, typically 10. The sliding window is used to determine availability and unavailability events. Switching from one state to the other requires every small window in the sliding window to be the same state and different from the current state.
Availability and unavailability counters are incremented based on the number of small windows that have occurred in all available and unavailable windows.
Availability and unavailability using synthetic loss measurements is meant to capture the loss behavior for the service. It is not meant to capture and report on service outages or communication failures. Communication failures of a bidirectional or unidirectional nature must be captured using some other means of connectivity verification, alarming, or continuity checking. During times of complete or extended failure periods it becomes necessary to timeout individual test probes. It is not possible to determine the direction of the loss because no response packets are being received back on the source. In this case, the statistics calculation engine maintains the previous state, updating the appropriate directional availability or unavailability counter. At the same time, an additional per-direction undetermined counter is updated. This undetermined counter is used to indicate that the availability or unavailability statistics could not be determined for a number of small windows.
During connectivity outages, the higher level systems can be used to discount the loss measurement interval, which covers the same span as the outage.
Availability and unavailability computations may delay the completion of a measurement interval. The declaration of a state change or the delay to a closing a measurement interval could be equal to the length of the sliding window and the timeout of the last packet. Closing of a measurement interval cannot occur until the sliding window has determined availability or unavailability. If the availability state is changing and the determination is crossing two measurement intervals, the measurement interval will not complete until the declaration has occurred. Typically, standard bodies indicate the timeout per packet. In the case of Ethernet, DMMv1, and SLM, timeout values are set at 5 s and cannot be configured.
There are no log events based on availability or unavailability state changes.
During times of availability, there can be times of high loss intervals (HLI) or consecutive high loss intervals (CHLI). These are indicators that the service was available but individual small windows or consecutive small windows experienced frame loss ratios exceeding the configured acceptable limit. A HLI is any single small window that exceeds the configured frame loss ratio. This could equate to a severely errored second, assuming the small window is one second. A CHIL is a consecutive high loss interval that exceeds a consecutive threshold within the sliding window. Only one HLI will be counted for a window.
Availability can only be reasonably determined with synthetic packets. This is because the synthetic packet is the packet being counted and provides a uniform packet flow that can be used for the computation. Transmit and receive counter-based approaches cannot reliably be used to determine availability because there is no guarantee that service data is on the wire, or the service data on the wire uniformity could make it difficult to make a declaration valid.
The following figure shows loss in a single direction using synthetic packets, and demonstrates what happens when a possible unavailability event crosses a measurement interval boundary. In the diagram, the first 13 small windows are all marked available (1), which means that the loss probes that fit into each of those small windows did not equal or exceed a frame loss ratio of 50%. The next 11 small windows are marked as unavailable, which means that the loss probes that fit into each of those small windows were equal to or above a frame loss ratio of 50%. After the 10th consecutive small window of unavailability, the state transitions from available to unavailable. The 25th small window is the start of the new available state which is declared following the 10th consecutive available small window. Notice that the frame loss ratio is 00.00%; this is because all the small windows that are marked as unavailable are counted toward unavailability, and therefore are excluded from impacting the FLR. If there were any small windows of unavailability that were outside of an unavailability event, they would be marked as HLI or CHLI and be counted as part of the frame loss ratio.
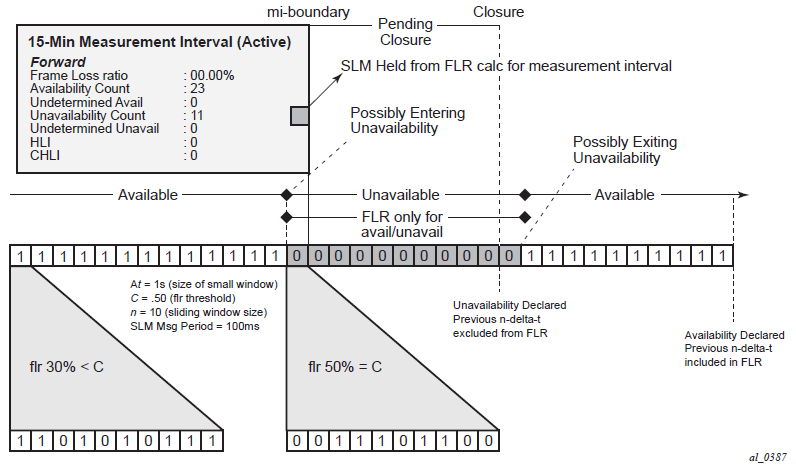
Bin groups
Bin groups are templates that are referenced by the session. Three types of binnable statistics are available: FD, IFDV, and FDR, all of which are available in forward, backward, and round trip directions. Each of these metrics can have up to ten bin groups configured to group the results. Bin groups are configured by indicating a lower boundary. Bin 0 has a lower boundary that is always zero and is not configurable. The microsecond range of the bins is the difference between the adjacent lower boundaries. For example, bin-type fd bin 1 configured with lower-bound 1000 means that bin 0 will capture all frame delay statistics results between 0 and 1 ms. Bin 1 will capture all results above 1 ms and below the bin 2 lower boundary. The last bin to be configured would represent the bin that collects all the results at and above that value. Not all ten bins must be configured.
Each binnable delay metric type requires their own values for the bin groups. Each bin in a type is configurable for one value. It is not possible to configure a bin with different values for round trip, forward, and backward. Consideration must be given to the configuration of the boundaries that represent the important statistics for that specific service.
As stated earlier in this section, this is not a dynamic environment. If a bin group is being referenced by any active test the bin group cannot shutdown. To modify the bin group it must be shut down. If the configuration of a bin group must be changed, and a large number of sessions are referencing the bin group, migrating existing sessions to a new bin group with the new parameters can be considered to reduce the maintenance window. To modify any session parameter, every test in the session must be shut down.
Bin group 1 is the default bin group. Every session requires a bin group to be assigned. By default, bin group 1 is assigned to every OAM-PM session that does not have a bin group explicitly configured. Bin group 1 cannot be modified. The bin group 1 configuration parameters are as follows:
-------------------------------------------------------------------------------
Configured Lower Bounds for Delay Measurement (DMM) Tests, in microseconds
-------------------------------------------------------------------------------
Group Description                    Admin Bin     FD(us)    FDR(us)   IFDV(us)
-------------------------------------------------------------------------------
1     OAM PM default bin group (not*    Up   0          0          0          0
                                             1       5000       5000       5000
                                             2      10000          -          -
-------------------------------------------------------------------------------
Relating the components
The following figure shows the architecture of all of the OAM-PM concepts previously described. It shows a more detailed hierarchy than previously shown in the introduction. This shows the relationship between the tests, the measurement intervals, and the storage of the results.
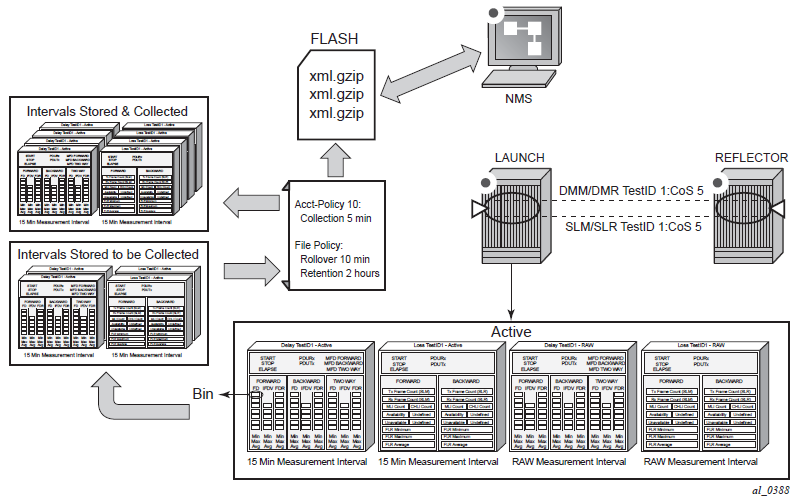
Monitoring
The following configuration examples are used to demonstrate the different show and monitoring commands available to check OAM-PM.
Accounting policy configuration
config>log# info
----------------------------------------------
        file-id 1
            description "OAM PM XML file Paramaters"
            location cf2:
            rollover 10 retention 2
        exit
        accounting-policy 1
            description "Default OAM PM Collection Policy for 15-min Bins"
            record complete-pm
            collection-interval 5
            to file 1
            no shutdown
        exit
        log-id 1
        exit
----------------------------------------------
ETH-CFM configuration
config>eth-cfm# info
----------------------------------------------
        domain 12 format none level 2
            association 4 format string name "vpls4-0000001"
                bridge-identifier 4
                    id-permission chassis
                exit
                ccm-interval 1
                remote-mepid 30
            exit
        exit
Service configuration
config>service>vpls# info
----------------------------------------------
            description "OAM PM Test Service to v30"
            stp
                shutdown
            exit
            sap 1/1/10:4.* create
                eth-cfm
                    mep 28 domain 12 association 4 direction up
                        ccm-enable
                        mac-address 00:00:00:00:00:28
                        no shutdown
                    exit
                exit
            exit
            sap 1/2/1:4.* create
            exit
            no shutdown
OAM-PM configuration
config>oam-pm#info detail
-----------------------------------------------
        bin-group 2 fd-bin-count 10 fdr-bin-count 2 ifdv-bin-count 10 create
            no description
            bin-type fd
                bin 1
                    lower-bound 1000
                exit
                bin 2
                    lower-bound 2000
                exit
                bin 3
                    lower-bound 3000
                exit
                bin 4
                    lower-bound 4000
                exit
                bin 5
                    lower-bound 5000
                exit
                bin 6
                    lower-bound 6000
                exit
                bin 7
                    lower-bound 7000
                exit
                bin 8
                    lower-bound 8000
                exit
                bin 9
                    lower-bound 10000
                exit
            exit
            bin-type fdr
                bin 1
                    lower-bound 5000
                exit
            exit
            bin-type ifdv
                bin 1
                    lower-bound 100
                exit
                bin 2
                    lower-bound 200
                exit
                bin 3
                    lower-bound 300
                exit
                bin 4
                    lower-bound 400
                exit
                bin 5
                    lower-bound 500
                exit
                bin 6
                    lower-bound 600
                exit
                bin 7
                    lower-bound 700
                exit
                bin 8
                    lower-bound 800
                exit
                bin 9
                    lower-bound 1000
                exit
            exit
            no shutdown
        exit
        session "eth-pm-service-4" test-family ethernet session-
type proactive create
            bin-group 2
            no description
            meas-interval 15-mins create
                no accounting-policy
                boundary-type clock-aligned
                clock-offset 0
                intervals-stored 32
            exit
            ethernet
                dest-mac 00:00:00:00:00:30
                priority 0
                source mep 28 domain 12 association 4
                dmm test-id 10004 create
                    data-tlv-size 1000
                    interval 1000
                    no test-duration
                    no shutdown
                exit
                slm test-id 10004 create
                    data-tlv-size 1000
                    flr-threshold 50
                    no test-duration
                    timing frames-per-delta-t 10 consec-delta-t 10 interval 100
                           chli-threshold 4
                    no shutdown
                exit
            exit
        exit
Show and monitor commands
show oam-pm bin-group
-------------------------------------------------------------------------------
Configured Lower Bounds for Delay Measurement (DMM) Tests, in microseconds
-------------------------------------------------------------------------------
Group Description Admin Bin FD(us) FDR(us) IFDV(us)
-------------------------------------------------------------------------------
1 OAM PM default bin group (not* Up 0 0 0 0
1 5000 5000 5000
2 10000 - -
-------------------------------------------------------------------------------
2 Up 0 0 0 0
1 1000 5000 100
2 2000 - 200
3 3000 - 300
4 4000 - 400
5 5000 - 500
6 6000 - 600
7 7000 - 700
8 8000 - 800
9 10000 - 1000
-------------------------------------------------------------------------------
-------------------------------------------------------------------------------
* indicates that the corresponding row element may have been truncated.
show oam-pm bin-group 2
-------------------------------------------------------------------------------
Configured Lower Bounds for Delay Measurement (DMM) Tests, in microseconds
-------------------------------------------------------------------------------
Group Description Admin Bin FD(us) FDR(us) IFDV(us)
-------------------------------------------------------------------------------
2 Up 0 0 0 0
1 1000 5000 100
2 2000 - 200
3 3000 - 300
4 4000 - 400
5 5000 - 500
6 6000 - 600
7 7000 - 700
8 8000 - 800
9 10000 - 1000
-------------------------------------------------------------------------------
show oam-pm bin-group-using
=========================================================================
OAM Performance Monitoring Bin Group Configuration for Sessions
=========================================================================
Bin Group Admin Session Session State
-------------------------------------------------------------------------
2 Up eth-pm-service-4 Act
-------------------------------------------------------------------------
=========================================================================
show oam-pm bin-group-using bin-group 2
=========================================================================
OAM Performance Monitoring Bin Group Configuration for Sessions
=========================================================================
Bin Group Admin Session Session State
-------------------------------------------------------------------------
2 Up eth-pm-service-4 Act
-------------------------------------------------------------------------
=========================================================================
show oam-pm sessions test-family ethernet
============================================================================
OAM Performance Monitoring Session Summary for the Ethernet Test Family
============================================================================
Session State Bin Group Sess Type Test Types
----------------------------------------------------------------------------
eth-pm-service-4 Act 2 proactive DMM SLM
============================================================================
show oam-pm session "eth-pm-service-4" all
-------------------------------------------------------------------------------
Basic Session Configuration
-------------------------------------------------------------------------------
Session Name : eth-pm-service-4
Description : (Not Specified)
Test Family : ethernet Session Type : proactive
Bin Group : 2
-------------------------------------------------------------------------------
-------------------------------------------------------------------------------
Ethernet Configuration
-------------------------------------------------------------------------------
Source MEP : 28 Priority : 0
Source Domain : 12 Dest MAC Address : 00:00:00:00:00:30
Source Assoc'n : 4
-------------------------------------------------------------------------------
-------------------------------------------------------------------------------
DMM Test Configuration and Status
-------------------------------------------------------------------------------
Test ID : 10004 Admin State : Up
Oper State : Up Data TLV Size : 1000 octets
On-Demand Duration: Not Applicable On-Demand Remaining: Not Applicable
Interval : 1000 ms
-------------------------------------------------------------------------------
-------------------------------------------------------------------------------
SLM Test Configuration and Status
-------------------------------------------------------------------------------
Test ID : 10004 Admin State : Up
Oper State : Up Data TLV Size : 1000 octets
On-Demand Duration: Not Applicable On-Demand Remaining: Not Applicable
Interval : 100 ms
CHLI Threshold : 4 HLIs Frames Per Delta-T : 10 SLM frames
Consec Delta-Ts : 10 FLR Threshold : 50%
-------------------------------------------------------------------------------
-------------------------------------------------------------------------------
15-mins Measurement Interval Configuration
-------------------------------------------------------------------------------
Duration : 15-mins Intervals Stored : 32
Boundary Type : clock-aligned Clock Offset : 0 seconds
Accounting Policy : none
-------------------------------------------------------------------------------
-------------------------------------------------------------------------------
Configured Lower Bounds for Delay Measurement (DMM) Tests, in microseconds
-------------------------------------------------------------------------------
Group Description Admin Bin FD(us) FDR(us) IFDV(us)
-------------------------------------------------------------------------------
2 Up 0 0 0 0
1 1000 5000 100
2 2000 - 200
3 3000 - 300
4 4000 - 400
5 5000 - 500
6 6000 - 600
7 7000 - 700
8 8000 - 800
9 10000 - 1000
-------------------------------------------------------------------------------
show oam-pm statistics session "eth-pm-service-4" dmm meas-interval 15-
mins interval-number 2 all
------------------------------------------------------------------------------
Start (UTC) : 2014/02/01 10:00:00 Status : completed
Elapsed (seconds) : 900 Suspect : no
Frames Sent : 900 Frames Received : 900
------------------------------------------------------------------------------
----------------------------------------------------------------------
Bin Type Direction Minimum (us) Maximum (us) Average (us)
----------------------------------------------------------------------
FD Forward 0 8330 712
FD Backward 143 11710 2605
FD Round Trip 1118 14902 3111
FDR Forward 0 8330 712
FDR Backward 143 11710 2605
FDR Round Trip 0 13784 1990
IFDV Forward 0 8330 431
IFDV Backward 1 10436 800
IFDV Round Trip 2 13542 1051
----------------------------------------------------------------------
---------------------------------------------------------------
Frame Delay (FD) Bin Counts
---------------------------------------------------------------
Bin Lower Bound Forward Backward Round Trip
---------------------------------------------------------------
0 0 us 624 53 0
1 1000 us 229 266 135
2 2000 us 29 290 367
3 3000 us 4 195 246
4 4000 us 7 71 94
5 5000 us 5 12 28
6 6000 us 1 7 17
7 7000 us 0 1 5
8 8000 us 1 4 3
9 10000 us 0 1 5
---------------------------------------------------------------
---------------------------------------------------------------
Frame Delay Range (FDR) Bin Counts
---------------------------------------------------------------
Bin Lower Bound Forward Backward Round Trip
---------------------------------------------------------------
0 0 us 893 875 873
1 5000 us 7 25 27
---------------------------------------------------------------
---------------------------------------------------------------
Inter-Frame Delay Variation (IFDV) Bin Counts
---------------------------------------------------------------
Bin Lower Bound Forward Backward Round Trip
---------------------------------------------------------------
0 0 us 411 162 96
1 100 us 113 115 108
2 200 us 67 84 67
3 300 us 56 67 65
4 400 us 36 46 53
5 500 us 25 59 54
6 600 us 25 27 38
7 700 us 29 34 22
8 800 us 41 47 72
9 1000 us 97 259 325
---------------------------------------------------------------
show oam-pm statistics session "eth-pm-service-4" slm meas-interval 15-
mins interval-number 2
------------------------------------------------------------------------------
Start (UTC) : 2014/02/01 10:00:00 Status : completed
Elapsed (seconds) : 900 Suspect : no
Frames Sent : 9000 Frames Received : 9000
------------------------------------------------------------------------------
------------------------------------------------------
Frames Sent Frames Received
------------------------------------------------------
Forward 9000 9000
Backward 9000 9000
------------------------------------------------------
-------------------------------------------
Frame Loss Ratios
-------------------------------------------
Minimum Maximum Average
-------------------------------------------
Forward 0.000% 0.000% 0.000%
Backward 0.000% 0.000% 0.000%
-------------------------------------------
-------------------------------------------------------------------------------
Availability Counters (Und = Undetermined)
-------------------------------------------------------------------------------
Available Und-Avail Unavailable Und-Unavail HLI CHLI
-------------------------------------------------------------------------------
Forward 900 0 0 0 0 0
Backward 900 0 0 0 0 0
-------------------------------------------------------------------------------
show oam-pm statistics session "eth-pm-service-4" dmm meas-interval raw
------------------------------------------------------------------------------
Start (UTC) : 2014/02/01 09:43:58 Status : in-progress
Elapsed (seconds) : 2011 Suspect : yes
Frames Sent : 2011 Frames Received : 2011
------------------------------------------------------------------------------
----------------------------------------------------------------------
Bin Type Direction Minimum (us) Maximum (us) Average (us)
----------------------------------------------------------------------
FD Forward 0 11670 632
FD Backward 0 11710 2354
FD Round Trip 1118 14902 2704
FDR Forward 0 11670 611
FDR Backward 0 11710 2353
FDR Round Trip 0 13784 1543
IFDV Forward 0 10027 410
IFDV Backward 0 10436 784
IFDV Round Trip 0 13542 1070
----------------------------------------------------------------------
---------------------------------------------------------------
Frame Delay (FD) Bin Counts
---------------------------------------------------------------
Bin Lower Bound Forward Backward Round Trip
---------------------------------------------------------------
0 0 us 1465 252 0
1 1000 us 454 628 657
2 2000 us 62 593 713
3 3000 us 8 375 402
4 4000 us 11 114 153
5 5000 us 7 26 41
6 6000 us 2 10 20
7 7000 us 0 2 8
8 8000 us 1 10 11
9 10000 us 1 1 6
---------------------------------------------------------------
---------------------------------------------------------------
Frame Delay Range (FDR) Bin Counts
---------------------------------------------------------------
Bin Lower Bound Forward Backward Round Trip
---------------------------------------------------------------
0 0 us 2001 1963 1971
1 5000 us 11 49 41
---------------------------------------------------------------
---------------------------------------------------------------
Inter-Frame Delay Variation (IFDV) Bin Counts
---------------------------------------------------------------
Bin Lower Bound Forward Backward Round Trip
---------------------------------------------------------------
0 0 us 954 429 197
1 100 us 196 246 197
2 200 us 138 168 145
3 300 us 115 172 154
4 400 us 89 96 136
5 500 us 63 91 108
6 600 us 64 53 89
7 700 us 61 55 63
8 800 us 112 82 151
9 1000 us 219 619 771
---------------------------------------------------------------
show oam-pm statistics session "eth-pm-service-4" slm meas-interval raw
------------------------------------------------------------------------------
Start (UTC) : 2014/02/01 09:44:03 Status : in-progress
Elapsed (seconds) : 2047 Suspect : yes
Frames Sent : 20470 Frames Received : 20469
------------------------------------------------------------------------------
------------------------------------------------------
Frames Sent Frames Received
------------------------------------------------------
Forward 20329 20329
Backward 20329 20329
------------------------------------------------------
-------------------------------------------
Frame Loss Ratios
-------------------------------------------
Minimum Maximum Average
-------------------------------------------
Forward 0.000% 0.000% 0.000%
Backward 0.000% 0.000% 0.000%
-------------------------------------------
-------------------------------------------------------------------------------
Availability Counters (Und = Undetermined)
-------------------------------------------------------------------------------
Available Und-Avail Unavailable Und-Unavail HLI CHLI
-------------------------------------------------------------------------------
Forward 2033 0 0 0 0 0
Backward 2033 0 0 0 0 0
-------------------------------------------------------------------------------
The monitor command can be used to automatically update the statistics for the raw measurement interval.
Diagnostics command reference
Command hierarchies
OAM commands
Base operational commands
GLOBAL
    - ping [ip-address | dns-name] [rapid | detail] [ttl time-to-live] [tos type-of-service] [size bytes] [pattern pattern] [source ip-address | dns-name ] [interval seconds] [{next-hop ip-address} | {interface interface-name} | bypass-routing] [count requests] [do-not-fragment] [router router-instance | service-
name service- name] [timeout timeout] [fc fc-name]
    - traceroute [ip-address | dns-name] [ttl ttl] [wait milli-seconds] [no-dns] [source ip-address] [tos type-of-service] [router [router-instance | service- name service- name]
    - oam
        - dns target-addr dns-name name-server ip-address [source ip-address] [count send-count] [timeout timeout] [interval interval] [record-type {ipv4-a-record|ipv6-aaaa-record}]
        - saa test-name [owner test-owner] {start | stop} [no-accounting]
LSP diagnostics
GLOBAL
    - oam
        - lsp-ping bgp-label-prefix ip-prefix/mask [path-destination ip-address [interface if-name | next-hop ip-address]]
        - lsp-ping lsp-name [path path-name]
        - lsp-ping prefix ip-prefix/mask [path-destination ip-address [interface if-name | next-hop ip-address]]
        - lsp-ping static lsp-name [assoc-channel ipv4|non-ip|none] [dest-global-id global-id dest-node-id node-id] [force] [path-type active | working | protect]
        - lsp-trace bgp-label-prefix ip-prefix/mask [path-destination ip-address [interface if-name | next-hop ip-address]] [downstream-map-tlv dsmap | ddmap | none]
        - lsp-trace lsp-name [path path-name]
        - lsp-trace prefix ip-prefix/mask [path-destination ip-address [interface if-name | next-hop ip-address]]
        - lsp-trace static lsp-name [assoc-channel ipv4|non-ip|none] [path-type active | working | protect]
        - p2mp-lsp-ping {{lsp-name [p2mp-instance instance-name] [s2l-dest-address ip-address…[ip-address…up-to-5]] [ttl label-ttl]} | {ldp p2mp-id [sender-addr ip-address] [leaf-addr ip-address…[ip-address…up-to-5]}} [fc fc-name] [size octets] [timeout timeout] [interval interval] [detail]
        - p2mp-lsp-trace {lsp-name [p2mp-instance instance-name] [s2l-dest-address ip-address…[ip-address…up-to-5]]} | {ldp p2mp-id}} [fc fc-name] [size octets] [max-fail no-response-count] [probe-count probes-per-hop] [min-ttl min-label-ttl] [max-ttl max-label-ttl] [timeout timeout] [interval interval] [detail]
LDP diagnostics
GLOBAL
    - oam
        - ldp-treetrace {prefix ip-prefix/mask} [max-ttl ttl-value] [max-path max-paths] [timeout timeout] [retry-count retry-count] [fc fc-name [profile profile]] [downstream-map-tlv {dsmap | ddmap}]
    - config
        - test-oam
            - [no] ldp-treetrace
                - fc fc-name
                - no fc
                - path-discovery
                    - interval minutes
                    - no interval
                    - max-path max-paths
                    - no max-path
                    - max-ttl ttl-value
                    - no max-ttl
                    - policy-statement policy-name [...(up to 5 max)]
                    - no policy-statement
                    - retry-count retry-count
                    - no retry-count
                    - timeout timeout
                    - no timeout
                - path-probing
                    - interval minutes
                    - no interval
                    - retry-count retry-count
                    - no retry-count
                    - timeout timeout
                    - no timeout
                - [no] shutdown
            - mpls-echo-request-downstream-map {dsmap | ddmap}
            - no mpls-echo-request-downstream-map
TWAMP
GLOBAL
    - configure
        - test-oam
            - twamp
                - server
                    - [no] prefix {ip-prefix | mask} [create]
                        - [no] description description-string
                        - [no] max-conn-prefix count
                        - [no] max-sess-prefix count
                    - [no] inactivity-timeout seconds
                    - [no] max-conn-server count
                    - [no] max-sess-server count
                    - [no] shutdown
TWAMP Light
configure
    - router
        - twamp-light
            - reflector [udp-port udp-port-number] [create]
            - no reflector
                - description description-string
                - no description
                - prefix ip-prefix/prefix-length [create]
                - no prefix ip-prefix/prefix-length
                    - description description-string
                    - no description
                - [no] shutdown
configure
    - service
        - vprn
            - twamp-light
                - reflector [udp-port udp-port-number] [create]
                - no reflector
                    - description description-string
                    - no description
                    - prefix ip-prefix/prefix-length [create]
                    - no prefix ip-prefix/prefix-length
                        - description description-string
                        - no description
                    - [no] shutdown
configure
    - test-oam
        - twamp
            - twamp-light
                - inactivity-timeout seconds
                - no inactivity-timeout
SDP diagnostics
Common service diagnostics
GLOBAL
    - oam
        - svc-ping {ip-addr} service service-id [local-sdp] [remote-sdp]
        - dns target-addr dns-name name-server ip-address [source ip-address] [count send-count] [timeout timeout] [interval interval]
        - vprn-ping service-id service svc-name source ip-address destination ip-address [fc fc-name [size size] [ttl vc-label-ttl] [return-control] [interval interval] [count send-count] [timeout timeout]
        - vprn-trace service-id source src-ip destination ip-address [fc fc-name ] [size size] [min-ttl vc-label-ttl] [max-ttl vc-label-ttl] [return-control] [probe-count sendcount] [interval interval] [timeout timeout]
VLL diagnostics
GLOBAL
    - oam
        - vccv-ping sdp-id:vc-id[src-ip-address ip-addr dst-ip-address ip-addr pw-id pw-id][reply-mode {ip-routed | control-channel}] [fc fc-name [size octets] [send-count send-count] [timeout timeout] [interval interval] [ttl vc-label-ttl]
        - vccv-ping spoke-sdp spoke-sdp-id [reply-mode ip-routed| control-channel] [src-ip-address ip-addr dst-ip-address ip-addr]
        - vccv-ping static sdp-id:vc-id [assoc-channel ipv4 | non-ip] [dest-global-id global-id dest-node-id node-id] [src-ip-address ip-addr]
        - vccv-ping saii-type2 global-id:prefix:ac-id taii-type2 global-id:prefix:ac-id [reply-mode ip-routed | control-channel] [src-ip-address ip-addr dst-ip-address ip-addr]
        - vccv-ping spoke-sdp-fec spoke-sdp-fec-id [reply-mode ip-routed | control-channel] [saii-type2 global-id:prefix:ac-id taii-type2 global-id:prefix:ac-id] [src-ip-address ip-addr dst-ip-address ip-addr]
        - options common to all vccv-ping cases: [count send-count] [fc fc-name [profile in | out]] [interval interval] [size octets] [timeout timeout] [ttl vc-label-ttl]
        - vccv-trace sdp-id:vc-id [fc fc-name [profile {in | out}]] [size octets] [reply-mode ip-routed | control-channel] [probe-count probes-count] [timeout timeout] [interval interval] [min-ttl min-vc-label-ttl] [max-ttl
max-vc-label-ttl] [max-fail no-response-count] [detail]
        - vccv-trace static sdp-id:vc-id [assoc-channel ipv4 | non-ip] [src-ip-address ipv4-address]
        - vccv-trace saii-type2 global-id:prefix:ac-id taii-type2 global-id:prefix:ac-id [reply-mode ip-routed | control-channel]
        - vccv-trace spoke-sdp-fec spoke-sdp-fec-id [reply-mode ip-routed | control-channel] [saii-type2 global-id:prefix:ac-id taii-type2 global-id:prefix:ac-id]
        - options common to all vccv-trace cases: [detail] [fc fc-name [profile in | out]] [interval interval-value] [max-fail no-response-count] [max-ttl max-vc-label-ttl] [min-ttl min-vc-label-ttl] [probe-count probe-count] [size octets] [timeout timeout-value]
VPLS MAC diagnostics
GLOBAL
    - oam
        - cpe-ping service service-id destination ip-address source ip-address [source-mac ieee-address] [fc fc-name] [ttl vc-label-ttl] [count send-count] [send-control] [return-control] [interval interval]
        - mac-ping service service-id destination dst-ieee-address [source src-ieee-address] [fc fc-name ] [size octets] [fc fc-name] [ttl vc-label-ttl] [send-count send-count] [return-control] [interval interval] [timeout timeout]
        - mac-populate service-id mac ieee-address [flood] [age seconds] [force] [target-sap sap-id]
        - mac-purge service-id target ieee-address [flood] [register]
        - mac-trace service service-id destination ieee-address [source ieee-address] [fc fc-name ] [size octets] [min-ttl vc-label-ttl] [max-ttl vc-label-ttl] [probe-count send-count] return-control] [interval interval] [timeout timeout]
Ethernet in the First Mile (EFM) commands
ETH-CFM OAM commands
oam
    - eth-cfm
        - eth-test mac-address mep mep-id domain md-index association ma-index [priority priority] [data-length data-length]
        - linktrace mac-address mep mep-id domain md-index association ma-index [ttl ttl-value]
        - loopback mac-address mep mep-id domain md-index association ma-index [send-count send-count] [size data-size] [priority priority]
        - one-way-delay-test mac-address mep mep-id domain md-index association ma-index [priority priority]
        - two-way-delay-test mac-address mep mep-id domain md-index association ma-index [priority priority]
        - two-way-slm-test mac-address mep mep-id domain md-index association ma-index [fc {fc-name} [profile {in | out}]] [count send-count] [size data-size] [timeout timeout] [interval interval]
ETH-CFM configuration commands
config
    - eth-cfm
        - domain md-index [format md-name-format] [name md-name] level level
        - domain md-index
        - no domain md-index
            - association ma-index [format ma-name-format] name ma-name
            - association ma-index
            - no association ma-index
                - [no] bridge-identifier bridge-id
                    - id-permission {chassis}
                    - no id-permission
                        - mhf-creation {none | explicit | default | static}
                    - no mhf-creation
                    - mip-ltr-priority priority
                    - vlan vlan-id
                    - no vlan
                - ccm-interval {10ms | 100ms | 1 | 10 | 60 | 600}
                - no ccm-interval
                - [no] remote-mepid mep-id
        - slm
            - inactivity-timer timer
            - no inactivity-timer
        - system
            - sender-id local local-name
            - sender-id system
            - no sender-id
Y.1564 testhead OAM commands
config
    - test-oam
        - testhead-profile profile-id create
            - [no] acceptance-criteria acceptance-criteria-id create
                - [no] cir-threshold threshold
                - [no] jitter-rising-threshold threshold
                - [no] jitter-rising-threshold-in threshold
                - [no] jitter-rising-threshold-out threshold
                - [no] latency-rising-threshold threshold
                - [no] latency-rising-threshold-in threshold
                - [no] latency-rising-threshold-out threshold
                - [no] loss-rising-threshold threshold
                - [no] loss-rising-threshold-in threshold
                - [no] loss-rising-threshold-out threshold
                - [no] pir-threshold threshold
            - [no] description description-string
            - dot1p in-profile dot1p-value out-profile dot1p-value
            - no dot1p
            - no frame-payload payload-id [payload-type [l2 | tcp-ipv4 | udp-ipv4 | ipv4] create
            - no frame-payload payload
                - [no] data-pattern data-pattern
                - [no] description description-string
                - [no] dscp dscp-name
                - [no] dst-ip ipv4 ipv4-address
                - [no] dst-mac ieee-address [ieee-address-mask]
                - [no] dst-port dst-port-number
                - [no] ethertype 0x0600..0xffff
                - [no] ip-proto ip-protocol-number
                - [no] ip-tos type-of-service
                - [no] ip-ttl ttl-value
                - [no] src-ip ipv4 ipv4-address
                - [no] src-mac ieee-address [ieee-address-mask]
                - [no] src-port src-port-number
                - [no] vlan-tag-1 vlan-id vlan-id [tpid tpid] [dot1p dot1p-value]
                - [no] vlan-tag-2 vlan-id vlan-id [tpid tpid] [dot1p dot1p-value]
            - [no] frame-size frame-size
            - [no] rate cir cir-rate-in-kbps [adaptation-rule adaptation-rule] [pir pir-rate-in-kbps]
            - [no] test-completion-trap-enable
            - [no] test-duration [hours hours| minutes minutes| seconds seconds]
            - [no] test-duration
Y.1564 testhead OAM commands
Show commands
show
    - test-oam
        - testhead-profile profile-id
show
    - testhead [test-name owner test-owner] [detail]
Clear commands
OAM Performance Monitoring, bin group, and session commands
GLOBAL
    - oam
        - oam-pm session session-name {dmm | slm | twamp-light} {start | stop}
config
    - oam-pm
        - bin-group bin-group-number [fd-bin-count fd-bin-count fdr-bin-count fdr-bin-count ifdv-bin-count ifdv-bin-count create]
        - no bin-group bin-group-number
            - bin-type {fd | fdr | ifdv}
                - bin bin-number
                    - lower-bound microseconds
                    - no lower-bound
                    - delay-event {forward | backward | round-trip} lowest-bin bin-number threshold raise-threshold [clear clear-threshold]
                    - no delay-event {forward | backward | round-trip}
            - description description-string
            - no description
            - [no] shutdown
        - session session-name [test-family {ethernet | ip} [session-type {proactive | on-demand}] create]
        - no session session-name
            - bin-group bin-group-number
            - no bin-group
            - description description-string
            - no description
            - ethernet
                - dest-mac ieee-address
                - no dest-mac
                - dmm [test-id test-id] [create]
                - no dmm
                    - data-tlv-size octets
                    - no data-tlv-size
                    - interval milliseconds
                    - no interval
                    - [no] shutdown
                    - test-duration seconds
                    - no test-duration
                - priority priority
                - no priority
                - slm [test-id test-id] [create]
                    - data-tlv-size octets
                    - no data-tlv-size
                    - flr-threshold percentage
                    - no flr-threshold
                    - loss-events
                    - loss-events {forward | backward} threshold raise-threshold-percent [clear clear-threshold-percent]
                        - [no] avg-flr-event {forward | backward} threshold raise-threshold-percent [clear clear-threshold-percent]
                        - chli-event {forward | backward | aggregate} threshold raise-threshold [clear clear-threshold]
                        - [no] chli-event {forward | backward | aggregate}
                        - [no] flr-threshold percentage
                        - hli-event {forward | backward | aggregate} threshold raise-threshold [clear clear-threshold]
                        - [no] hli-event {forward | backward | aggregate}
                        - unavailability-event {forward | backward | aggregate} threshold raise-threshold [clear clear-threshold]
                        - [no] unavailability-event {forward | backward | aggregate}
                        - undet-availability-event {forward | backward | aggregate} threshold raise-threshold [clear clear-threshold]
                        - [no] undet-availability-event {forward | backward | aggregate}
                        - undet-unavailability-event {forward | backward | aggregate} threshold raise-threshold [clear clear-threshold]
                        - [no] undet-unavailability-event {forward | backward | aggregate}
                    - [no] shutdown
                    - test-duration seconds
                    - no test-duration
                    - timing frames-per-delta-t frames consec-delta-t deltas interval milliseconds chli-threshold threshold
                    - no timing
                - source mep mep-id domain md-index association ma-index
                - no source
            - meas-interval {5-mins | 15-mins | 1-hour | 1-day} [create]
                - accounting-policy acct-policy-id
                - no accounting-policy
                - boundary-type {clock-aligned | test-relative}
                - no boundary-type
                - clock-offset seconds
                - no clock-offset
                - event-mon
                    - [no] delay-events
                    - [no] loss-events
                    - [no] shutdown
                - intervals-stored intervals
                - no intervals-stored
OAM-PM session IP commands
configure
    - oam-pm
        - session session-name [test-family {ethernet | ip} [session-type {proactive | on-demand}] create]
        - no session session-name
            - ip
                - destination ip-address
                - no destination
                - dest-udp-port udp-port-number
                - no dest-udp-port
                - fc fc-name
                - no fc
                - forwarding bypass-routing
                - forwarding interface interface-name
                - forwarding next-hop ip-address
                - no forwarding
                - profile {in | out}
                - no profile
                - router router-instance
                - router service-name service-name
                - no router
                - source ip-address
                - no source
                - source-udp-port udp-port-number
                - no source-udp-port
                - ttl time-to-live
                - no ttl
                - twamp-light [test-id test-id] [create]
                - no twamp-light
                    - interval milliseconds
                    - no interval
                    - loss
                        - flr-threshold percentage
                        - no flr-threshold
                        - timing frames-per-delta-t frames consec-delta-t deltas chli-threshold threshold
                        - no timing
                    - loss-events
                        - avg-flr-event {forward | backward} threshold raise-threshold-percent [clear clear-threshold-percent]
                        - no avg-flr-event {forward | backward}
                        - chli-event {forward | backward | aggregate} threshold raise-threshold [clear clear-threshold]
                        - no chli-event {forward | backward | aggregate}
                        - hli-event {forward | backward | aggregate} threshold raise-threshold [clear clear-threshold]
                        - no hli-event {forward | backward | aggregate}
                        - unavailability-event {forward | backward | aggregate} threshold raise-threshold [clear clear-threshold]
                        - no unavailability-event {forward | backward | aggregate}
                        - undet-availability-event {forward | backward | aggregate} threshold raise-threshold [clear clear-threshold]
                        - no undet-availability-event {forward | backward | aggregate}
                        - undet-unavailability-event {forward | backward | aggregate} threshold raise-threshold [clear clear-threshold]
                        - no undet-unavailability-event {forward | backward | aggregate}
                    - pad-size octets
                    - no pad-size
                    - record-stats {delay | loss | delay-and-loss}
                    - no record-stats
                    - [no] shutdown
                    - test-duration seconds
                    - no test-duration
Clear commands
clear
    - oam-pm
        - session session-name {dmm | slm | twamp-light}
clear
    - eth-cfm
        - mep mep-id domain md-index association ma-index statistics
        - statistics
SAA commands
The following commands are supported on all 7210 SAS platforms as described in this document, except those operating in access-uplink mode:
cpe-ping
lsp-ping
lsp-trace
mac-ping
mac-trace
sdp-ping
vccv-ping
vccv-trace
vprn-ping
vprn-trace
config
    - saa
        - [no] test test-name [owner test-owner]
            - accounting-policy acct-policy-id
            - no accounting-policy
            - [no] continuous
            - description description-string
            - no description
            - [no] jitter-event rising-threshold threshold [falling-threshold threshold] [direction]
            - [no] latency-event rising-threshold threshold [falling-threshold threshold] [direction]
            - [no] loss-event rising-threshold threshold [falling-threshold threshold] [direction]
            - probe-history {keep|drop|auto}
            - [no] shutdown
            - trap-gen
                - [no] probe-fail-enable
                - [no] probe-fail-threshold 0..15
                - [no] test-completion-enable
                - [no] test-fail-enable
                - [no] test-fail-threshold 0..15
            - [no] type
                - cpe-ping service service-id destination ip-address source ip-address [source-mac ieee-address] [fc fc-name ][ttl vc-label-ttl] [send-count send-count] [return-control] [interval interval]
                - dns target-addr dns-name name-server ip-address [source ip-address] [send-count send-count] [timeout timeout] [interval interval]
                - eth-cfm-linktrace mac-address mep mep-id domain md-index association 	ma-index [ttl ttl-value] [fc {fc-name}] [count send-count] [timeout timeout] 		[interval interval] [record-type {ipv4-a-record|ipv6-aaaa-record}]
                - eth-cfm-loopback mac-address mep mep-id domain md-index association ma-index [size data-size] [fc {fc-name}] [count send-count ][timeout timeout] [interval interval]
                - eth-cfm-two-way-delay mac-address mep mep-id domain md-index association ma-index [fc {fc-name}][count send-count ][timeout timeout] [interval interval]
                - eth-cfm-two-way-slm mac-address mep mep-id domain md-index association ma-index [fc fc-name] [count send-count] [size data-size] [timeout timeout] [interval interval]
                - icmp-ping [ip-address | dns-name] [rapid | detail] [ttl time-to-live] [tos type-of-service] [size bytes] [pattern pattern] [source ip-address] [interval seconds] [{next-hop ip-address}|{interface interface-name}|bypass-routing] [count
requests] [do-not-fragment] [router-instance | service- name service- name] [timeout timeout]fc {fc-name}
                - icmp-trace [ip-address | dns-name] [ttl time-to-live] [wait milli-seconds] [source ip-address] [tos type-of-service][router-instance | service-name service- name]
                - lsp-ping bgp-label-prefix ip-prefix/mask [src-ip-address ip-address]
[fc fc-name] [size octets] [ttl label-ttl] [send-count send-count] [timeout timeout] [interval interval] [path-destination ip-address [interface if-name | next-hop ip-address]]
                - lsp-ping {{lsp-name [path path-name]}|{prefix ip-prefix/mask}} [src-ip-address ip-address] [size octets] [ttl label-ttl] [timeout timeout] [interval interval] [fc fc-name] [send-count send-count] {lsp-name [path
path-name]} [fc fc-name] [size octets][ttl label-ttl] [send-count send-count] [timeout timeout] [interval interval]
                - lsp-trace bgp-label-prefix ip-prefix/mask [src-ip-address ip-address]
[fc fc-name] [max-fail no-response-count] [probe-count probes-per-hop] [size octets] [min-ttl min-label-ttl] [max-ttl max-label-ttl] [timeout timeout] [interval interval] [path-destination ip-address [interface if-name | next-hop ip-address]] [downstream-map-tlv dsmap | ddmap | none] [detail]
                - lsp-trace {lsp-name [path path-name]} [fc fc-name] [max-fail no-response-count] [probe-count probes-per-hop] [size octets] [min-ttl min-label-ttl] [max-ttl max-label-ttl] [src-ip-address ip-address] [timeout timeout] [interval interval]
                - mac-ping service service-id destination dst ieee-address  [source  src-ieee-address] [fc fc-name] [size octets] [ttl vc-label-ttl] [send-count send-count] [send-control] [return-control] [interval interval] [timeout timeout]
                - mac-trace service  service-id destination ieee-address  [source  src-ieee-address] [fc fc-name] [size octets]] [min-ttl min-label-ttl] [max-ttl max-label-ttl] [send-count send-count] [send-control] [return-control] [interval interval] [timeout
timeout]
                - sdp-ping orig-sdp-id [resp-sdp resp-sdp-id] [fc fc-name]] [size octets] [send-count send-count][timeout seconds] [interval seconds]
                - vccv-ping sdp-id:vc-id [src-ip-address ip-addr dst-ip-address ip-addr pw-id pw-id][reply-mode {ip-routed | control-channel}][fc fc-name [size octets] [send-count send-count][timeout timeout] [interval interval][ttl vc-label-ttl]
                - vccv-trace sdp-id:vc-id [size octets][min-ttl vc-label-ttl] [max-ttl vc-label-ttl][max-fail no-response-count][probe-count probe-count][reply-mode ip-routed|control-channel][timeout timeout-value][interval interval-value][fc fc-name ][detail]
                - vprn-ping service-id service svc-name [src-ip-address ip-addr dst-ip-address ip-addr [fc fc-name [profile in | out]] [size size] [ttl vc-label-ttl] [count send-count] [return-control] [timeout timeout] [interval seconds]
                - vprn-trace service-id source src-ip destination dst-ip  [fc fc-name [profile in | out]] [size size] [min-ttl vc-label-ttl] [max-ttl vc-label-ttl] [count send-count] [return-control] [timeout timeout] [interval interval]
Show commands
show
    - eth-cfm
        - association [ma-index] [detail]
        - cfm-stack-table [port [port-id [vlan qtag[.qtag]]| sdp sdp-id[:vc-id]][level 0..7] [direction up | down]
        - domain [md-index] [association ma-index | all-associations] [detail]
        - mep mep-id domain md-index association ma-index [loopback] [linktrace] [eth-bandwidth-notification]
        - mep mep-id domain md-index association ma-index [remote-mepid mep-id | all-remote-mepids]
        - mep mep-id domain md-index association ma-index eth-test-results [remote-peer mac-address]
        - mep mep-id domain md-index association ma-index one-way-delay-test [remote-peer mac-address]
        - mep mep-id domain md-index association ma-index two-way-delay-test [remote-peer mac-address]
        - mep mep-id domain md-index association ma-index two-way-slm-test [remote-peer mac-address]
        - mip
        - statistics
        - system-config
    - router
        - twamp-light
    - saa [test-name [owner test-owner]]
    - service service-id
        - twamp-light
    - test-oam
        - ldp-treetrace [prefix ip-prefix/mask] [detail]
        - twamp
            - twamp-light
                - reflectors
            - server all
            - server prefix ip-prefix/mask
            - server
show
    - oam-pm
        - bin-group [bin-group-number]
        - bin-group-using [bin-group bin-group-number]
        - session session-name [{all | base | bin-group | event-mon | meas-interval}]
        - sessions [test-family {ethernet | ip}] [event-mon]
        - statistics
            - session session-name
                - dmm
                    - meas-interval raw [{all | bins | summary}]
                    - meas-interval {5-mins | 15-mins | 1-hour | 1-day} interval-number interval-number [{all | bins | summary}]
                - slm
                    - meas-interval raw
                    - meas-interval {5-mins | 15-mins | 1-hour | 1-day} interval-number interval-number
                - twamp-light
                    - meas-interval raw delay [{all | bins | summary}]
                    - meas-interval raw [loss]
                    - meas-interval {5-mins | 15-mins | 1-hour | 1-day} interval-number interval-number delay [{all | bins | summary}]
                    - meas-interval {5-mins | 15-mins | 1-hour | 1-day} interval-number interval-number loss
Monitor commands
monitor
    - oam-pm
        - session session-name [{dmm | slm | twamp-light}]
Clear commands
Command descriptions
Operational commands
shutdown
Syntax
[no] shutdown
Context
config>saa>test
Platforms
Supported on all 7210 SAS platforms as described in this document.
Description
This command shuts down a test. To modify an existing test it must first be shut down. When a test is created it is in shutdown mode until a no shutdown command is executed.
A shutdown can only be performed if a test is not executing at the time the command is entered.
The no form of this command sets the state of the test to operational.
shutdown
Syntax
[no] shutdown
Context
config>test-oam>ldp-treetrace
config>test-oam>twamp>server
config>test-oam>twamp>server>prefix
Platforms
Supported on all 7210 SAS platforms as described in this document
Description
This command suspends the background process running the LDP ECMP OAM tree discovery and path probing features. The configuration is not deleted.
The no form of this command enables the background process.
shutdown
Syntax
[no] shutdown
Context
config>oam-pm>bin-group
config>oam-pm>session>ethernet>dmm
config>oam-pm>session>ethernet>slm
config>oam-pm>session>ip>twamp-light
config>oam-pm>session>measurement-interval>event-mon
config>saa>test
config>test-oam>ldp-treetrace
config>test-oam>mpls-dm
config>test-oam>twamp>server
config>test-oam>twamp>server>prefix
Platforms
Supported on all 7210 SAS platforms as described in this document, including platforms configured in the access-uplink operating mode
Description
This command administratively disables an entity. When disabled, an entity does not change, reset, or remove any configuration settings or statistics.
The operational state of the entity is disabled as well as the operational state of any entities contained within. Many objects must be shut down before they may be deleted.
Entities are created in the administratively down (shutdown) state. When a no shutdown command is entered, the entity becomes administratively up and then tries to enter the operationally up state.
The no form of this command administratively enables the entity.
dns
Syntax
dns target-addr dns-name name-server ip-address [source ip-address] [count send-count] [timeout timeout] [interval interval] [record-type {ipv4-a-record | ipv6-aaaa-record}]
Context
oam
Platforms
Supported on all 7210 SAS platforms as described in this document, including platforms configured in the access-uplink operating mode
Description
This command performs DNS name resolution. If ipv4-a-record is specified, DNS names are queried for A-records only.
Parameters
- send-count send-count
Specifies the number of messages to send, expressed as a decimal integer. The send-count parameter is used to override the default number of message requests sent. Each message request must either timeout or receive a reply before the next message request is sent. The message interval value must be expired before the next message request is sent.
- ip-address
Specifies the IP or IPv6 address of the primary DNS server.
- timeout timeout
Specifies the timeout parameter in seconds, expressed as a decimal integer. This value is used to override the default timeout value and is the amount of time that the router waits for a message reply after sending the message request. Upon the expiration of message timeout, the requesting router assumes that the message response has not been received. Any response received after the request times out is silently discarded.
- interval interval
Specifies the interval parameter in seconds, expressed as a decimal integer. This parameter is used to override the default request message send interval and defines the minimum amount of time that must expire before the next message request is sent.
If the interval is set to 1 second, and the timeout value is set to 10 seconds, the maximum time between message requests is 10 seconds and the minimum is 1 second. This depends upon the receipt of a message reply corresponding to the outstanding message request.
- record-type
Specifies a record type.
ping
Syntax
ping [ip-address | dns-name] [rapid | detail] [ttl time-to-live] [tos type-of-service] [size bytes] [pattern pattern] [source ip-address | dns-name] [interval seconds] [{next-hop ip-address} | {interface interface-name} | bypass-routing] [count requests] [do-not-fragment] [router router-instance | service-name service-name] [timeout timeout]
Context
<GLOBAL>
Platforms
Supported on all 7210 SAS platforms as described in this document, including platforms configured in the access-uplink operating mode
Description
This command verifies the reachability of a remote host.
Parameters
- ip-address
-
Specifies the far-end IP address to which to send the sve-ping request message in dotted-decimal notation.
Note:IPv6 is supported only for the "Management" instance of the router.
- dns-name
Specifies the DNS name of the far-end device to which to send the sve-ping request message, expressed as a character string.
- rapid
Packets are generated as fast as possible instead of the default 1 per second.
- detail
Specifies detailed information.
- ttl time-to-live
Specifies the TTL value for the MPLS label, expressed as a decimal integer.
- tos type-of-service
Specifies the service type.
- size bytes
Specifies the request packet size in bytes, expressed as a decimal integer.
- pattern pattern
Specifies that the date portion in a ping packet is filled with the pattern value specified. If not specified, position info is filled instead.
- source ip-address
-
Specifies the IP address to be used.
Note:IPv6 is supported only for the "Management" instance of the router.
- router router-instance
Specifies the router name or service ID.
- service-name service-name
Specifies the service name as an integer or string.
- bypass-routing
Specifies whether to send the ping request to a host on a directly attached network bypassing the routing table.
- interface interface-name
Specifies the name of an IP interface. The name must already exist in the config>router>interface context.
- next-hop ip-address
Only displays static routes with the specified next hop IP address.
Note:IPv6 is supported only for the "Management" instance of the router.
- interval seconds
Specifies the interval parameter in seconds, expressed as a decimal integer. This parameter is used to override the default request message send interval and defines the minimum amount of time that must expire before the next message request is sent.
If the interval is set to 1 second, and the timeout value is set to 10 seconds, the maximum time between message requests is 10 seconds and the minimum is 1 second. This depends upon the receipt of a message reply corresponding to the outstanding message request.
- count requests
Specifies the number of times to perform an OAM ping probe operation. Each OAM echo message request must either timeout or receive a reply before the next message request is sent.
- do-not-fragment
Sets the DF (Do Not Fragment) bit in the ICMP ping packet.
- fc-name
Specifies the forwarding class of the MPLS echo request encapsulation.
- timeout seconds
Overrides the default timeout value and is the amount of time that the router waits for a message reply after sending the message request. Upon the expiration of message timeout, the requesting router assumes that the message response has not been received. A ‛request timeout’ message is displayed by the CLI for each message request sent that expires. Any response received after the request times out is silently discarded.
traceroute
Syntax
traceroute [ip-address | dns-name] [ttl ttl] [wait milli-seconds] [no-dns] [source ip-address] [tos type-of-service] [router router-instance | service- name service- name]
Context
<GLOBAL>
Platforms
Supported on all 7210 SAS platforms as described in this document, including platforms configured in the access-uplink operating mode
Description
This command determines the route to a destination address. DNS lookups of the responding hosts is enabled by default.
*A:ALA-1# traceroute 192.168.xx.xx4
traceroute to 192.168.xx.xx4, 30 hops max, 40 byte packets
 1  192.168.xx.xx4 0.000 ms  0.000 ms  0.000 ms
*A:ALA-1#
Parameters
- ip-address
Specifies the far-end IP address to which to send the traceroute request message in dotted decimal notation.
Note:IPv6 is supported only for the "Management" instance of the router.
- dns-name
Specifies the DNS name of the far-end device to which to send the traceroute request message, expressed as a character string.
- ttl ttl
Specifies the maximum Time-To-Live (TTL) value to include in the traceroute request, expressed as a decimal integer.
- wait milliseconds
Specifies the time in milliseconds to wait for a response to a probe, expressed as a decimal integer.
- no-dns
When the no-dns keyword is specified, DNS lookups of the responding hosts are not performed. Only the IP addresses is printed.
- source ip-address
Specifies the source IP address to use as the source of the probe packets in dotted-decimal notation. If the IP address is not one of the device’s interfaces, an error is returned.
- tos type-of-service
Specifies the type-of-service (TOS) bits in the IP header of the probe packets, expressed as a decimal integer.
- router router-name
Specifies the alphanumeric character string up to 32 characters.
- service-name service-name
Specifies the service name as an integer or string.
lsp-ping
Syntax
lsp-ping lsp-name [path path-name]
lsp-ping bgp-label prefix ip-prefix/mask [path-destination ip-address [interface if-name | next-hop ip-address]]
lsp-ping prefix ip-prefix/mask [path-destination ip-address [interface if-name | next-hop ip-address]] [src-ip-address ip-address]
lsp-ping {{lsp-name [path path-name]}|{prefix ip-prefix/mask}} [src-ip-address ip-address] [size octets] [ttl label-ttl] [timeout timeout] [interval interval] [fc fc-name] [send-count send-count] {lsp-name [path path-name]} [fc fc-name] [size octets][ttl label-ttl] [send-count send-count] [timeout timeout] [interval interval]
lsp-ping static lsp-name [assoc-channel ipv4|none|non-ip] [force] [dest-global-id global-id dest-node-id node-id] [path-type active | working | protect]
Options common to all lsp-ping cases: [detail] [fc fc-name] [interval interval] [send-count send-count] [size octets] [src-ip-address ip-address] [timeout timeout] [ttl label-ttl]
Context
oam
config>saa>test>type
Platforms
Supported on all 7210 SAS platforms as described in this document
Description
This command performs in-band LSP connectivity tests.
The lsp-ping command performs an LSP ping using the protocol and data structures defined in the RFC 4379, Detecting Multi-Protocol Label Switched (MPLS) Data Plane Failures.
The LSP ping operation is modeled after the IP ping utility which uses ICMP echo request and reply packets to determine IP connectivity.
In an LSP ping, the originating device creates an MPLS echo request packet for the LSP and path to be tested. The MPLS echo request packet is sent through the data plane and awaits an MPLS echo reply packet from the device terminating the LSP. The status of the LSP is displayed when the MPLS echo reply packet is received.
This command, when used with the static option, performs in-band on-demand LSP connectivity verification tests for static MPLS-TP LSPs. For other LSP types, the static option should be excluded and these are described elsewhere in this guide.
The lsp-ping static command performs an LSP ping using the protocol and data structures defined in the RFC 4379, Detecting Multi-Protocol Label Switched (MPLS) Data Plane Failures, as extended by RFC 6426, MPLS On-Demand Connectivity Verification and Route Tracing.
In MPLS-TP, the echo request and echo reply messages are always sent in-band over the LSP, either in a G-ACh channel or encapsulated as an IP packet below the LSP label.
The timestamp format to be sent, and to be expected when received in a PDU, is as configured by the config>test-oam>mpls-time-stamp-format command. If RFC 4379 is selected, the timestamp is in seconds and microseconds since 1900, otherwise it is in seconds and microseconds since 1970.
Parameters
- lsp-name
Specifies the name that identifies an LSP to ping. The LSP name can be up to 32 characters.
- dest-global-id global-id
Specifies the MPLS-TP global ID for the far end node of the LSP under test. If this is not entered, the dest-global-id is taken from the LSP context.
- dest-node-id node-id
Specifies the MPLS-TP global ID for the far end node of the LSP under test. If this is not entered, the dest-global-id is taken from the LSP context.
- control-channel {none | non-ip}
Specifies the encapsulation format to use for the LSP Ping echo request and echo reply packet.
- force
Allows LSP Ping to test a path that is operationally down, including cases where MPLS-TP BFD CC/V is enabled and has taken a path down. This parameter is only allowed in the OAM context; it is not allowed for a test configured as a part of an SAA.
- path-type {active | working | protect}
The LSP path to test.
- path path-name
Specifies the LSP path name along which to send the LSP ping request.
- bgp-label-prefix ip-prefix/mask
Specifies the address prefix and subnet mask of the target BGP IPv4 label route.
- src-ip-address ip-addr
Specifies the source IP address. This option is used when an OAM packet must be generated from a different address than the node’s system interface address. An example is when the OAM packet is sent over an LDP LSP and the LDP LSR-ID of the corresponding LDP session to the next-hop is set to an address other than the system interface address.
- fc fc-name
Specifies the fc parameter is used to indicate the forwarding class of the MPLS echo request packet.
When an MPLS echo request packet is generated in CPM and is forwarded to the outgoing interface, the packet is queued in the egress network queue corresponding to the specified fc parameter value. The marking of the packet's EXP is dictated by the LSP-EXP mappings on the outgoing interface.
When the MPLS echo request packet is received on the responding node, the fc parameter value is dictated by the LSP-EXP mappings of the incoming interface.
When an MPLS echo reply packet is generated in CPM and is forwarded to the outgoing interface, the packet is queued in the egress network queue corresponding to the fc parameter value determined by the classification of the echo request packet, which is being replied to, at the incoming interface. The marking of the packet's EXP is dictated by the LSP-EXP mappings on the outgoing interface. The TOS byte is not modified. The following table summarizes this behavior:
Table 12. Request packet and behavior Node Packet and description of behavior cpm (sender node)
echo request packet:
packet{tos=1, fc1
fc1 is as entered by user in OAM command or default values
tos1 as per mapping of fc1 to IP precedence in network egress QoS policy of outgoing interface
outgoing interface (sender node)
echo request packet:
pkt queued as fc1
ToS field=tos1 not remarked
EXP=exp1, as per mapping of fc1 to EXP in network egress QoS policy of outgoing interface
Incoming interface (responder node)
echo request packet:
packet{tos1, exp1}
exp1 mapped to fc2 as per classification in network QoS policy of incoming interface
cpm (responder node)
echo reply packet:
packet{tos=1, fc2
outgoing interface (responder node)
echo reply packet:
pkt queued as fc2
ToS filed= tos1 not remarked (reply in-band or out-of-band)
EXP=exp2, if reply is in-band, remarked as per mapping of fc2 to EXP in network egress QoS policy of outgoing interface
Incoming interface (sender node)
echo reply packet:
packet{tos1, exp2}
exp2 mapped to fc1 as per classification in network QoS policy of incoming interface
The LSP-EXP mappings on the receive network interface controls the mapping of the message reply back at the originating router.be
- src-ip-address ip-addr
Specifies the source IP address. This parameter is used when an OAM packet must be generated from a different address than the node's system interface address. For example, when the OAM packet is sent over an LDP LSP and the LDP LSR-ID of the corresponding LDP session to the next-hop is set to an address other than the system interface address.
- size octets
Specifies the MPLS echo request packet size in octets, expressed as a decimal integer. The request payload is padded with zeros to the specified size.
- ttl label-ttl
Specifies the TTL value for the MPLS label, expressed as a decimal integer.
- send-count send-count
Specifies the number of messages to send, expressed as a decimal integer. The send-count parameter is used to override the default number of message requests sent. Each message request must either timeout or receive a reply before the next message request is sent. The message interval value must be expired before the next message request is sent.
- time-out interval
Specifies the time-out parameter in seconds, expressed as a decimal integer. This value is used to override the default timeout value and is the amount of time that the router waits for a message reply after sending the last probe for a particular test. Upon the expiration of timeout the test is marked complete and no more packets are processed for any of those request probes.
- interval interval
Specifies the interval parameter in seconds, expressed as a decimal integer. This parameter is used to override the default request message send interval and defines the minimum amount of time that must expire before the next message request is sent.
- path-destination ip-address
Specifies the IP address of the path destination from the range 127/8.
- interface interface-name
Specifies the name of an IP interface. The name must already exist in the config>router>interface context.
- next-hop ip-address
Only displays static routes with the specified next hop IP address.
- prefix ip-prefix/mask
Specifies the address prefix and subnet mask of the target BGP IPv4 label route.
- static lsp-name
Specifies an LSP ping route using the RFC 6426, MPLS On-Demand Connectivity Verification and Route Tracing, Target FEC Stack code point Static LSP.
- assoc-channel ipv4 | none | non-ip
Specifies the launched echo request’s usage of the Associated Channel (ACH) mechanism, when testing an MPLS-TP LSP.
- dest-global-id global-id
Specifies the source MPLS-TP global identifier of the replying node. The value is copied from the reply’s RFC 6426 Source Identifier TLV.
- dest-node-id node-id
Specifies the target MPLS-TP Node Identifier.
- path-type active | working | protect
Specifies the type of an MPLS TP path.
Output
Sample outputA:DUTA# oam lsp-ping prefix 10.4.4.4/32 detail
LSP-PING 10.4.4.4/32: 80 bytes MPLS payload
Seq=1, send from intf dut1_to_dut3, reply from 10.4.4.4
udp-data-len=32 ttl=255 rtt=5.23ms rc=3 (EgressRtr)
---- LSP 4.4.4.4/32 PING Statistics ----
1 packets sent, 1 packets received, 0.00% packet loss
round-trip min = 5.23ms, avg = 5.23ms, max = 5.23ms, stddev = 0.000ms
===============================================================================
LDP LSR ID: 1.1.1.1
===============================================================================
Legend: U - Label In Use, N - Label Not In Use, W - Label Withdrawn
WP - Label Withdraw Pending, BU - Alternate For Fast Re-Route
===============================================================================
LDP Prefix Bindings
===============================================================================
Prefix IngLbl EgrLbl EgrIntf/ EgrNextHop
Peer LspId
-------------------------------------------------------------------------------
10.4.4.4/32 131069N 131067 1/1/1 1.3.1.2
3.3.3.3
10.4.4.4/32 131069U 131064 -- --
6.6.6.6
-------------------------------------------------------------------------------
No. of Prefix Bindings: 2
===============================================================================
A:DUTA#
lsp-trace
Syntax
lsp-trace lsp-name [path path-name]
lsp-trace bgp-label prefix ip-prefix/mask [path-destination ip-address [interface if-name | next-hop ip-address]]
lsp-trace prefix ip-prefix/mask [path-destination ip-address [interface if-name | next-hop ip-address]]
lsp-trace static lsp-name [assoc-channel ipv4|none|non-ip] [path-type active | working | protect]
Options common to all lsp-trace cases: [detail] [downstream-map-tlv {dsmap | ddmap | none}] [fc fc-name] [interval interval] [max-fail no-response-count] [max-ttl max-label-ttl] [min-ttl min-label-ttl] [probe-count probes-per-hop] [size octets] [src-ip-address ip-address] [timeout timeout]
Context
oam
config>saa>test>type
Platforms
Supported on all 7210 SAS platforms as described in this document
Description
This command, when used with the static option, performs in-band on-demand LSP traceroute tests for static MPLS-TP LSPs. For other LSP types, the static option should be excluded and these are described elsewhere in this guide.
The lsp-trace static command performs an LSP trace using the protocol and data structures defined in the RFC 4379, Detecting Multi-Protocol Label Switched (MPLS) Data Plane Failures, as extended by RFC 6426, MPLS On-Demand Connectivity Verification and Route Tracing.
The LSP trace operation is modeled after the IP traceroute utility which uses ICMP echo request and reply packets with increasing TTL values to determine the hop-by-hop route to a destination IP.
In an LSP trace, the originating device creates an MPLS echo request packet for the LSP to be tested with increasing values of the TTL in the outermost label. The MPLS echo request packet is sent through the data plane and awaits a TTL exceeded response or the MPLS echo reply packet from the device terminating the LSP. The devices that reply to the MPLS echo request packets with the TTL exceeded and the MPLS echo reply are displayed.
The downstream mapping TLV is used in lsp-trace to provide a mechanism for the sender and responder nodes to exchange and validate interface and label stack information for each downstream hop in the path of the LDP FEC or an RSVP LSP, or a BGP IPv4 label route.
Two downstream mapping TLVs are supported. The original Downstream Mapping (DSMAP) TLV defined in RFC 4379 and the new Downstream Detailed Mapping (DDMAP) TLV defined in RFC 6424. More details are provided in the following DDMAP TLV sub-section.
In addition, when the responder node has multiple equal cost next-hops for an LDP FEC or a BGP label IPv4 prefix, it replies in the Downstream Mapping TLV with the downstream information for each outgoing interface which is part of the ECMP next-hop set for the prefix. The downstream mapping TLV can further be used to exercise a specific path of the ECMP set using the path-destination option.
In MPLS-TP, the echo request and echo reply messages are always sent in-band over the LSP, either in a G-ACh channel or encapsulated as an IP packet below the LSP label.
Some restrictions apply when using this feature on 7210 nodes. LSP diagnostics: LSP ping and trace
Parameters
- lsp-name
Specifies the name that identifies an LSP to ping. The LSP name can be up to 32 characters.
- path path-name
Specifies the LSP path name along which to send the LSP trace request.
- control-channel {none | non-ip}
Specifies the encapsulation format to use for the MPLS echo request and echo reply packet.
- size octets
Specifies the size in octets, expressed as a decimal integer, of the MPLS echo request packet, including the IP header but not the label stack. The request payload is padded with zeros to the specified size. Note that an OAM command is not failed if the user entered a size lower than the minimum required to build the packet for the echo request message. The payload is automatically padded to meet the minimum size.
- src-ip-address ip-addr
Specifies the source IP address. This option is used when an OAM packet must be generated from a different address than the node’s system interface address. An example is when the OAM packet is sent over an LDP LSP and the LDP LSR-ID of the corresponding LDP session to the next-hop is set to an address other than the system interface address.
- min-ttl min-label-ttl
Specifies the minimum TTL value in the MPLS label for the LSP trace test, expressed as a decimal integer.
- max-ttl max-label-ttl
Specifies the maximum TTL value in the MPLS label for the LDP treetrace test, expressed as a decimal integer.
- max-fail no-response-count
Specifies the maximum number of consecutive MPLS echo requests, expressed as a decimal integer that do not receive a reply before the trace operation fails for a specific TTL.
- probes-per-hop
Specifies the number of messages to send, expressed as a decimal integer. The send-count parameter is used to override the default number of message requests sent. Each message request must either timeout or receive a reply before the next message request is sent. The message interval value must be expired before the next message request is sent.
- timeout timeout
Specifies the timeout parameter in seconds, expressed as a decimal integer. This value is used to override the default timeout value and is the amount of time that the router waits for a message reply after sending the message request. Upon the expiration of message timeout, the requesting router assumes that the message response has not been received. A ‛request timeout’ message is displayed by the CLI for each message request sent that expires. Any response received after the request times out is silently discarded.
- interval interval
Specifies the interval parameter in seconds, expressed as a decimal integer. This parameter is used to override the default request message send interval and defines the minimum amount of time that must expire before the next message request is sent.
If the interval is set to 1 second, and the timeout value is set to 10 seconds, the maximum time between message requests is 10 seconds and the minimum is 1 second. This depends upon the receipt of a message reply corresponding to the outstanding message request.
- fc fc-name
Specifies the fc parameter used to indicate the forwarding class of the MPLS echo request packet.
When an MPLS echo request packet is generated in CPM and is forwarded to the outgoing interface, the packet is queued in the egress network queue corresponding to the specified fc parameter value. The marking of the packet's EXP is dictated by the LSP-EXP mappings on the outgoing interface.
When the MPLS echo request packet is received on the responding node, The fc parameter value is dictated by the LSP-EXP mappings of the incoming interface.
When an MPLS echo reply packet is generated in CPM and is forwarded to the outgoing interface, the packet is queued in the egress network queue corresponding to the fc parameter value determined by the classification of the echo request packet, which is being replied to, at the incoming interface. The marking of the packet's EXP is dictated by the LSP-EXP mappings on the outgoing interface. The TOS byte is not modified. The following table summarizes this behavior:
Table 13. Request packet and behavior Node Packet and description cpm (sender node)
echo request packet:
packet{tos=1, fc1
fc1 is as entered by user in OAM command or default values
tos1 as per mapping of fc1 to IP precedence in network egress QoS policy of outgoing interface
outgoing interface (sender node)
echo request packet:
pkt queued as fc1
ToS field=tos1 not remarked
EXP=exp1, as per mapping of fc1 to EXP in network egress QoS policy of outgoing interface
Incoming interface (responder node)
echo request packet:
packet {tos1, exp1}
exp1 mapped to fc2 as per classification in network QoS policy of incoming interface
cpm (responder node)
echo reply packet:
packet {tos=1, fc2
outgoing interface (responder node)
echo reply packet:
pkt queued as fc2
ToS filed= tos1 not remarked (reply in-band or out-of-band)
EXP=exp2, if reply is in-band, remarked as per mapping of fc2 to EXP in network egress QoS policy of outgoing interface
Incoming interface (sender node)
echo reply packet:
packet {tos1, exp2}
exp2 mapped to fc1 as per classification in network QoS policy of incoming interface
- path-destination ip-address
Specifies the IP address of the path destination from the range 127/8.
- interface interface-name
Specifies the name of an IP interface. The name must already exist in the config>router>interface context.
- downstream-map-tlv {dsmap | ddmap | none}
Specifies which format of the downstream mapping TLV to use in the LSP trace packet. The DSMAP TLV is the original format in RFC 4379. The DDMAP is the new enhanced format specified in RFC 6424. The user can also choose not to include the downstream mapping TLV by entering the value none. When lsp-trace is used on a MPLS-TP LSP (static option), it can only be executed if the control-channel is set to none. In addition, the DSMAP/DDMAP TLV is only included in the echo request message if the egress interface is either a numbered IP interface, or an unnumbered IP interface. The TLV is not included if the egress interface is of type unnumbered-mpls-tp.
Output
Sample output: lsp-trace
*A:Dut-A# oam lsp-trace prefix 10.20.1.6/32 downstream-map-tlv ddmap path-
destination 127.0.0.1 detail lsp-trace to 10.20.1.6/
32: 0 hops min, 0 hops max, 152 byte packets
1  10.20.1.2  rtt=3.44ms rc=8(DSRtrMatchLabel) rsc=1
     DS 1: ipaddr=127.0.0.1 ifaddr=0 iftype=ipv4Unnumbered MRU=1500
           label[1]=131070 protocol=3(LDP)
2  10.20.1.4  rtt=4.65ms rc=8(DSRtrMatchLabel) rsc=1
     DS 1: ipaddr=127.0.0.1 ifaddr=0 iftype=ipv4Unnumbered MRU=1500
           label[1]=131071 protocol=3(LDP)
3  10.20.1.6  rtt=7.63ms rc=3(EgressRtr) rsc=1
*A:Dut-A#


*A:Dut-C# oam lsp-trace "p_1" detail
lsp-trace to p_1: 0 hops min, 0 hops max, 116 byte packets
1  10.20.1.2  rtt=3.46ms rc=8(DSRtrMatchLabel)
     DS 1: ipaddr 10.20.1.4 ifaddr 3 iftype 'ipv4Unnumbered' MRU=1500
label=131071 proto=4(RSVP-TE)
2  10.20.1.4  rtt=3.76ms rc=8(DSRtrMatchLabel)
     DS 1: ipaddr 10.20.1.6 ifaddr 3 iftype 'ipv4Unnumbered' MRU=1500
label=131071 proto=4(RSVP-TE)
3  10.20.1.6  rtt=5.68ms rc=3(EgressRtr)
*A:Dut-C#
A:DUTA#
A:DUTA# oam lsp-trace prefix 10.5.5.5/32 detail
lsp-trace to 10.5.5.5/32: 0 hops min, 0 hops max, 104 byte packets
1  6.6.6.6  rtt=2.45ms rc=8(DSRtrMatchLabel)
     DS 1: ipaddr=10.6.5.1 ifaddr=10.6.5.1 iftype=ipv4Numbered MRU=1564
label=131071 proto=3(LDP)
2  5.5.5.5  rtt=4.77ms rc=3(EgressRtr)
A:DUTA#
*A:Dut-A# oam lsp-trace prefix 10.20.1.6/32 downstream-map-tlv ddmap path-
destination 127.0.0.1 detail lsp-trace to 10.20.1.6/
32: 0 hops min, 0 hops max, 152 byte packets
1  10.20.1.2  rtt=3.44ms rc=8(DSRtrMatchLabel) rsc=1
     DS 1: ipaddr=127.0.0.1 ifaddr=0 iftype=ipv4Unnumbered MRU=1500
           label[1]=131070 protocol=3(LDP)
2  10.20.1.4  rtt=4.65ms rc=8(DSRtrMatchLabel) rsc=1
     DS 1: ipaddr=127.0.0.1 ifaddr=0 iftype=ipv4Unnumbered MRU=1500
           label[1]=131071 protocol=3(LDP)
3  10.20.1.6  rtt=7.63ms rc=3(EgressRtr) rsc=1
*A:Dut-A#

*A:Dut-A# oam ldp-treetrace prefix 10.20.1.6/32

ldp-treetrace for Prefix 10.20.1.6/32:

         127.0.0.1, ttl =   3 dst =      127.1.0.255 rc = EgressRtr status = Done
    Hops:         127.0.0.1         127.0.0.1

         127.0.0.1, ttl =   3 dst =      127.2.0.255 rc = EgressRtr status = Done
    Hops:         127.0.0.1         127.0.0.1

ldp-treetrace discovery state: Done
ldp-treetrace discovery status: ' OK '
Total number of discovered paths: 2
Total number of failed traces: 0
p2mp-lsp-ping
Syntax
p2mp-lsp-ping {{lsp-name p2mp-instance instance-name s2l-dest-addr ip-address…[ip-address...up to 5] [ttl label-ttl]} | {ldp p2mp-id [sender-addr ip-address] [leaf-addr ip-address…[ip-address…up to 5 ]}} [fc fc-name] [size octets] [timeout timeout] [interval interval] [detail]
Context
oam
Platforms
7210 SAS-Mxp, 7210 SAS-R6, 7210 SAS-R12, 7210 SAS-Sx/S 1/10GE (standalone and standalone-VC), and 7210 SAS-T
Description
This command performs an in-band connectivity test for an RSVP P2MP LSP.
The echo request message is sent on the active P2MP instance and is replicated in the datapath over all branches of the P2MP LSP instance. By default, all egress LER nodes that are leaves of the P2MP LSP instance reply to the echo request message.
The user can reduce the scope of the echo reply messages by explicitly entering a list of addresses for the egress LER nodes that are required to reply. A maximum of 5 addresses can be specified in a single run of the p2mp-lsp-ping command. An LER node parses the list of egress LER addresses, and if its address is included, it replies with an echo reply message.
The display is delayed until all responses are received or the timer configured in the timeout parameter expires. Entering other CLI commands while waiting for the display is not allowed. Use control-C (^C) to stop the ping operation.
Parameters
- fc fc-name
Specifies the forwarding class of the MPLS echo request packet.
When an MPLS echo request packet is generated in CPM and forwarded to the outgoing interface, the packet is queued in the egress network queue corresponding to the specified fc parameter value. The LSP-EXP mappings on the outgoing interface dictate the marking of the packet EXP bits.
When the MPLS echo request packet is received on the responding node, the LSP-EXP mappings of the incoming interface determine the fc parameter value.
When an MPLS echo reply packet is generated in CPM and forwarded to the outgoing interface, the packet is queued in the egress network queue corresponding to the fc parameter value determined by the classification of the echo request packet, which is being replied to, at the incoming interface. The LSP-EXP mappings on the outgoing interface dictate the marking of the packet EXP bits.
- p2mp-instance instance-name
Configures the name of the P2MP LSP instance to send the echo request, up to 32 characters.
- p2mp-lsp-ping lsp-name
Specifies the name for the P2MP LSP, up to 32 characters, to ping.
- s2l-dest-addr ip-address
Specifies the egress LER system address of the S2L sub-LSP path that is being traced.
- size octets
Specifies the size in octets, expressed as a decimal integer, of the MPLS echo request packet, including the IP header but not the label stack. The request payload is padded with zeros to the specified size. The OAM command does not fail if the size entered is lower than the minimum number of octets required to build the packet for the echo request message. The payload is automatically padded to meet the minimum size.
- ttl label-ttl
Specifies the TTL value for the MPLS label, expressed as a decimal integer.
- ldp p2mp-id
Specifies the identifier of the LDP P2MP LSP to ping, expressed as a 32-bit integer.
- sender-addr ip-address
Optional parameter to specify root-node address. If omitted, the system IP address is used.
- leaf-addr ip-address…[ip-address…up to 5]
Specifies the list of egress LER system addresses that are required to reply to an LSP ping echo request message.
- timeout timeout
Specifies the timeout parameter, in seconds, expressed as a decimal integer. This value is used to override the default timeout value and is the length of time that the router waits for an echo reply message from all leaves of the P2MP LSP after sending the message request message. When message timeout expires, the requesting router assumes that the missing replies are not received. Any echo reply message received after the request times out is silently discarded.
- detail
If the detail parameter is omitted, the command output provides a high-level summary of error and success codes received. If the detail parameter is specified, the command output displays a line for each replying node, similar to the output of the LSP ping for a P2P LSP.
Output
The following sample output is an example of P2MP LSP ping information.
Sample output*A:Dut-C# oam lsp-ping A2F_3
LSP-PING A2F_3: 92 bytes MPLS payload
Total S2L configured/up/responded = 400/390/388, round-trip min/avg/max = <10/10/
11 ms
Responses based on return code:
EgressRtr(3) = 387
NoFecMapping(4) = 1
Note: Missing responses on UP S2Ls implies "request timeout"
*A:Dut-A#
*A:Dut-C# oam lsp-ping A2F_3 detail
LSP-PING A2F_3: 92 bytes MPLS payload
=============================================
S2L Info
=============================================
From Rtt ReturnCode
---------------------------------------------
10.20.1.2 <10ms EgressRtr
10.20.1.3 10ms EgressRtr
10.20.1.5 11ms EgressRtr
10.20.1.6 <10ms EgressRtr
10.20.1.7 10ms NoFecMapping
:
:
==========================================
Total S2L configured/up/responded = 400/390/388, round-trip min/avg/max
= <10/10/11 ms
Responses based on return code:
EgressRtr(3) = 387
NoFecMapping(4) = 1
*A:Dut-A#
*A:Dut-C# oam lsp-ping A2F_3 > p2mp-instance "1" s2l-dest-
address 10.20.1.5 10.20.2.6 10.20.3.7
LSP-PING A2F_3: 132 bytes MPLS payload
P2MP Instance 1, S2L Egress 10.20.1.5 S2L Egress 10.20.2.6 S2L Egress 10.20.3.7
Total S2L configured/up/responded = 400/390/4, round-trip min/avg/max = <10/10/11 ms
Responses based on return code:
EgressRtr(3) = 3
NoFecMapping(4) = 1
Note: Missing responses on UP S2Ls implies "request timeout"
*A:Dut-A#
*A:Dut-C# oam lsp-ping A2F_3 > p2mp-instance "1" s2l-dest-
address 10.20.1.5 10.20.2.6 10.20.3.7 detail
LSP-PING A2F_3: 132 bytes MPLS payload
P2MP Instance 1, S2L Egress 10.20.1.5 S2L Egress 10.20.2.6 S2L Egress 10.20.3.7
=============================================
S2L Info
=============================================
From Rtt ReturnCode
---------------------------------------------
10.20.1.2 <10ms EgressRtr
10.20.1.3 10ms EgressRtr
10.20.1.4 Timeout N/A
10.20.1.5 11ms NoFecMapping
10.20.1.6 <10ms EgressRtr
==========================================
Total S2L configured/up/responded = 400/390/4, round-trip min/avg/max
= <10/10/11 ms
Responses based on return code:
EgressRtr(3) = 3
NoFecMapping (4) = 1
*A:Dut-A#
p2mp-lsp-trace
Syntax
p2mp-lsp-trace {lsp-name [p2mp-instance instance-name] [s2l-dest-address ip-address…[ip-address…up-to-5]]} | {ldp p2mp-id}} [fc fc-name] [size octets] [max-fail no-response-count] [probe-count probes-per-hop] [min-ttl min-label-ttl] [max-ttl max-label-ttl] [timeout timeout] [interval interval] [detail]
Context
oam
Platforms
7210 SAS-Mxp, 7210 SAS-R6, 7210 SAS-R12, 7210 SAS-Sx/S 1/10GE (standalone and standalone-VC), and 7210 SAS-T
Description
This command discovers and displays the hop-by-hop path for a source-to-leaf (S2L) sub-LSP of an RSVP P2MP LSP.
The LSP trace capability allows the user to trace the path of a single S2L path of a P2MP LSP. Its operation is similar to that of the p2mp-lsp-ping, but the sender of the echo reply request message includes the downstream mapping TLV to request the downstream branch information from a branch LSR or bud LSR. The branch LSR or bud LSR also includes the downstream mapping TLV to report the information about the downstream branches of the P2MP LSP. An egress LER must not include this TLV in the echo response message.
The probe-count parameter operates in the same way as in LSP Trace on a P2P LSP. It represents the maximum number of probes sent per TTL value before giving up on receiving the echo reply message. If a response is received from the traced node before reaching maximum number of probes, no more probes are sent for the same TTL. The sender of the echo request increments the TTL and uses the information it received in the downstream mapping TLV to start sending probes to the node downstream of the last node which replied. This continues until the egress LER for the traced S2L path replied.
Similar to the p2mp-lsp-ping command, an LSP trace probe results in all egress LER nodes eventually receiving the echo request message, but only the traced egress LER node replies to the last probe.
Any branch LSR node or bud LSR node in the P2MP LSP tree may receive a copy of the echo request message with the TTL in the outer label expiring at this node. However, only a branch LSR or bud LSR that has a downstream branch over which the traced egress LER is reachable responds.
When a branch LSR or bud LSR responds, it sets the global return code in the echo response message to RC=14, ‟See DDMAP TLV for Return Code and Return Sub-Code” and the return code in the DDMAP TLV corresponding to the outgoing interface of the branch used by the traced S2L path to RC=8, ‟Label switched at stack-depth <RSC>”.
Parameters
- fc fc-name
Specifies the forwarding class of the MPLS echo request packet.
When an MPLS echo request packet is generated in CPM and forwarded to the outgoing interface, the packet is queued in the egress network queue corresponding to the specified fc parameter value. The LSP-EXP mappings on the outgoing interface dictate the marking of the packet EXP bits.
When the MPLS echo request packet is received on the responding node, the LSP-EXP mappings of the incoming interface dictate the marking of the packet EXP bits.
When an MPLS echo reply packet is generated in CPM and forwarded to the outgoing interface, the packet is queued in the egress network queue corresponding to the fc parameter value determined by the classification of the echo request packet, which is being replied to, at the incoming interface. The LSP-EXP mappings on the outgoing interface dictate the marking of the packet EXP bits.
- interval interval
Specifies the minimum amount of time, in seconds, that must expire before the next echo request message is sent. The parameter overrides the default echo request message send interval.
If the interval is set to 1 second, and the timeout value is set to 10 seconds, the maximum time between message requests is 10 seconds and the minimum is 1 second. This depends upon the receipt of an echo reply message corresponding to the outstanding message request.
- ldp p2mp-id
Specifies the identifier for a LDP P2MP LSP to ping, expressed as a 32-bit integer.
- p2mp-lsp-trace lsp-name
Specifies the name of an P2MP LSP to ping, up to 32 characters.
- max-fail no-response-count
Specifies the maximum number of consecutive MPLS echo requests, expressed as a decimal integer, that do not receive a reply before the trace operation fails for a specific TTL.
- max-ttl max-label-ttl
Specifies the maximum TTL value in the MPLS label for the LSP trace test, expressed as a decimal integer.
- min-ttl min-label-ttl
Specifies the minimum TTL value in the MPLS label for the LSP trace test, expressed as a decimal integer.
- p2mp-instance instance-name
Specifies the name, up to 32 characters, of the specific instance of the P2MP LSP to send the echo request.
- probe-count probes-per-hop
Specifies the number of LSP trace echo request messages to send per TTL value.
- s2l-dest-addr ip-addres
Specifies the egress LER system address of the S2L sub-LSP path that is being traced.
- size octets
Specifies the size in octets, expressed as a decimal integer, of the MPLS echo request packet, including the IP header but not the label stack. The request payload is padded with zeros to the specified size. The OAM command is not failed if the user enters a size lower than the minimum required to build the packet for the echo request message. The payload is automatically padded to meet the minimum size.
- timeout timeout
Specifies the length of time, in seconds, expressed as a decimal integer, that the router waits for an echo reply message from all leaves of the P2MP LSP after sending the message request message. This value overrides the default timeout value. When the message timer expires, the requesting router assumes that the missing replies are not received. Any echo reply message received after the request times out is silently discarded.
- detail
If the detail parameter is omitted, the command output provides a high-level summary of error and success codes received. If the detail parameter is specified, the command output displays a line for each replying node, similar to the output of the LSP ping for a P2P LSP.
Output
The following sample output is an example of P2MP LSP trace information.
Sample output*A:Dut-C# oam p2mp-lsp-trace "p2mp_1" p2mp-instance "1" s2l-dest-
address 10.20.1.5 detail
P2MP LSP p2mp_1: 132 bytes MPLS payload
P2MP Instance 1, S2L Egress 10.20.1.5
1 10.20.1.1 rtt=3.78 ms rc=8(DSRtrMatchLabel)
DS 1: ipaddr 10.20.1.2 iftype 'ipv4Unnumbered' ifaddr 2 MRU=1500 label=131060 p
roto=4(RSVP-TE) B/E flags:0/0
2 10.20.1.2 rtt=3.54 ms rc=8(DSRtrMatchLabel)
DS 1: ipaddr 10.20.1.4 iftype 'ipv4Unnumbered' ifaddr 3 MRU=1500 label=131061 p
roto=4(RSVP-TE) B/E flags:0/0
3 10.20.1.5 rtt=5.30 ms rc=5(DSMappingMismatched)
*A:Dut-A#
Service diagnostics
sdp-mtu
Syntax
sdp-mtu orig-sdp-id size-inc start-octets end-octets [step step-size] [timeout timeout] [interval interval]
Context
oam
Platforms
Supported on all 7210 SAS platforms as described in this document, except those operating in access-uplink mode
Description
This command performs MTU path tests on an SDP to determine the largest path-mtu supported on an SDP. The size-inc parameter can be used to easily determine the path-mtu of a specific SDP-ID. The forwarding class is assumed to be Best-Effort Out-of-Profile. The message reply is returned with IP encapsulation from the far-end IP/MPLS router. OAM request messages sent within an IP SDP must have the ‛DF’ IP header bit set to 1 to prevent message fragmentation. This command is not supported on the 7210 SAS-T in the access-uplink mode of operation.
To terminate an sdp-mtu in progress, use the CLI break sequence <Ctrl-C>.
Special Cases
- SDP Path MTU Tests
SDP Path MTU tests can be performed using the sdp-mtu size-inc keyword to easily determine the path-mtu of a specific SDP-ID. The forwarding class is assumed to be Best-Effort Out-of-Profile. The message reply is returned with IP encapsulation from the far-end 7210 SAS.
With each OAM Echo Request sent using the size-inc parameter, a response line is displayed as message output. The path MTU test displays incrementing packet sizes, the number sent at each size until a reply is received and the response message.
As the request message is sent, its size value is displayed followed by a period for each request sent of that size. Up to three requests are sent unless a valid response is received for one of the requests at that size. When a response is received, the next size message is sent. The response message indicates the result of the message request.
After the last reply has been received or response timeout, the maximum size message replied to indicates the largest size OAM Request message that received a valid reply.
Parameters
- orig-sdp-id
Specifies the sdp-id to be used by sdp-ping, expressed as a decimal integer. The far-end address of the specified sdp-id is the expected responder-id within each reply received. The specified sdp-id defines the encapsulation of the SDP tunnel encapsulation used to reach the far end. This can be IP MPLS. If orig-sdp-id is invalid or administratively down or unavailable for some reason, the SDP echo request message is not sent and an appropriate error message is displayed (when the interval timer expires, sdp-ping attempts to send the next request if required).
- size-inc start-octetsend-octets
Specifies that an incremental path MTU test is performed by sending a series of message requests with increasing MTU sizes. The start-octets and end-octets parameters are described as follows.
- start-octets
Specifies the beginning size in octets of the first message sent for an incremental MTU test, expressed as a decimal integer.
- end-octets
Specifies the ending size in octets of the last message sent for an incremental MTU test, expressed as a decimal integer. The specified value must be greater than start-octets.
- step step-size
Specifies the number of octets to increment the message size request for each message sent for an incremental MTU test, expressed as a decimal integer. The next size message is not sent until a reply is received or three messages have timed out at the current size.
If the incremented size exceeds the end-octets value, no more messages are sent.
- timeout timeout
Specifies the timeout parameter in seconds, expressed as a decimal integer. This value is used to override the default timeout value and is the amount of time that the router waits for a message reply after sending the message request. Upon the expiration of message timeout, the requesting router assumes that the message response has not been received. A ‛request timeout’ message is displayed by the CLI for each message request sent that expires. Any response received after the request times out is silently discarded.
- interval interval
Specifies the interval parameter in seconds, expressed as a decimal integer. This parameter is used to override the default request message send interval and defines the minimum amount of time that must expire before the next message request is sent.
If the interval is set to 1 second, and the timeout value is set to 10 seconds, the maximum time between message requests is 10 seconds and the minimum is 1 second. This depends upon the receipt of a message reply corresponding to the outstanding message request.
Output
The following is an SDP MTU path test sample output.
Sample SDP MTU path test sample output*A:Dut-A# oam sdp-mtu 1201 size-inc 512 3072 step 256
Size Sent Response
----------------------------
512 . Success
768 . Success
1024 . Success
1280 . Success
1536 . Success
1792 . Success
2048 . Success
2304 . Success
2560 . Success
2816 . Success
3072 . Success
Maximum Response Size: 3072
*A:Dut-A#
svc-ping
Syntax
svc-ping ip-address [service service-id] [local-sdp] [remote-sdp]
Context
<GLOBAL>
Platforms
Supported on all 7210 SAS platforms as described in this document, except those operating in access-uplink mode
Description
This command tests a service ID for correct and consistent provisioning between two service end points. This command is not supported on the 7210 SAS-T in the access-uplink mode of operation.
The svc-ping command accepts a far-end IP address and a service-id for local and remote service testing. The following information can be determined from svc-ping:
Local and remote service existence
Local and remote service state
Local and remote service type correlation
Local and remote customer association
Local and remote service-to-SDP bindings and state
Local and remote ingress and egress service label association
Unlike sdp-ping, only a single message is sent per command; no count nor interval parameter is supported and round trip time is not calculated. A timeout value of 10 seconds is used before failing the request. The forwarding class is assumed to be Best-Effort Out-of-Profile
If no request is sent or a reply is not received, all remote information is shown as N/A.
To terminate a svc-ping in progress, use the CLI break sequence <Ctrl-C>.
Upon request timeout, message response, request termination, or request error the following local and remote information is displayed. Local and remote information is dependent upon service existence and reception of reply.
| Field | Description | Values |
|---|---|---|
Request Result |
The result of the svc-ping request message. |
Sent - Request Timeout |
Sent - Request Terminated |
||
Sent - Reply Received |
||
Not Sent - Non-Existent Service-ID |
||
Not Sent - Non-Existent SDP for Service |
||
Not Sent - SDP For Service Down |
||
Not Sent - Non-existent Service Egress Label |
||
Service-ID |
The ID of the service being tested. |
service-id |
Local Service Type |
The type of service being tested. If service-id does not exist locally, N/A is displayed. |
Epipe |
TLS |
||
IES |
||
Mirror-Dest |
||
N/A |
||
Local Service Admin State |
The local administrative state of service-id. If the service does not exist locally, the administrative state is Non-Existent. |
Admin-Up |
Admin-Down |
||
Non-Existent |
||
Local Service Oper State |
The local operational state of service-id. If the service does not exist locally, the state is N/A. |
Oper-Up |
Oper-Down |
||
N/A |
||
Remote Service Type |
The remote type of service being tested. If service-id does not exist remotely, N/A is displayed. |
Epipe |
TLS |
||
IES |
||
Mirror-Dest |
||
N/A |
||
Remote Service Admin State |
The remote administrative state of service-id. If the service does not exist remotely, the administrative state is Non-Existent. |
Up |
Down |
||
Non-Existent |
||
Local Service MTU |
The local service-mtu for service-id. If the service does not exist, N/A is displayed. |
service-mtu |
N/A |
||
Remote Service MTU |
The remote service-mtu for service-id. If the service does not exist remotely, N/A is displayed. |
remote-service-mtu |
N/A |
||
Local Customer ID |
The local customer-id associated with service-id. If the service does not exist locally, N/A is displayed. |
customer-id |
N/A |
||
Remote Customer ID |
The remote customer-id associated with service-id. If the service does not exist remotely, N/A is displayed. |
customer-id |
N/A |
||
Local Service IP Address |
The local system IP address used to terminate remotely configured SDP-ID (as the far-end address). If an IP interface has not been configured to be the system IP address, N/A is displayed. |
system-ip-address |
N/A |
||
Local Service IP Interface Name |
The name of the local system IP interface. If the local system IP interface has not been created, N/A is displayed. |
system-interface-name |
N/A |
||
Local Service IP Interface State |
The state of the local system IP interface. If the local system IP interface has not been created, Non-Existent is displayed. |
Up |
Down |
||
Non-Existent |
||
Expected Far-end Address |
The expected IP address for the remote system IP interface. This must be the far-end address entered for the svc-ping command. |
orig-sdp-far-end-addr |
dest-ip-addr |
||
N/A |
||
Actual Far-end Address |
The returned remote IP address. If a response is not received, the displayed value is N/A. If the far-end service IP interface is down or non-existent, a message reply is not expected. sdp-ping should also fail. |
resp-ip-addr |
N/A |
||
Responders Expected Far-end Address |
The expected source of the originator’s sdp-id from the perspective of the remote router terminating the sdp-id. If the far-end cannot detect the expected source of the ingress sdp-id or the request is transmitted outside the sdp-id, N/A is displayed. |
resp-rec-tunnel-far-end-address |
N/A |
||
Originating SDP-ID |
The sdp-id used to reach the far-end IP address if sdp-path is defined. The originating sdp-id must be bound to the service-id and terminate on the far-end IP address. If an appropriate originating sdp-id is not found, Non-Existent is displayed. |
orig-sdp-id |
Non-Existent |
||
Originating SDP-ID Path Used |
Whether the Originating router used the originating sdp-id to send the svc-ping request. If a valid originating sdp-id is found, operational and has a valid egress service label, the originating router should use the sdp-id as the requesting path if sdp-path has been defined. If the originating router uses the originating sdp-id as the request path, Yes is displayed. If the originating router does not use the originating sdp-id as the request path, No is displayed. If the originating sdp-id is non-existent, N/A is displayed. |
Yes |
No |
||
N/A |
||
Originating SDP-ID Administrative State |
The local administrative state of the originating sdp-id. If the sdp-id has been shutdown, Admin-Down is displayed. If the originating sdp-id is in the no shutdown state, Admin-Up is displayed. If an originating sdp-id is not found, N/A is displayed. |
Admin-Up |
Admin-Up |
||
N/A |
||
Originating SDP-ID Operating State |
The local operational state of the originating sdp-id. If an originating sdp-id is not found, N/A is displayed. |
Oper-Up |
Oper-Down |
||
N/A |
||
Originating SDP-ID Binding Admin State |
The local administrative state of the originating sdp-ids binding to service-id. If an sdp-id is not bound to the service, N/A is displayed. |
Admin-Up |
Admin-Up |
||
N/A |
||
Originating SDP-ID Binding Oper State |
The local operational state of the originating sdp-ids binding to service-id. If an sdp-id is not bound to the service, N/A is displayed. |
Oper-Up |
Oper-Down |
||
N/A |
||
Responding SDP-ID |
The sdp-id used by the far end to respond to the svc-ping request. If the request was received without the sdp-path parameter, the responding router does not use an sdp-id as the return path, but the appropriate responding sdp-id is displayed. If a valid sdp-id return path is not found to the originating router that is bound to the service-id, Non-Existent is displayed. |
resp-sdp-id |
Non-Existent |
||
Responding SDP-ID Path Used |
Whether the responding router used the responding sdp-id to respond to the svc-ping request. If the request was received via the originating sdp-id and a valid return sdp-id is found, operational and has a valid egress service label, the far-end router should use the sdp-id as the return sdp-id. If the far end uses the responding sdp-id as the return path, Yes is displayed. If the far end does not use the responding sdp-id as the return path, No is displayed. If the responding sdp-id is non-existent, N/A is displayed. |
Yes |
No |
||
N/A |
||
Responding SDP-ID Administrative State |
The administrative state of the far-end sdp-id associated with the return path for service-id. When a return path is administratively down, Admin-Down is displayed. If the return sdp-id is administratively up, Admin-Up is displayed. If the responding sdp-id is non-existent, N/A is displayed. |
Admin-Up |
Admin-Up |
||
N/A |
||
Responding SDP-ID Operational State |
The operational state of the far-end sdp-id associated with the return path for service-id. When a return path is operationally down, Oper-Down is displayed. If the return sdp-id is operationally up, Oper-Up is displayed. If the responding sdp-id is non-existent, N/A is displayed. |
Oper-Up |
Oper-Down |
||
N/A |
||
Responding SDP-ID Binding Admin State |
The local administrative state of the responder’s sdp-id binding to service-id. If an sdp-id is not bound to the service, N/A is displayed. |
Admin-Up |
Admin-Down |
||
N/A |
||
Responding SDP-ID Binding Oper State |
The local operational state of the responder’s sdp-id binding to service-id. If an sdp-id is not bound to the service, N/A is displayed. |
Oper-Up |
Oper-Down |
||
N/A |
||
Originating VC-ID |
The originator’s VC-ID associated with the sdp-id to the far-end address that is bound to service-id. If the sdp-id signaling is off, originator-vc-id is 0. If the originator-vc-id does not exist, N/A is displayed. |
originator-vc-id |
N/A |
||
Responding VC-ID |
The responder’s VC-ID associated with the sdp-id to originator-id that is bound to service-id. If the sdp-id signaling is off or the service binding to sdp-id does not exist, responder-vc-id is 0. If a response is not received, N/A is displayed. |
responder-vc-id |
N/A |
||
Originating Egress Service Label |
The originating service label (VC-Label) associated with the service-id for the originating sdp-id. If service-id does not exist locally, N/A is displayed. If service-id exists, but the egress service label has not been assigned, Non-Existent is displayed. |
egress-vc-label |
N/A |
||
Non-Existent |
||
Originating Egress Service Label Source |
The originating egress service label source. If the displayed egress service label is manually defined, Manual is displayed. If the egress service label is dynamically signaled, Signaled is displayed. If the service-id does not exist or the egress service label is non-existent, N/A is displayed. |
Manual |
Signaled |
||
N/A |
||
Originating Egress Service Label State |
The originating egress service label state. If the originating router considers the displayed egress service label operational, Up is displayed. If the originating router considers the egress service label inoperative, Down is displayed. If the service-id does not exist or the egress service label is non-existent, N/A is displayed. |
Up |
Down |
||
N/A |
||
Responding Service Label |
The actual responding service label in use by the far-end router for this service-id to the originating router. If service-id does not exist in the remote router, N/A is displayed. If service-id does exist remotely but the remote egress service label has not been assigned, Non-Existent is displayed. |
rec-vc-label |
N/A |
||
Non-Existent |
||
Responding Egress Service Label Source |
The responder’s egress service label source. If the responder’s egress service label is manually defined, Manual is displayed. If the responder’s egress service label is dynamically signaled, Signaled is displayed. If the service-id does not exist on the responder or the responder’s egress service label is non-existent, N/A is displayed. |
Manual |
Signaled |
||
N/A |
||
Responding Service Label State |
The responding egress service label state. If the responding router considers it is an egress service label operational, Up is displayed. If the responding router considers it is an egress service label inoperative, Down is displayed. If the service-id does not exist or the responder’s egress service label is non-existent, N/A is displayed. |
Up |
Down |
||
N/A |
||
Expected Ingress Service Label |
The locally assigned ingress service label. This is the service label that the far-end is expected to use for service-id when sending to the originating router. If service-id does not exist locally, N/A is displayed. If service-id exists but an ingress service label has not been assigned, Non-Existent is displayed. |
ingress-vc-label |
N/A |
||
Non-Existent |
||
Expected Ingress Label Source |
The originator’s ingress service label source. If the originator’s ingress service label is manually defined, Manual is displayed. If the originator’s ingress service label is dynamically signaled, Signaled is displayed. If the service-id does not exist on the originator or the originators ingress service label has not been assigned, N/A is displayed. |
Manual |
Signaled |
||
N/A |
||
Expected Ingress Service Label State |
The originator’s ingress service label state. If the originating router considers it as an ingress service label operational, Up is displayed. If the originating router considers it as an ingress service label inoperative, Down is displayed. If the service-id does not exist locally, N/A is displayed. |
Up |
Down |
||
N/A |
||
Responders Ingress Service Label |
The assigned ingress service label on the remote router. This is the service label that the far end is expecting to receive for service-id when sending to the originating router. If service-id does not exist in the remote router, N/A is displayed. If service-id exists, but an ingress service label has not been assigned in the remote router, Non-Existent is displayed. |
resp-ingress-vc-label |
N/A |
||
Non-Existent |
||
Responders Ingress Label Source |
The assigned ingress service label source on the remote router. If the ingress service label is manually defined on the remote router, Manual is displayed. If the ingress service label is dynamically signaled on the remote router, Signaled is displayed. If the service-id does not exist on the remote router, N/A is displayed. |
Manual |
Signaled |
||
N/A |
||
Responders Ingress Service Label State |
The assigned ingress service label state on the remote router. If the remote router considers it as an ingress service label operational, Up is displayed. If the remote router considers it as an ingress service label inoperative, Down is displayed. If the service-id does not exist on the remote router or the ingress service label has not been assigned on the remote router, N/A is displayed. |
Up |
Down |
||
N/A |
Parameters
- ip-address
Specifies the far-end IP address to which to send the svc-ping request message in dotted-decimal notation.
- service service-id
Specifies the service ID of the service being tested. The service ID need not exist on the local to receive a reply message.
- local-sdp
Specifies the svc-ping request message should be sent using the same service tunnel encapsulation labeling as service traffic. If local-sdp is specified, the command attempts to use an egress sdp-id bound to the service with the specified far-end IP address with the VC-Label for the service. The far-end address of the specified sdp-id is the expected responder-id within the reply received. The sdp-id defines the encapsulation of the SDP tunnel encapsulation used to reach the far end; this can be IP or MPLS. On originator egress, the service-ID must have an associated VC-Label to reach the far-end address of the sdp-id and the sdp-id must be operational for the message to be sent.
If local-sdp is not specified, the svc-ping request message is sent with encapsulation with the OAM label.
The following table indicates whether a message is sent and how the message is encapsulated based on the state of the service ID.
Table 15. SVC ping messaging depending on service ID state Local service state local-sdp Not specified local-sdp Specified Message sent Message encapsulation Message sent Message encapsulation Invalid Local Service
Yes
Generic IP OAM (PLP)
No
None
No Valid SDP-ID Bound
Yes
Generic IP OAM (PLP)
No
None
SDP-ID Valid But Down
Yes
Generic IP OAM (PLP)
No
None
SDP-ID Valid and Up, But No Service Label
Yes
Generic IP OAM (PLP)
No
None
SDP-ID Valid, Up and Egress Service Label
Yes
Generic IP OAM (PLP)
Yes
SDP Encapsulation with Egress Service Label (SLP)
- remote-sdp
Specifies svc-ping reply message from the far-end should be sent using the same service tunnel encapsulation labeling as service traffic. If remote-sdp is specified, the far-end responder attempts to use an egress sdp-id bound to the service with the message originator as the destination IP address with the VC-Label for the service. The sdp-id defines the encapsulation of the SDP tunnel encapsulation used to reply to the originator; this can be IP or MPLS. On responder egress, the service-ID must have an associated VC-Label to reach the originator address of the sdp-id and the sdp-id must be operational for the message to be sent.
The following table indicates how the message response is encapsulated based on the state of the remote service ID.
Table 16. SVC ping messaging depending on remote service ID state Remote service state Message encapsulation remote-sdp Not specified
remote-sdp Specified
Invalid Ingress Service Label
Generic IP OAM (PLP)
Generic IP OAM (PLP)
Invalid Service-ID
Generic IP OAM (PLP)
Generic IP OAM (PLP)
No Valid SDP-ID Bound on Service-ID
Generic IP OAM (PLP)
Generic IP OAM (PLP)
SDP-ID Valid But Down
Generic IP OAM (PLP)
Generic IP OAM (PLP)
SDP-ID Valid and Up, but No Service Label
Generic IP OAM (PLP)
Generic IP OAM (PLP)
SDP-ID Valid and Up, Egress Service Label, but VC-ID Mismatch
Generic IP OAM (PLP)
Generic IP OAM (PLP)
SDP-ID Valid and Up, Egress Service Label, but VC-ID Match
Generic IP OAM (PLP)
SDP Encapsulation with Egress Service Label (SLP)
Output
The following sample output is an example of svc-ping information.
Sample outputA:ALU_G7X1>config# oam svc-ping 10.20.1.3 service 1
Service-ID: 1
Err Info Local Remote
-----------------------------------------------------
Type: EPIPE EPIPE
Admin State: Up Up
==> Oper State: Down Down
Service-MTU: 1514 1514
Customer ID: 1 1
IP Interface State: Up
Actual IP Addr: 10.20.1.1 10.20.1.3
Expected Peer IP: 10.20.1.3 10.20.1.1
SDP Path Used: No No
SDP-ID: 1 2
Admin State: Up Up
Operative State: Up Up
Binding Admin State:Up Up
Binding Oper State: Up Up
Binding VC ID: 10 10
Binding Type: Spoke Spoke
Binding Vc-type: Ether Ether
Binding Vlan-vc-tag:N/A N/A
Egress Label: 131070 131068
Ingress Label: 131068 131070
Egress Label Type: Signaled Signaled
Ingress Label Type: Signaled Signaled
Request Result: Send - Reply Received: Responder Service ID Oper-Down
A:ALU_G7X1>config#
vprn-ping
Syntax
vprn-ping service-id source ip-address destination ip-address [fc fc-name] [size size] [ttl vc-label-ttl] [return-control] [interval interval] [send-count send-count] [timeout timeout]
Context
<GLOBAL>
config>saa>test>type
Platforms
Supported on all 7210 SAS platforms as described in this document
Description
This command performs a VPRN ping.
Parameters
- service service-id
Specifies the VPRN service ID to diagnose or manage.
- source ip-address
Specifies the IP prefix for the source IP address in dotted-decimal notation.
- destination ip-address
Specifies the IP prefix for the destination IP address in dotted-decimal notation.
- size octets
Specifies the OAM request packet size in octets, expressed as a decimal integer.
- ttl vc-label-ttl
Specifies the TTL value in the VC label for the OAM request, expressed as a decimal integer.
- return-control
Specifies the response to come on the control plane.
- interval interval
Specifies the interval parameter in seconds, expressed as a decimal integer. This parameter is used to override the default request message send interval and defines the minimum amount of time that must expire before the next message request is sent.
If the interval is set to 1 second where the timeout value is set to 10 seconds, the maximum time between message requests is 10 seconds and the minimum is 1 second. This depends upon the receipt of a message reply corresponding to the outstanding message request.
- send-count send-count
Specifies the number of messages to send, expressed as a decimal integer. The count parameter is used to override the default number of message requests sent. Each message request must either timeout or receive a reply before the next message request is sent. The message interval value must be expired before the next message request is sent.
- timeout timeout
Specifies the timeout parameter in seconds, expressed as a decimal integer. This value is used to override the default timeout value and is the amount of time that the router waits for a message reply after sending the message request. Upon the expiration of message timeout, the requesting router assumes that the message response has not been received. Any response received after the request times out is silently discarded.
- fc-name
Specifies the forwarding class of the MPLS echo request encapsulation.
Output
Sample outputA:PE_1# oam vprn-ping 25 source 10.4.128.1 destination 10.16.128.0
Sequence Node-id Reply-Path Size RTT
----------------------------------------------------------------------------
[Send request Seq. 1.]
1 10.128.0.3:cpm In-Band 100 0ms
----------------------------------------------------------------------------
...
A:PE_1#
----------------------------------------------------------------------------
A:PE_1#
vprn-trace
Syntax
vprn-trace service-id source src-ip destination ip-address [fc fc-name] [size size] [min-ttl vc-label-ttl] [max-ttl vc-label-ttl] [return-control] [send-count send-count] [interval seconds] [timeout timeout]
Context
<GLOBAL>
config>saa>test>type
Platforms
Supported on all 7210 SAS platforms as described in this document
Description
Performs VPRN trace.
Parameters
- service service-id
Specifies the VPRN service ID to diagnose or manage.
- source src-ip
Specifies the IP prefix for the source IP address in dotted-decimal notation.
- destination dst-ip
Specifies the IP prefix for the destination IP address in dotted-decimal notation.
- size octets
Specifies the OAM request packet size in octets, expressed as a decimal integer.
- min-ttl vc-label-ttl
Specifies the minimum TTL value in the VC label for the trace test, expressed as a decimal integer.
- max-ttl vc-label-ttl
Specifies the maximum TTL value in the VC label for the trace test, expressed as a decimal integer.
- return-control
Specifies the OAM reply to a data plane OAM request be sent using the control plane instead of the data plane.
- send-count sendcount
Specifies the number of OAM requests sent for a particular TTL value, expressed as a decimal integer.
- interval seconds
Specifies the interval parameter in seconds, expressed as a decimal integer. This parameter is used to override the default request message send interval and defines the minimum amount of time that must expire before the next message request is sent.
If the interval is set to 1 second where the timeout value is set to 10 seconds, the maximum time between message requests is 10 seconds and the minimum is 1 second. This depends upon the receipt of a message reply corresponding to the outstanding message request.
- timeout timeout
Specifies the timeout parameter in seconds, expressed as a decimal integer. This value is used to override the default timeout value and is the amount of time that the router waits for a message reply after sending the message request. Upon the expiration of message timeout, the requesting router assumes that the message response has not been received. Any response received after the request times out is silently discarded.
- fc-name
Specifies the forwarding class of the MPLS echo request encapsulation.
Output
Sample outputA:PE_1# oam vprn-
trace 25 source 10.4.128.1 destination 10.16.128.0
TTL Seq Reply Node-id Rcvd-on Reply-Path RTT
----------------------------------------------------------------------------
[Send request TTL: 1, Seq. 1.]
1 1 1 10.128.0.4 cpm In-Band 0ms
Requestor 10.128.0.1 Route: 0.0.0.0/0
Vpn Label: 131071 Metrics 0 Pref 170 Owner bgpVpn
Next Hops: [1] ldp tunnel
Route Targets: [1]: target:65100:1
Responder 10.128.0.4 Route: 10.16.128.0/24
Vpn Label: 131071 Metrics 0 Pref 170 Owner bgpVpn
Next Hops: [1] ldp tunnel
Route Targets: [1]: target:65001:100
[Send request TTL: 2, Seq. 1.]
2 1 1 10.128.0.3 cpm In-Band 0ms
Requestor 10.128.0.1 Route: 0.0.0.0/0
Vpn Label: 131071 Metrics 0 Pref 170 Owner bgpVpn
Next Hops: [1] ldp tunnel
Route Targets: [1]: target:65100:1
Responder 10.128.0.3 Route: 10.16.128.0/24
Vpn Label: 0 Metrics 0 Pref 0 Owner local
Next Hops: [1] ifIdx 2 nextHopIp 10.16.128.0
[Send request TTL: 3, Seq. 1.]
[Send request TTL: 4, Seq. 1.]
...
----------------------------------------------------------------------------
A:PE_1#
VPLS MAC diagnostics
VPLS MAC diagnostics commands are supported on all 7210 SAS platforms as described in this document, except those operating in access-uplink mode.
cpe-ping
Syntax
cpe-ping service service-id destination ip-address source ip-address [ttl vc-label-ttl] [return-control] [source-mac ieee-address] [fc fc-name] [interval interval] [count send-count]
Context
oam
config>saa>test>type
Platforms
Supported on all 7210 SAS platforms as described in this document
Description
This command determines the IP connectivity to a CPE within a specified VPLS service.
Parameters
- service service-id
Specifies the service ID of the service to diagnose or manage.
- destination ip-address
Specifies the IP address to be used as the destination for performing an OAM ping operations.
- source ip-address
Specifies an unused IP address in the same network that is associated with the VPLS.
- ttl vc-label-ttl
Specifies the TTL value in the VC label for the OAM MAC request, expressed as a decimal integer.
- return-control
Specifies the MAC OAM reply to a data plane MAC OAM request be sent using the control plane instead of the data plane.
- source-mac ieee-address
Specifies the source MAC address that is sent to the CPE. If not specified or set to 0, the MAC address configured for the CPM is used.
- fc-name
Specifies the forwarding class of the MPLS echo request encapsulation.
- interval interval
Specifies the interval parameter in seconds, expressed as a decimal integer. This parameter is used to override the default request message send interval and defines the minimum amount of time that must expire before the next message request is sent.
If the interval is set to 1 second where the timeout value is set to 10 seconds, the maximum time between message requests is 10 seconds and the minimum is 1 second. This depends upon the receipt of a message reply corresponding to the outstanding message request.
- count send-count
The number of messages to send, expressed as a decimal integer. The count parameter is used to override the default number of message requests sent. Each message request must either timeout or receive a reply before the next message request is sent. The message interval value must be expired before the next message request is sent.
mac-populate
Syntax
mac-populate service-id mac ieee-address [flood] [age seconds] [force] [target-sap sap-id]
Context
oam
Platforms
Supported on all 7210 SAS platforms as described in this document
Description
This command populates the FIB with an OAM-type MAC entry indicating the node is the egress node for the MAC address and optionally floods the OAM MAC association throughout the service. The mac-populate command installs an OAM MAC into the service FIB indicating the device is the egress node for a particular MAC address. The MAC address can be bound to a particular SAP (the target-sap) or can be associated with the control plane in that any data destined for the MAC address is forwarded to the control plane (cpm). As a result, if the service on the node has neither a FIB nor an egress SAP, it is not allowed to initiate a mac-populate.
The MAC address that is populated in the FIBs in the provider network is specific a type OAM, so that it can be treated distinctly from regular dynamically learned or statically configured MACs. Note that OAM MAC addresses are operational MAC addresses and are not saved in the device configuration. An exec file can be used to define OAM MACs after system initialization.
The force option in mac-populate forces the MAC in the table to be type OAM in the case it already exists as a dynamic, static or an OAM induced learned MAC with some other type binding.
An OAM-type MAC cannot be overwritten by dynamic learning and allows customer packets with the MAC to either ingress or egress the network while still using the OAM MAC entry.
The flood option causes each upstream node to learn the MAC (that is, populate the local FIB with an OAM MAC entry) and to flood the request along the data plane using the flooding domain.The flooded mac-populate request can be sent via the data plane or the control plane. The send-control option specifies the request be sent using the control plane. If send-control is not specified, the request is sent using the data plane. An age can be provided to age a particular OAM MAC using a specific interval. By default, OAM MAC addresses are not aged and can be removed with a mac-purge or with an FDB clear operation.
When split horizon group (SHG) is configured, the flooding domain depends on which SHG the packet originates from. The target-sap sap-id value dictates the originating SHG information.
Parameters
- service service-id
Specifies the Service ID of the service to diagnose or manage.
- destination ieee-address
Specifies the MAC address to be populated.
- flood
Sends the OAM MAC populate to all upstream nodes.
- age seconds
Specifies the age for the OAM MAC, expressed as a decimal integer.
- force
Converts the MAC to an OAM MAC even if it currently another type of MAC.
- target-sap sap-id
Specifies the local target SAP bound to a service on which to associate the OAM MAC. By default, the OAM MAC is associated with the control place, that is, it is associated with the CPU on the router.
When the target-sap sap-id value is not specified the MAC is bound to the CPM. The originating SHG is 0 (zero). When the target-sap sap-id value is specified, the originating SHG is the SHG of the target-sap.
mac-purge
Syntax
mac-purge service-id target ieee-address [flood] [register]
Context
oam
Platforms
Supported on all 7210 SAS platforms as described in this document.
Description
This command removes an OAM-type MAC entry from the FIB and optionally floods the OAM MAC removal throughout the service. A mac-purge can be sent via the forwarding path or via the control plane. When sending the MAC purge using the data plane, the TTL in the VC label is set to 1. When sending the MAC purge using the control plane, the packet is sent directly to the system IP address of the next hop.
A MAC address is purged only if it is marked as OAM. A mac-purge request is an HVPLS OAM packet, with the following fields. The Reply Flags is set to 0 (since no reply is expected), the Reply Mode and Reserved fields are set to 0. The Ethernet header has source set to the (system) MAC address, the destination set to the broadcast MAC address. There is a VPN TLV in the FEC Stack TLV to identify the service domain.
If the register option is provided, the R bit in the Address Delete flags is turned on.
The flood option causes each upstream node to be sent the OAM MAC delete request and to flood the request along the data plane using the flooding domain. The flooded mac-purge request can be sent via the data plane or the control plane. The send-control option specifies the request be sent using the control plane. If send-control is not specified, the request is sent using the data plane.
The register option reserves the MAC for OAM testing where it is no longer an active MAC in the FIB for forwarding, but it is retained in the FIB as a registered OAM MAC. Registering an OAM MAC prevents relearns for the MAC based on customer packets. Relearning a registered MAC can only be done through a mac-populate request. The originating SHG is always 0 (zero).
Parameters
- service service-id
Specifies the service ID of the service to diagnose or manage.
- target ieee-address
Specifies the MAC address to be purged.
- flood
Sends the OAM MAC purge to all upstream nodes.
- register
Reserve the MAC for OAM testing.
mac-ping
Syntax
mac-ping service service-id destination dst-ieee-address [source src-ieee-address] [fc fc-name] [size octets] [ttl vc-label-ttl] [count send-count] [return-control] [interval interval] [timeout timeout]
Context
oam
config>saa>test>type
Platforms
Supported on all 7210 SAS platforms as described in this document.
Description
This command tests for the existence of an egress SAP binding of a specific MAC within a VPLS service.
A mac-ping packet can be sent through the control plane or the data plane. The send-control option specifies the request be sent using the control plane. If send-control is not specified, the request is sent using the data plane.
A mac-ping is forwarded along the flooding domain if no MAC address bindings exist. If MAC address bindings exist, the packet is forwarded along those paths, provided they are active. A response is generated only when there is an egress SAP binding for that MAC address or if the MAC address is a ‟local” OAM MAC address associated with the device’s control plan.
A mac-ping reply can be sent using the data plane or the control plane. The return-control option specifies the reply be sent using the control plane. If return-control is not specified, the request is sent using the data plane.
A mac-ping with data plane reply can only be initiated on nodes that can have an egress MAC address binding. A node without a FIB and without any SAPs cannot have an egress MAC address binding, so it is not a node where replies in the data plane are trapped and sent up to the control plane.
A control plane request is responded to through a control plane reply only.
By default, MAC OAM requests are sent with the system or chassis MAC address as the source MAC. The source option allows overriding of the default source MAC for the request with a specific MAC address.
When a source ieee-address value is specified and the source MAC address is locally registered within a split horizon group (SHG), this SHG membership is used as if the packet originated from this SHG. In all other cases, SHG 0 (zero) is used. Note that if the mac-trace is originated from a non-zero SHG, such packets do not go out to the same SHG.
If EMG is enabled, mac-ping returns only the first SAP in each chain.
Parameters
- service service-id
Specifies the service ID of the service to diagnose or manage.
- destination ieee-address
Specifies the destination MAC address for the OAM MAC request.
- size octets
Specifies the MAC OAM request packet size in octets, expressed as a decimal integer. The request payload is padded to the specified size with a 6 byte PAD header and a byte payload of 0xAA as necessary. If the octet size specified is less than the minimum packet, the minimum sized packet necessary to send the request is used.
- ttl vc-label-ttl
Specifies the TTL value in the VC label for the OAM MAC request, expressed as a decimal integer.
- return-control
Specifies the MAC OAM reply to a data plane MAC OAM request be sent using the control plane instead of the data plane.
- source src-ieee-address
Specifies the source MAC address from which the OAM MAC request originates. By default, the system MAC address for the chassis is used.
- fc fc-name
Specifies the fc parameter used to test the forwarding class of the MPLS echo request packets. The actual forwarding class encoding is controlled by the network egress LSP-EXP mappings.
- interval interval
Specifies the interval parameter in seconds, expressed as a decimal integer. This parameter is used to override the default request message send interval and defines the minimum amount of time that must expire before the next message request is sent.
If the interval is set to 1 second where the timeout value is set to 10 seconds, the maximum time between message requests is 10 seconds and the minimum is 1 second. This depends upon the receipt of a message reply corresponding to the outstanding message request.
- count send-count
Specifies the number of messages to send, expressed as a decimal integer. The count parameter is used to override the default number of message requests sent. Each message request must either timeout or receive a reply before the next message request is sent. The message interval value must be expired before the next message request is sent.
- timeout timeout
Specifies the timeout parameter in seconds, expressed as a decimal integer. This value is used to override the default timeout value and is the amount of time that the router waits for a message reply after sending the message request. Upon the expiration of message timeout, the requesting router assumes that the message response has not been received. Any response received after the request times out is silently discarded.
mac-trace
Syntax
mac-trace service service-id destination ieee-address [fc fc-name] [size octets] [min-ttl vc-label-ttl] [max-ttl vc-label-ttl] [return-control] [source ieee-address] [send-count send-count] [interval interval] [timeout timeout]
Context
oam
config>saa>test>type
Platforms
Supported on all 7210 SAS platforms as described in this document
Description
This command displays the hop-by-hop path for a destination MAC address within a VPLS.
The MAC traceroute operation is modeled after the IP traceroute utility which uses ICMP echo request and reply packets with increasing TTL values to determine the hop-by-hop route to a destination IP. The MAC traceroute command uses Nokia OAM packets with increasing TTL values to determine the hop-by-hop route to a destination MAC.
In a MAC traceroute, the originating device creates a MAC ping echo request packet for the MAC to be tested with increasing values of the TTL. The echo request packet is sent through the control plane or data plane and awaits a TTL exceeded response or the echo reply packet from the device with the destination MAC. The devices that reply to the echo request packets with the TTL exceeded and the echo reply are displayed.
When a source ieee-address value is specified and the source MAC address is locally registered within a split horizon group (SHG), this SHG membership is used as if the packet originated from this SHG. In all other cases, SHG 0 (zero) is used. Note that if the mac-ping is originated from a non-zero SHG, such packets do not go out to the same SHG.
If EMG is enabled, mac-trace returns only the first SAP in each chain.
Parameters
- service service-id
Specifies the Service ID of the service to diagnose or manage.
- destination ieee-address
Specifies the destination MAC address to be traced.
- size octets
Specifies the MAC OAM request packet size in octets, expressed as a decimal integer. The request payload is padded to the specified size with a 6 byte PAD header and a byte payload of 0xAA as necessary. If the octet size specified is less than the minimum packet, the minimum sized packet necessary to send the request is used.
- fc fc-name
Specifies the fc parameter used to test the forwarding class of the MPLS echo request packets. The actual forwarding class encoding is controlled by the network egress LSP-EXP mappings.
- min-ttl vc-label-ttl
The minimum TTL value in the VC label for the MAC trace test, expressed as a decimal integer.
- max-ttl vc-label-ttl
Specifies the maximum TTL value in the VC label for the MAC trace test, expressed as a decimal integer.
- return-control
Specifies the MAC OAM reply to a data plane MAC OAM request be sent using the control plane instead of the data plane.
- source ieee-address
Specifies the source MAC address from which the OAM MAC request originates. By default, the system MAC address for the chassis is used.
- send-count send-count
Specifies the number of MAC OAM requests sent for a particular TTL value, expressed as a decimal integer.
- interval interval
Specifies the interval parameter in seconds, expressed as a decimal integer. This parameter is used to override the default request message send interval and defines the minimum amount of time that must expire before the next message request is sent.
If the interval is set to 1 second, and the timeout value is set to 10 seconds, the maximum time between message requests is 10 seconds and the minimum is 1 second. This depends upon the receipt of a message reply corresponding to the outstanding message request.
- timeout timeout
Specifies the timeout parameter in seconds, expressed as a decimal integer. This value is used to override the default timeout value and is the amount of time that the router waits for a message reply after sending the message request. Upon the expiration of message timeout, the requesting router assumes that the message response has not been received. Any response received after the request times out is silently discarded.
EFM commands
efm
Syntax
efm port-id local-loopback {start | stop}
efm port-id remote-loopback {sart | stop}
Context
oam>efm
Platforms
Supported on all 7210 SAS platforms as described in this document, including platforms configured in the access-uplink operating mode
Description
This command enables Ethernet in the First Mile (EFM) OAM loopback tests on the specified port.
Parameters
- port-id
Specifies the port ID in the slot/mda/port format.
- local-loopback {start | stop}
Specifies to start or stop local loopback tests on the specified port.
- remote-loopback {start | stop}
Specifies to start or stop remote loopback tests on the specified port.
ETH-CFM OAM commands
eth-test
Syntax
mac-address mep mep-id domain md-index association ma-index [priority priority] [data-length data-length]
Context
oam>eth-cfm
Platforms
Supported on all 7210 SAS platforms as described in this document, including platforms configured in the access-uplink operating mode
Description
This command issues an ETH-CFM test.
Parameters
- mac-address
Specifies a unicast MAC address.
- mep mep-id
Specifies target MAC address.
- domain md-index
Specifies the MD index.
- association ma-index
Specifies the MA index.
- data-length data-length
Specifies the UDP data length of the echo reply, the length starting after the IP header of the echo reply.
- priority priority
Specifies the priority.
linktrace
Syntax
linktrace mac-address mep mep-id domain md-index association ma-index [ttl ttl-value]
Context
oam>eth-cfm
Platforms
Supported on all 7210 SAS platforms as described in this document, including platforms configured in the access-uplink operating mode
Description
The command specifies to initiate a linktrace test.
Parameters
- mac-address
Specifies a unicast destination MAC address.
- mep mep-id
Specifies the target MAC address.
- domain md-index
Specifies the MD index.
- association ma-index
Specifies the MA index.
- ttl ttl-value
Specifies the TTL for a returned linktrace.
loopback
Syntax
loopback mac-address mep mep-id domain md-index association ma-index [send-count send-count] [size data-size] [priority priority]
Context
oam>eth-cfm
Platforms
Supported on all 7210 SAS platforms as described in this document, including platforms configured in the access-uplink operating mode
Description
The command specifies to initiate a loopback test.
Parameters
- mac-address
Specifies a unicast MAC address.
- mep mep-id
Specifies the local MEP ID.
- domain md-index
Specifies the MD index.
- association ma-index
Specifies the MA index.
- send-count send-count
Specifies the number of messages to send, expressed as a decimal integer. Loopback messages are sent back to back, with no delay between the transmissions.
- size data-size
Specifies the size of the data portion of the data TLV, allowing for an optional octet string to be specified. If 0 is specified, no data TLV is added to the packet.
- priority priority
Specifies a 3-bit value to be used in the VLAN tag, if present, in the transmitted frame.
one-way-delay-test
Syntax
one-way-delay-test mac-address mep mep-id domain md-index association ma-index [priority priority]
Context
oam>eth-cfm
Platforms
Supported on all 7210 SAS platforms as described in this document, including platforms configured in the access-uplink operating mode
Description
This command issues an ETH-CFM one-way delay test.
Parameters
- mac-address
Specifies a unicast MAC address.
- mep mep-id
Specifies target MAC address.
- domain md-index
Specifies the MD index.
- association ma-index
Specifies the MA index.
- priority priority
Specifies the priority.
two-way-delay-test
Syntax
two-way-delay-test mac-address mep mep-id domain md-index association ma-index [priority priority]
Context
oam>eth-cfm
Platforms
Supported on all 7210 SAS platforms as described in this document, including platforms configured in the access-uplink operating mode
Description
This command issues an ETH-CFM two-way delay test.
Parameters
- mac-address
Specifies a unicast MAC address.
- mep mep-id
Specifies target MAC address.
- domain md-index
Specifies the MD index.
- association ma-index
Specifies the MA index.
- priority priority
Specifies the priority.
two-way-slm-test
Syntax
two-way-slm-test mac-address mep mep-id domain md-index association ma-index [priority priority] [send-count send-count] [size data-size] [timeout timeout] [interval interval]
Context
oam>eth-cfm
Platforms
Supported on all 7210 SAS platforms as described in this document, including platforms configured in the access-uplink operating mode
Description
This command configures an Ethernet CFM two-way SLM test in SAA.
Parameters
- mac-address
Specifies a unicast destination MAC address.
- mep mep-id
Specifies the target MAC address.
- domain md-index
Specifies the MD index.
- association ma-index
Specifies the MA index.
- priority priority
Specifies a 3-bit value to be used in the VLAN tag, if present, in the transmitted frame.
- send-count send-count
Specifies the number of messages to send, expressed as a decimal integer. The count parameter is used to override the default number of message requests sent. Each message request must either timeout or receive a reply before the next message request is sent. The message interval value must be expired before the next message request is sent.
- size data-size
Specifies the size of the data portion of the data TLV. If 0 is specified no data TLV is added to the packet.
- timeout timeout
Specifies the timeout parameter in seconds, expressed as a decimal integer. This value is used to override the default timeout value and is the amount of time that the router waits for a reply message after sending the message request. Upon the expiration of message timeout, the requesting router assumes that the message response has not been received. Any response received after the request times out is silently discarded.
- interval interval
Specifies the interval parameter in seconds, expressed as a decimal integer. This parameter is used to override the default request message send interval and defines the minimum amount of time that must expire before the next message request is sent.
If the interval is set to 1 second, and the timeout value is set to 10 seconds, the maximum time between message requests is 10 seconds and the minimum is 1 second. This depends upon the receipt of a message reply corresponding to the outstanding message request.
ETH CFM configuration commands
eth-cfm
Syntax
eth-cfm
Context
config
Platforms
Supported on all 7210 SAS platforms as described in this document, including platforms configured in the access-uplink operating mode
Description
Commands in this context configure 802.1ag CFM parameters.
domain
Syntax
domain md-index [format md-name-format] [name md-name] level level
domain md-index
no domain md-index
Context
config>eth-cfm
Platforms
Supported on all 7210 SAS platforms as described in this document, including platforms configured in the access-uplink operating mode
Description
This command configures Connectivity Fault Management domain parameters.
The no form of this command removes the Maintenance Domain (MD) index parameters from the configuration.
Parameters
- md-index
Specifies the MD index value.
- format md-name-format
Specifies a value that represents the type (format).
- name md-name
Specifies a generic MD name.
- level level
Specifies the integer identifying the MD level. Higher numbers correspond to higher maintenance domains, those with the greatest physical reach, with the highest values for customers’ CFM packets. Lower numbers correspond to lower maintenance domains, those with more limited physical reach, with the lowest values for single bridges or physical links.
association
Syntax
association ma-index [format ma-name-format] name ma-name
association ma-index
no association ma-index
Context
config>eth-cfm>domain
Platforms
Supported on all 7210 SAS platforms as described in this document, including platforms configured in the access-uplink operating mode
Description
This command configures the Maintenance Association (MA) for the domain.
Parameters
- ma-index
Specifies the MA index value.
- format ma-name-format
Specifies a value that represents the type (format).
- name ma-name
Specifies the part of the MA identifier that is unique within the MD name.
bridge-identifier
Syntax
[no] bridge-identifier bridge-id
Context
config>eth-cfm>domain>association
Platforms
Supported on all 7210 SAS platforms as described in this document, including platforms configured in the access-uplink operating mode
Description
This command configures the service ID for the domain association. The value must be configured to match the service ID of the service where MEPs for this association is created.
Note: The system does not verify whether a service has been created with a matching service ID.
Parameters
- bridge-id
Specifies the bridge ID for the domain association.
id-permission
Syntax
id-permission {chassis}
no id-permission
Context
config>eth-cfm>domain>association>bridge-identifier
Platforms
Supported on all 7210 SAS platforms as described in this document, including platforms configured in the access-uplink operating mode
Description
This command enables the inclusion of the Sender ID TLV information specified with the config>eth-cfm>system>sender-id command for installed MEPs and MIPs. When this option is present under the maintenance association, the specific MIPs in the association includes the Sender ID TLV information in ETH-CFM PDUs. MEPs include the Sender ID TLV for CCM (subsecond CCM-enabled MEPs do not support the Sender ID TLV) in LBM/LBR and LTM/LTR PDUs. MIPs include this value in the LBR and LTR PDUs.
The no form of this command disables the inclusion of the Sender ID TLV.
Default
no id-permission
Parameters
- chassis
Specifies to include the Sender ID TLV with a value configured with the config>eth-cfm>system>sender-id command.
mhf-creation
Syntax
mhf-creation {none | explicit | default | static}
no mhf-creation
Context
config>eth-cfm>domain>association>bridge-identifier
Platforms
Supported on all 7210 SAS platforms as described in this document, including platforms configured in the access-uplink operating mode
Description
This command determines whether to allow MIP creation for the MA. Use of the none, default and explicit parameters are only allowed for MHFs (MIPs) that are not associated with a configured primary VLAN.
The static parameter is only applicable to MHFs (MIPs) that are associated with a Primary VLAN.
Ingress MIPs and egress MIPs are supported on 7210 SAS platforms. Ingress MIPs respond to OAM messages received from the wire. Egress MIPs respond to OAM messages that are being sent out to the wire.
See ETH-CFM support matrix for the 7210 SAS-T (network mode), ETH-CFM support matrix for the 7210 SAS-T (access-uplink mode), ETH-CFM support matrix for 7210 SAS-Mxp devices, ETH-CFM support matrix for 7210 SAS-R6 and 7210 SAS-R12 devices, ETH-CFM support matrix for 7210 SAS-Sx/S 1/10GE devices, and ETH-CFM support matrix for 7210 SAS-Sx 10/100GE devices for MEP and MIP support available for different services on different platforms.
Parameters
- none
Specifies that no MHFs can be created for this VID.
- explicit
Specifies that MHFs can be created for this VID only on bridge ports through which this VID can pass, and only if a MEP is created at some lower MA level. There must be at least one lower-level MEP provisioned on the same SAP.
- default
Specifies that MHFs can be created for this VID only on bridge ports through which this VID can pass without the requirement for a MEP at some lower MA level.
Note:On 7210 SAS-R6 and 7210 SAS-R12, the default parameter is supported for Ingress MIPs only in a VPLS service and it is supported for MIP creation in an Epipe service.
- static
Specifies the exact level of the MHF (MIP) that are created for this SAP. Multiple MHFs (MIPs) are allowed as long as the MD level hierarchy is correctly configured for the particular primary VLAN.
mip-ltr-priority
Syntax
mip-ltr-priority priority
Context
config>eth-cfm>domain>association>bridge-identifier
Platforms
Supported on all 7210 SAS platforms as described in this document, including platforms configured in the access-uplink operating mode
Description
This command sets the priority of the Linktrace Response Message (ETH-LTR) from a MIP for this association. If this command is not specified, an LTR priority of 7 is used.
Default
no mip-ltr-priority
Parameters
- priority
Specifies the priority of the Linktrace Response Message (ETH-LTR) from a MIP for this association.
vlan
Syntax
vlan vlan-id
no vlan
Context
config>eth-cfm>domain>association>bridge-identifier
Platforms
Supported on all 7210 SAS platforms as described in this document, including platforms configured in the access-uplink operating mode
Description
This command configures the bridge identifier primary VLAN ID. Note that this configuration is optional as no verification is done to ensure that MEPs on this association are on the configured VLAN. When the primary VLAN feature is enabled for the MEP or a MIP, this is used to match with the VLAN in the packet to identify the packets to process in the context of the primary VLAN MIP/MEP.
Note: Also see the description for the config>eth-cfm>domain>association>bridge-identifier command.
Parameters
- vlan-id
Specifies a VLAN ID monitored by MA.
ccm-interval
Syntax
ccm-interval {10ms | 100ms | 1 | 10 | 60 | 600}
no ccm-interval
Context
config>eth-cfm>domain>association
Platforms
Supported on all 7210 SAS platforms as described in this document, including platforms configured in the access-uplink operating mode
Description
This command configures the CCM transmission interval for all MEPs in the association. See the following tables for the CCM transmission interval values for each 7210 SAS platform.
| MEP timer support | 7210 SAS-T network mode | 7210 SAS-Mxp | 7210 SAS-Sx /S 1/10GE | 7210 SAS-Sx 10/100 GE |
|---|---|---|---|---|
Service Down MEP |
1 | 10 | 60 | 600 |
1 | 10 | 60 | 600 |
1 | 10 | 60 | 600 |
1 | 10 | 60 | 600 |
G8032 Down MEP |
100ms | 1 | 10 | 60 | 600 |
10ms | 100ms | 1 | 10 | 60 | 600 |
10ms |100ms | 1 | 10 | 60 | 600 |
100ms | 1 | 10 | 60 | 600 |
Service UP MEP |
1 | 10 | 60 | 600 |
1 | 10 | 60 | 600 |
1 | 10 | 60 | 600 |
1 | 10 | 60 | 600 |
| MEP timer support | 7210 SAS-T access-uplink mode |
|---|---|
Service Down MEP |
100ms | 1 | 10 | 60 | 600 |
G8032 Down MEP |
100ms | 1 | 10 | 60 | 600 |
Service UP MEP |
1 | 10 | 60 | 600 |
| MEP timer support | 7210 SAS-R6 and 7210 SAS-R12 |
|---|---|
Service Down MEP |
1s |
G8032 Down MEP |
10ms |
Service UP MEP |
1s |
The no form of this command resets the value to the default.
Default
10 s
Parameters
- {10ms | 100ms | 1 | 10 | 60 | 600}
Specifies the interval between CCM transmissions to be used by all MEPs in the MA.
remote-mepid
Syntax
[no] remote-mepid mep-id
Context
config>eth-cfm>domain>association
Platforms
Supported on all 7210 SAS platforms as described in this document, including platforms configured in the access-uplink operating mode
Description
This command configures the remote MEP identifier.
Parameters
- mep-id
Specifies the MEP identifier of a remote MEP whose information from the MEP database is to be returned.
slm
Syntax
slm
Context
config>eth-cfm
Platforms
Supported on all 7210 SAS platforms as described in this document, including platforms configured in the access-uplink operating mode
Description
This command specifies the container that provides the global configuration parameters for ITU-T Synthetic Loss Measurement (ETH-SL).
inactivity-timer
Syntax
inactivity-timer timer
no inactivity-timer
Context
config>eth-cfm>slm
Platforms
Supported on all 7210 SAS platforms as described in this document, including platforms configured in the access-uplink operating mode
Description
This command configures the length of time that the responder keeps a test active. If the time between packets exceeds this values within a test, the responder marks the previous test as complete. It treats any new packets from a peer with the same test ID, source MAC address, and MEP ID as a new test responding with the sequence number 1.
The no form of this command resets the timeout to the default value.
Default
100
Parameters
- timer
Specifies the amount of time in seconds.
system
Syntax
system
Context
config>eth-cfm
Platforms
Supported on all 7210 SAS platforms as described in this document, including platforms configured in the access-uplink operating mode
Description
Commands in this context configure connectivity fault management general system parameters.
The no form of this command resets the timeout to the default value.
Values - 10 to 100
sender-id
Syntax
sender-id local local-name
sender-id system
no sender-id
Context
config>eth-cfm>system
Platforms
Supported on all 7210 SAS platforms as described in this document, including platforms configured in the access-uplink operating mode
Description
This command configures the ETH-CFM Sender ID used in CFM PDUs.
This command includes the configured system name or a locally configured name as the Chassis ID in Sender ID TLVs for ETH-CFM PDUs sent from MEPs and MIPs. MEPs include the Sender ID TLV for the CCM (subsecond CCM-enabled MEPs do not support the Sender ID TLV) in LBM/LBR and LTM/LTR PDUs. MIPs include this value in the LBR and LTR PDUs.
LBR functions reflect back all TLVs received in the LBM unchanged, including the Sender ID TLVs.
The no form of this command reverts to the default.
Default
no sender-id
Parameters
- local-name
Specifies to use a local name, up to 45 alphanumeric characters, as the Sender ID.
- system
Specifies to use the configured system name as the Sender ID.
Testhead commands
test-oam
Syntax
test-oam
Context
config
Platforms
Supported on all 7210 SAS platforms as described in this document, including platforms configured in the access-uplink operating mode
Description
Commands in this context configure Operations, Administration, and Maintenance test parameters.
testhead-profile
Syntax
testhead-profile profile-id create
Context
config>test-oam
Platforms
Supported on all 7210 SAS platforms as described in this document, including platforms configured in the access-uplink operating mode
Description
This command creates service testhead profiles which are used by the Y.1564/RFC 2544 testhead (also known as, traffic generator) OAM tool. A service testhead profile configures the parameters, such as contents of the frame payload that is generated by traffic generator, the size of the frame, test duration, test acceptance criteria, and other criteria to be used by the testhead tool.
The profile is used by the testhead OAM tool to generate the appropriate frame at the configured rate and measure the performance parameters (FD, FDV, and loss). At the end of the test run, the tool compares the measured values against the test acceptance criteria that is configured in the profile to determine whether the service is within bounds of the acceptance criteria or not.
The no form of this command removes user created profile from the system.
Parameters
- profile-id
Specifies the identifier for the profile.
acceptance-criteria
Syntax
[no] acceptance-criteria acceptance-criteria-id create
Context
configure>test-oam>testhead-profile
Platforms
Supported on all 7210 SAS platforms as described in this document, including platforms configured in the access-uplink operating mode
Description
This command specifies the test acceptance criteria to be used by the testhead OAM tool to declare the PASS/FAIL result at the completion of the test.
Users can create up to 4 different acceptance criteria per profile to measure different SLA needs. User has an option to specify only one of the acceptance criteria to be specified with the testhead OAM tool during the invocation of the test.
The no form of this command removes the test acceptance criteria.
Default
no defaults
Parameters
- acceptance-criteria-id
Specifies a number to identify the test acceptance criteria. It is a decimal number used to identify the test acceptance criteria and to use when starting the throughput test.
cir-threshold
Syntax
[no] cir-threshold cir-threshold
Context
configure>test-oam>testhead-profile>acceptance-criteria
Platforms
Supported on all 7210 SAS platforms as described in this document, including platforms configured in the access-uplink operating mode
Description
This command compares the specified value for the CIR rate with the measured CIR rate at the end of the test to declare the test result. If the measured value is greater than the specified value, the test is declared as ‛PASS’, else it is considered to be ‛FAIL’.
The no form of this command disables the comparison of the parameter with the measured value at the end of the test. The threshold value is ignored and not considered for declaring the test result.
Default
no cir-threshold
Parameters
- threshold
Specifies the value, in kbps, for comparison with the measured value.
jitter-rising-threshold
Syntax
[no] jitter-rising-threshold threshold
Context
configure>test-oam>testhead-profile>acceptance-criteria
Platforms
Supported on all 7210 SAS platforms as described in this document, including platforms configured in the access-uplink operating mode
Description
This command compares the specified value for the jitter with the measured jitter at the end of the test to declare the test result. If the measured value is greater than the specified value, the test is declared as ‛FAIL’, else it is considered to be ‛PASS’.
The no form of this command disables the comparison of the parameter with the measured value at the end of the test. The threshold value is ignored and not considered for declaring the test result.
Default
no jitter-rising-threshold
Parameters
- threshold
Specifies, in microseconds, the value for comparison with measured value.
jitter-rising-threshold-in
Syntax
[no] jitter-rising-threshold-in in-profile-threshold
Context
configure>test-oam>testhead-profile>acceptance-criteria
Platforms
Supported on all 7210 SAS platforms as described in this document, including platforms configured in the access-uplink operating mode
Description
This command compares the specified value for the jitter with the measured jitter for green/in-profile packets at the end of the test to declare the test result. If the measured value is greater than the specified value, the test is declared as ‛FAIL’, else it is considered to be ‛PASS’.
The no form of this command disables the comparison of the parameter with the measured value at the end of the test. The threshold value is ignored and not considered for declaring the test result.
Default
no jitter-rising-threshold-in
Parameters
- In-profile-threshold
Specifies the value, in microseconds, for comparison with measured value.
jitter-rising-threshold-out
Syntax
[no] jitter-rising-threshold-out out-profile-threshold
Context
configure>test-oam>testhead-profile>acceptance-criteria
Platforms
Supported on all 7210 SAS platforms as described in this document, including platforms configured in the access-uplink operating mode
Description
This command compares the specified value for the jitter with the measured jitter for yellow/out-of-profile packets at the end of the test to declare the test result. If the measured value is greater than the specified value, the test is declared as ‛FAIL’, else it is considered to be ‛PASS’.
The no form of this command disables the comparison of the parameter with the measured value at the end of the test. The threshold value is ignored and not considered for declaring the test result.
Default
no jitter-rising-threshold-out
Parameters
- out-profile-threshold
Specifies, in microseconds, the value for comparison with measured value.
latency-rising-threshold
Syntax
[no] latency-rising-threshold threshold
Context
configure>test-oam>testhead-profile>acceptance-criteria
Platforms
Supported on all 7210 SAS platforms as described in this document, including platforms configured in the access-uplink operating mode
Description
This command compares the specified value for the latency with the measured latency at the end of the test to declare the test result. If the measured value is greater than the specified value, the test is declared as ‛FAIL’, else it is considered to be ‛PASS’.
The no form of this command disables the comparison of the parameter with the measured value at the end of the test. The threshold value is ignored and not considered for declaring the test result.
Default
no latency-rising-threshold
Parameters
- threshold
Specifies the value, in microseconds, for comparison with measured value.
latency-rising-threshold-in
Syntax
[no] latency-rising-threshold-in in-profile-threshold
Context
configure>test-oam>testhead-profile>acceptance-criteria
Platforms
Supported on all 7210 SAS platforms as described in this document, including platforms configured in the access-uplink operating mode
Description
This command compares the specified value for the latency with the measured latency for green/in-profile packets at the end of the test to declare the test result. If the measured value is greater than the specified value, the test is declared as ‛FAIL’, else it is considered to be ‛PASS’.
The no form of this command disables the comparison of the parameter with the measured value at the end of the test. The threshold value is ignored and not considered for declaring the test result.
Default
no latency-rising-threshold-in
Parameters
- In-profile-threshold
Specifies the value, in microseconds, for comparison with measured value.
latency-rising-threshold-out
Syntax
[no] latency-rising-threshold out-profile-threshold
Context
configure>test-oam>testhead-profile>acceptance-criteria
Platforms
Supported on all 7210 SAS platforms as described in this document, including platforms configured in the access-uplink operating mode
Description
This command compares the specified value for the latency with the measured latency of yellow or out-of-profile packets at the end of the test to declare the test result. If the measured value is greater than the specified value, the test is declared as ‛FAIL’, else it is considered to be ‛PASS’.
The no form of this command disables the comparison of the parameter with the measured value at the end of the test. The threshold value is ignored and not considered for declaring the test result.
Default
no latency-rising-threshold-out
Parameters
- out-profile-threshold
Specifies the value, in microseconds, for comparison with measured value
loss-rising-threshold
Syntax
[no] loss-rising-threshold threshold
Context
configure>test-oam>testhead-profile>acceptance-criteria
Platforms
Supported on all 7210 SAS platforms as described in this document, including platforms configured in the access-uplink operating mode
Description
This command compares the specified value for the Frame Loss Ratio (FLR) with the measured FLR at the end of the test to declare the test result. If the measured value is greater than the specified value, the test is declared as ‛FAIL’, else it is considered to be ‛PASS’.
Frame Loss Ratio is computed as a ratio of the difference of number of received frames, to number of injected or sent frames, divided by the number of sent frames.
The no form of this command disables the comparison of the parameter with the measured value at the end of the test. The threshold value is ignored and not considered for declaring the test result.
Default
no loss-rising-threshold
Parameters
- threshold
Specifies the value for comparison with measured value. the loss-rising-threshold is specified as a number which denotes one ten-thousandth (1/10000) of a percent. For example, specifying a value of 1 is equivalent to 0.0001%, and specifying a value of 10000 is equivalent to 1%.
loss-rising-threshold-in
Syntax
[no] loss-rising-threshold-in in-profile-threshold
Context
configure>test-oam>testhead-profile>acceptance-criteria
Platforms
Supported on all 7210 SAS platforms as described in this document, including platforms configured in the access-uplink operating mode
Description
This command compares the specified value for the frame loss ratio (FLR) with the measured FLR for green or in-profile packets at the end of the test to declare the test result. If the measured value is greater than the specified value, the test is declared as ‛FAIL’, else it is considered to be ‛PASS’.
Frame Loss Ratio for green/in-profile packets is computed as a ratio of the difference of number of received green or in-profile frames to number of injected/sent green/in-profile frames divided by the number of sent green frames.
The no form of this command disables the comparison of the parameter with the measured value at the end of the test. The threshold value is ignored and not considered for declaring the test result.
Default
no loss-rising-threshold-in
Parameters
- in-profile-threshold
Specifies the value for comparison with measured value. The loss-rising-threshold is specified as a number which denotes one ten-thousandth (1/10000) of a percent. For example, specifying a value of 1 is equivalent to 0.0001%, and specifying a value of 10000 is equivalent to 1%.
loss-rising-threshold-out
Syntax
[no] loss-rising-threshold-out out-profile-threshold
Context
configure>test-oam>testhead-profile>acceptance-criteria
Platforms
Supported on all 7210 SAS platforms as described in this document, including platforms configured in the access-uplink operating mode
Description
This command compares the specified value for the frame loss ratio (FLR) with the measured FLR for yellow/out-of-profile packets at the end of the test to declare the test result. If the measured value is greater than the specified value, the test is declared as ‛FAIL’, else it is considered to be ‛PASS’.
Frame Loss ratio for yellow/out-of-profile packets is computed as a ratio of the difference of number of received yellow frames to number of injected/sent yellow frames divided by the number of sent yellow frames.
The no form of this command disables the comparison of the parameter with the measured value at the end of the test. The threshold value is ignored and not considered for declaring the test result.
Default
no loss-rising-threshold
Parameters
- out-profile-threshold
Specifies the value for comparison with measured value. The loss-rising-threshold is specified as a number which denotes one ten-thousandth (1/10000) of a percent. For example, specifying a value of 1 is equivalent to 0.0001%, and specifying a value of 10000 is equivalent to 1%.
pir-threshold
Syntax
[no] pir-threshold pir-threshold
Context
configure>test-oam>testhead-profile>acceptance-criteria
Platforms
Supported on all 7210 SAS platforms as described in this document, including platforms configured in the access-uplink operating mode
Description
This command compares the specified value for the PIR rate with the measured PIR rate at the end of the test to declare the test result. If the measured value is greater than the specified value, the test is declared as ‛PASS’, else it is considered to be ‛FAIL’.
The no form of this command disables the comparison of the parameter with the measured value at the end of the test. Basically, the threshold value is ignored and not considered for declaring the test result.
Default
no pir-threshold
Parameters
- threshold
Specifies the value, in kbps, for comparison with measured value.
description
Syntax
description profile-description
Context
config>test-oam>testhead-profile
Platforms
Supported on all 7210 SAS platforms as described in this document, including platforms configured in the access-uplink operating mode
Description
This command associates a description with the profile.
The no form the command removes description.
Parameters
- profile-description
Specifies a description for the profile.
dot1p
Syntax
[no] dot1p in-profile dot1p-value out-of-profile dot1p-value
Context
configure>test-oam>testhead-profile
Platforms
Supported on all 7210 SAS platforms as described in this document, including platforms configured in the access-uplink operating mode
Description
This command configures the Dot1p values to identify the in-profile or green packets and out-of-profile or yellow packets. The values configured using this command are used by the testhead tool on the local end (that is, the node on which the testhead tool is executed) to match the dot1p values received in the packet header and identify green and yellow packets and appropriately account the packets. These values are used only when the testhead tool is invoked with the parameter color-aware is set to ‛enable’.
The dot1p in-profile value (that is, packets with dot1p values in the L2 header equal to the dot1p-in-profile value configured is considered to be in-profile or green packet) is used to count the number of in-profile packets and measure the latency, jitter, and FLR for in-profile packets. Similarly, the dot1p out-profile is used to count the total out-of-profile or yellow packets and measure latency, jitter, and FLR for out-of-profile or yellow packets.
While the testhead tool is initiated, if color-aware is set to enable and no values are specified (that is, the no form of this command is used in the profile), the CLI gives an error. If values are specified, the configured values are used to match and identify in-profile and out-of-profile packets.
The no form of this command disables the use of dot1p to identify a green or yellow packet.
Testhead OAM tool does not mark the packets below CIR as in-profile packets and packets above CIR and below PIR as out-of-profile packets using the Dot1p or DSCP or other packet header bits to indicate the color of the packet (for example: DEI bit), as the 7210 SAS access SAP ingress does not support color-aware metering. It is used to only identify green and yellow packets and maintain a count of received green and yellow packets when the tests are run in color-aware mode.
Default
The no form of this command is the default. There are no defaults for the dot1p values.
Parameters
- in-profile dot1p-value
Specifies the dot1p value used to identify green or in-profile packets. It must be different from the value configured for yellow or out-of-profile packets.
- out-profile dot1p-value
Specifies the dot1p value used to identify green or out-of-profile packets. It must be different from the value configured for green or in-profile packets.
frame-payload
Syntax
[no] frame-payload frame-payload-id [payload-type [l2|tcp-ipv4|udp-ipv4|ipv4] create
Context
configure>test-oam>testhead-profile
Platforms
Supported on all 7210 SAS platforms as described in this document, including platforms configured in the access-uplink operating mode
Description
This command specifies the packet header values to be used in frames generated by the testhead tool.
User can create up to 4 different types of frame payload representing different kinds of traffic, within a profile. User chooses one among these when starting the throughput test.
The parameter payload-type determines the packet header fields that are used to populate the frame generated by the testhead OAM tool. The packet header fields use the value from the parameters configured under the frame-payload. For example, when the payload-type is configured as ‟l2”, software uses the parameters src-mac, dst-mac, vlan-tag-1 (if configured), vlan-tag-2 (if configured), ethertype, and data-pattern. See the following for parameters used when other values are specified with payload-type.
The no form of this command removes the frame payload context.
Parameters
- frame-payload-id
A number to identify the frame-payload. it is an integer used to identify the frame type to use when starting the throughput test.
- frame-payload-type
Identifies whether the frame payload is L2 traffic, IP traffic, TCP/IP traffic or UDP/IP traffic and uses appropriate parameters to build the frame to be generated by the testhead OAM tool. It defaults to tcp-ipv4, if the user does not specify the value during creation of the new frame-payload.
data-pattern
Syntax
[no] data-pattern data-pattern
Context
configure>test-oam>testhead-profile>frame-payload
Platforms
Supported on all 7210 SAS platforms as described in this document, including platforms configured in the access-uplink operating mode
Description
This command specifies the data pattern to populate the payload portion of the frame generated by the testhead tool.
This value can be specified if the payload-type is configured as l2 or ipv4 or tcp-ipv4 or udp-ipv4. For all these payload types, the frame with the appropriate headers is created and the payload portion of the frame, is filled up with the data-pattern-value specified with this command, repeating it as many times as required to fill up the remaining length of the payload.
The no form of this command uses the default data-pattern value of 0xa1b2c3d4e5f6.
Default
no data-pattern
Parameters
- data-pattern
Specifies the data-pattern to fill the payload data.
description
Syntax
[no] description frame-description
Context
configure>test-oam>testhead-profile>frame-payload
Platforms
Supported on all 7210 SAS platforms as described in this document, including platforms configured in the access-uplink operating mode
Description
This command adds a description to the frame type created to describe the purpose or identify the usage or any other such purpose.
The no form of this command removes the description.
Default
no description
Parameters
- frame-description
An ASCII string used to describe the frame.
dscp
Syntax
[no] dscp dscp-name
Context
configure>test-oam>testhead-profile>frame-payload
Platforms
Supported on all 7210 SAS platforms as described in this document, including platforms configured in the access-uplink operating mode
Description
This command specifies the IP DSCP value to use in the IP header for the frame generated by the testhead tool.
This value can be specified if the payload-type is configured as ipv4 or tcp-ipv4 or udp-ipv4 and if configured is used by the testhead tool to populate the IP DSCP field of the IP header. If it is not specified it defaults to 0 when the payload type is ipv4, tcp-ipv4, and udp-ipv4. The testhead tool does not use the value specified with this command if the payload-type is ‟l2”.
-
If both IP DSCP and IP ToS is configured, IP DSCP take precedence.
-
If IP DSCP is not configured, but IP ToS is configured, the IP ToS value is used.
The no form of this command indicates that the field is not to be used in the frame generated by the tool.
Default
no dscp
Parameters
- dscp-name
Specifies the IPv4 DSCP value to use in the IP header.
dst-ip
Syntax
[no] dst-ip ipv4 ipv4-address
Context
configure>test-oam>testhead-profile>frame-payload
Platforms
Supported on all 7210 SAS platforms as described in this document, including platforms configured in the access-uplink operating mode
Description
This command specifies the destination IPv4 address to use in the IP header for the frame generated by the testhead tool.
This value must be specified if the payload-type is configured as ipv4 or tcp-ipv4 or udp-ipv4. The testhead tool does not use the value specified with this command if the payload-type is ‟l2”.
The no form of this command indicates that the field is not to be used in the frame generated by the tool.
Default
no dst-ip, if the payload-type is set to ipv4, tcp-ipv4, udp-ipv4.
Parameters
- ipv4-address
Specifies the IPv4 destination IP address to use in the IP header.
dst-mac
Syntax
[no] dst-mac mac-address
Context
configure>test-oam>testhead-profile>frame-payload
Platforms
Supported on all 7210 SAS platforms as described in this document, including platforms configured in the access-uplink operating mode
Description
Specifies the value of source MAC address to use in the frame generated by the testhead OAM tool. Only unicast MAC address must be specified.
This value must be specified for all possible values of payload-type.
The no form of this command indicates that the field is not to be used in the frame generated by the tool.
Default
no dst-mac
Parameters
- mac-address
Specify the unicast source MAC address.
dst-port
Syntax
[no] dst-port
Context
configure>test-oam>testhead-profile>frame-payload
Platforms
Supported on all 7210 SAS platforms as described in this document, including platforms configured in the access-uplink operating mode
Description
This command specifies the destination port to use in the TCP header for the frame generated by the testhead tool.
This value must be specified if the payload-type is configured as tcp-ipv4 or udp-ipv4. The testhead tool does not use the value specified with this command if the payload-type is l2 or ipv4.
The no form of this command indicates that the field is not to be used in the frame generated by the tool.
Default
no dst-port, if the payload-type is set to tcp-ipv4 or udp-ipv4
Parameters
- dst-port-number
Specifies the destination TCP/UDP port number to use in the frame’s TCP/UDP header.
ethertype
Syntax
[no] ethertype ethertype-value
Context
configure>test-oam>testhead-profile>frame-payload
Platforms
Supported on all 7210 SAS platforms as described in this document, including platforms configured in the access-uplink operating mode
Description
This command specifies the ethertype of the frame generated by the testhead tool.
This value must be specified if the payload-type is ‟l2”. The testhead tool uses the value specified with this command only if the payload-type is ‟l2”. For all other values of payload-type, the ethertype value used in the frame generated by the testhead tool uses specific value based on the payload-type. See the frame-payload CLI description for more information.
The no form of this command indicates that the field is not to be used in the frame generated by the tool.
Default
no ethertype, if the payload-type is set to l2, else the values used depends on the payload-type specified.
Parameters
- ethertype-value
Specifies the frame payload ethertype value.
ip-proto
Syntax
[no] ip-proto ip-protocol-number
Context
configure>test-oam>testhead-profile>frame-payload
Platforms
Supported on all 7210 SAS platforms as described in this document, including platforms configured in the access-uplink operating mode
Description
This command specifies the IP protocol value to use in the IP header for the frame payload generated by the testhead tool.
This value must be specified if the payload-type is configured as ipv4. If the payload-type is specified as tcp-ipv4 or udp-ipv4, the appropriate standard defined values are used. The testhead tool does not use the value specified with this command if the payload-type is ‟l2”.
The no form of this command indicates that the field is not to be used in the frame generated by the tool.
Default
no ip-proto
Parameters
- ip-protocol-number
Specifies the IP-protocol number to use in the IP header.
ip-tos
Syntax
[no] ip-tos type-of-service
Context
configure>test-oam>testhead-profile>frame-payload
Platforms
Supported on all 7210 SAS platforms as described in this document, including platforms configured in the access-uplink operating mode
Description
This command specifies the IP TOS (Type of Service) value to use in the IP header for the frame generated by the testhead tool.
This value can be specified if the payload-type is configured as ipv4 or tcp-ipv4 or udp-ipv4 and if configured is used by the testhead tool to populate the IP TOS field of the IP header. If it is not specified it defaults to 0 when the payload type is ipv4, tcp-ipv4, and udp-ipv4. The testhead tool does not use the value specified with this command if the payload-type is ‟l2”.
-
If both IP DSCP and IP ToS are configured, IP DSCP takes precedence.
-
If IP DSCP is not configured, but IP ToS is configured, the IP ToS value is used.
The no form of this command indicates that the field is not to be used in the frame generated by the tool.
Default
no ip-tos
Parameters
- type-of-service
Specifies the value of ToS bits to use in the IP header.
ip-ttl
Syntax
[no] ip-ttl ttl-value
Context
configure>test-oam>testhead-profile>frame-payload
Platforms
Supported on all 7210 SAS platforms as described in this document, including platforms configured in the access-uplink operating mode
Description
This command specifies the IP TTL (Time-to-Live) value to use in the IP header for the frame generated by the testhead tool.
This value can be specified if the payload-type is configured as ipv4 or tcp-ipv4 or udp-ipv4 and if configured is used by the testhead tool to populate the IP TTL field of the IP header. If it is not specified it defaults to 1 when the payload type is ipv4, tcp-ipv4, and udp-ipv4. The testhead tool does not use the value specified with this command if the payload-type is ‟l2”.
The no form of this command indicates that the field is not to be used in the frame generated by the tool.
Default
no ip-ttl
Parameters
- ttl-value
Specifies the IP TTL value, as a decimal number, to use in the IP header.
src-ip
Syntax
[no] src-ip ipv4 ipv4-address
Context
configure>test-oam>testhead-profile>frame-payload
Platforms
Supported on all 7210 SAS platforms as described in this document, including platforms configured in the access-uplink operating mode
Description
This command specifies the source IPv4 address to use in the IP header for the frame generated by the testhead tool.
This value must be specified if the payload-type is configured as ipv4 or tcp-ipv4 or udp-ipv4. The testhead tool does not use the value specified with this command if the payload-type is ‟l2”.
The no form of this command indicates that the field is not to be used in the frame generated by the tool.
Default
no src-ip, if the payload-type is set to ipv4, tcp-ipv4, udp-ipv4.
Parameters
- ipv4-address
Specifies the IPv4 source IP address to use in the IP header.
src-mac
Syntax
[no] src-mac mac-address
Context
configure>test-oam>testhead-profile>frame-payload
Platforms
Supported on all 7210 SAS platforms as described in this document, including platforms configured in the access-uplink operating mode
Description
This command specifies the unicast source MAC address to use in the frame generated by the testhead OAM tool.
This value must be specified for all possible values of payload-type.
The no form of this command indicates that the field is not to be used in the frame generated by the tool.
Default
no src-mac
Parameters
- mac-address
Specifies the unicast source MAC address.
src-port
Syntax
[no] src-port src-port-number
Context
configure>test-oam>testhead-profile>frame-payload
Platforms
Supported on all 7210 SAS platforms as described in this document, including platforms configured in the access-uplink operating mode
Description
This command specifies the source port to use in the TCP header for the frame generated by the testhead tool.
This value must be specified if the payload-type is configured as tcp-ipv4 or udp-ipv4. The testhead tool does not use the value specified with this command if the payload-type is l2 or ipv4.
The no form of this command indicates that the field is not to be used in the frame generated by the tool.
Default
no src-port, if the payload-type is set to tcp-ipv4 or udp-ipv4
Parameters
- src-port-number
Specifies the source TCP/UDP port number to use in the frame’s TCP/UDP header.
vlan-tag-1
Syntax
[no] vlan-tag-1 vlan-id vlan-id-value [tpid tpid value] [dot1p dot1p-value]
Context
configure>test-oam>testhead-profile>frame-payload
Platforms
Supported on all 7210 SAS platforms as described in this document, including platforms configured in the access-uplink operating mode
Description
This command specifies the values to be used for the outermost vlan-tag (often called the outer vlan) in the frame generated by the testhead OAM tool. The tool uses the values specified for VLAN ID, dot1p bits and TPID in populating the outermost VLAN tag in the frame generated.
Configuration of this parameter is optional and it is used for all possible values of payload-type, if configured.
The no form of this command indicates that the field is not to be used in the frame generated by the tool.
The user must ensure that TPID/Ethertype configured with this command matches the QinQ Ethertype value in use on the port on which the test SAP is configured or must match 0x8100 if the test SAP is configured on a Dot1q encapsulation port, for the frame generated by the tool to be processed successfully on SAP ingress. If this value does not match the one configured under the port, frames generated by the testhead are dropped by the node on SAP ingress because of ethertype mismatch.
The user must ensure that VLAN ID configured with this command matches the outermost VLAN tag of the QinQ SAP or the Dot1q SAP used for the test SAP for the frame generated by the tool to be processed successfully on SAP ingress. If this value does not match the one configured for the SAP, frames generated by the testhead are dropped by the node on SAP ingress because of VLAN ID mismatch.
The Dot1p bits specified for the outermost tag can be used for SAP ingress QoS classification.
Default
no vlan-tag-1
Parameters
- vlan-id-value
Specifies the VLAN ID to use to populate the VLAN ID value of the VLAN tag. No defaults are chosen and the user has to specify a value to use, if they configure this command.
- tpid-value
Specifies the TPID (also known as, ethertype) to use for the VLAN tag addition. It defaults to 0x8100 if user does not specify it.
- Dot1p-value
Specifies the Dot1p value to use to populate the Dot1p bits in the VLAN tag. It defaults to 0, if the user does not specify it.
vlan-tag-2
Syntax
[no] vlan-tag-2 vlan-id vlan-id-value [tpid tpid value] [dot1p dot1p-value]
Context
configure>test-oam>testhead-profile>frame-payload
Platforms
Supported on all 7210 SAS platforms as described in this document, including platforms configured in the access-uplink operating mode
Description
This command specifies the values to be used for the second vlan-tag (often called the inner vlan or the C-vlan) in the frame generated by the testhead OAM tool. The tool uses the values specified for VLAN ID, dot1p bits and TPID in populating the second VLAN tag in the frame generated.
Configuration of this parameter is optional and it is used for all possible values of payload-type, if configured.
The no form of this command indicates that the field is not to be used in the frame generated by the tool.
The user must ensure that TPID/Ethertype configured with this command is 0x8100 for the frame generated by the tool to be processed successfully on SAP ingress. If this value does not match 0x8100, frames generated by the testhead are dropped by the node on SAP ingress because of Ethertype mismatch (7210 supports only 0x8100 as the Ethertype value for the inner vlan tag).
The user must ensure that VLAN ID configured with this command matches the outermost VLAN tag of the QinQ SAP or the Dot1q SAP used for the test SAP for the frame generated by the tool to be processed successfully on SAP ingress. If this value does not match the one configured for the SAP, frames generated by the testhead are dropped by the node on SAP ingress because of VLAN ID mismatch.
The Dot1p bits specified for the outermost tag can be used for SAP ingress QoS classification.
Default
no vlan-tag-2
Parameters
- vlan-id-value
Specifies the VLAN ID to use to populate the VLAN ID value of the VLAN tag. No defaults are chosen and user has to specify a value to use, if they configure this command.
- tpid-value
Specifies the TPID (also referred to as, ethertype) to use for the VLAN tag addition. It defaults to 0x8100 if user does not specify it.
- Dot1p-value
Specifies the Dot1p value to use to populate the Dot1p bits in the VLAN tag. It defaults to 0, if the user does not specify it.
frame-size
Syntax
[no] frame-size [64 to 9212]
Context
config>test-oam>testhead-profile
Platforms
Supported on all 7210 SAS platforms as described in this document, including platforms configured in the access-uplink operating mode
Description
This command specifies the frame size of the packets generated by the testhead tool. Any frame size in the specific range can be specified.
The no form of this command reverts to the default value.
Default
1514
Parameters
- frame-size
Specifies the size, in bytes, of the frame generated by the testhead tool.
rate
Syntax
rate cir cir-rate-in-kbps [adaptation-rule adaptation-rule] [pir pir-rate-in-kbps]
no rate
Context
config>test-oam>testhead-profile
Platforms
Supported on all 7210 SAS platforms as described in this document, including platforms configured in the access-uplink operating mode
Description
This command configures the committed information rate (CIR) and peak information rate (PIR) for a testhead profile.
The testhead uses the Layer 2 rate, which is calculated by subtracting the Layer 1 overhead that is caused when the IFG and Preamble are added to every Ethernet frame (typically about 20 bytes (IFG = 12 bytes and Preamble = 8 bytes)). The testhead tool uses the user-configured frame size to compute the Layer 2 rate and does not allow the user to configure a value greater than that rate. For 512-byte Ethernet frames, the L2 rate is 962406 Kb/s and the Layer 1 rate is 1 Gb/s.
If the optional PIR rate is not specified, the testhead tool generates traffic up to the configured CIR rate. The CIR rate specifies the bandwidth or throughput that the user needs to validate. If specified, the PIR value must be greater than or equal to the CIR value. The testhead tool then generates traffic up to the configured PIR value.
Configure the adaptation-rule parameter to derive the operational hardware rate for both the CIR and PIR. The software finds the best operational rate based on the user-specified constraint and the hardware-based rate supported on the platform. See the 7210 SAS-Mxp, R6, R12, S, Sx, T Quality of Service Guide for more information about the hardware rate steps supported for testhead traffic generator meters on different platforms.
The no form of this command sets the CIR to the default value; the PIR value is not set. Consequently, if the testhead tool is run after the no rate command is run, the test generates traffic up to the configured CIR rate.
Default
rate cir 1000 adaptation-rule closest
Parameters
- cir-rate-in-kbps
Specifies the cir parameter, in kilobits per second (Kb/s), which overrides the default CIR value. The configured value must be a positive integer; fractional values are not allowed. The actual CIR rate depends on the meter adaptation-rule parameters and the hardware. If the rate command is not executed or the CIR parameter is not explicitly configured, the default CIR value applies.
- adaptation-rule
Specifies the constraints enforced when adapting the CIR and PIR, defined using the rate command, to the hardware rates supported by the platform. The adaptation-rule parameter requires a qualifier that defines the constraint used to derive the operational CIR and PIR. If the adaptation-rule is not specified, the default of closest applies. The max (maximum), min (minimum), and closest qualifiers are mutually exclusive.
- pir-rate-in-kbps
Specifies the pir parameter, in kilobits per second (Kb/s), which overrides the default administrative PIR value. The configured value must be a positive integer; fractional values are not allowed. The actual PIR rate depends on the meter adaptation-rule parameters and the hardware. If the rate command is not executed or the PIR parameter is not explicitly specified, the default PIR value is used.
test-completion-trap-enable
Syntax
[no] test-completion-trap-enable
Context
configure>test-oam>testhead-profile
Platforms
Supported on all 7210 SAS platforms as described in this document, including platforms configured in the access-uplink operating mode
Description
This command specifies that the test completion trap needs to be generated after the completion of the test or if the test is stopped. The trap contains the details of test configuration, the measured values, test completion status and PASS or FAIL result.
The no form of this command disables the generation of the event/log/trap after test completion.
Default
no test-completion-trap-enable
test-duration
Syntax
test-duration {[hours hours] [minutes minutes] [seconds seconds]}
Context
config>test-oam>testhead-profile
Platforms
Supported on all 7210 SAS platforms as described in this document, including platforms configured in the access-uplink operating mode
Description
This command specifies the total test duration to be used for throughput measurement. The hours, minutes, and seconds specify the total duration of the throughput measurement. If all the parameters are specified together, the total test duration is set to the sum of the values specified for hours, minutes and seconds.
The no form of this command sets the value to the default value
Default
3 minutes
Parameters
- hours
Specifies the total number of hours to run the test. The total test duration is determined by the sum of the hours, minutes and seconds specified by the user.
- minutes
Specifies the total number of minutes to run the test. The total test duration is determined by the sum of the hours, minutes and seconds specified by the user.
- seconds
Specifies the total number of seconds to run the test. The total test duration is determined by the sum of the hours, minutes and seconds specified by the user.
OAM testhead commands
testhead
Syntax
testhead test-name [owner owner-name] testhead-profile profile-id [frame-payload frame-payload-id] sap sap-id [fc fc-name] [acceptance-criteria acceptance-criteria-id [color-aware enable | disable]] [enforce-fc-check enable | disable]
testhead test-name [owner owner-name] stop
Context
oam
Platforms
Supported on all 7210 SAS platforms as described in this document, including platforms configured in the access-uplink operating mode
Description
This command executes the throughput test by generating traffic up to the configured rate and measuring the delay, delay-variation, and frame-loss ratio. At the end of the test run, the testhead command compares the measured values against the test acceptance criteria that is specified to determine whether the service is within bounds of the acceptance criteria. It reports a pass if the configured rate thresholds are achieved and the measured performance parameter (that is, latency, jitter, and FLR) values are less than the thresholds configured in the acceptance criteria. It reports a failure if the configured rate thresholds are not achieved or if any of the measured values for the performance parameters exceeds the thresholds configured in the acceptance criteria.
The user must specify the testhead-profile parameter, which determines traffic generation rate and the content of the frames used for traffic generation. If both the CIR and PIR is specified, or if only the PIR is specified (by setting CIR to zero), the tool generates traffic up to the configured PIR. If only the CIR is specified, the tool generates traffic up to the configured CIR.
If the acceptance-criteria parameter is not specified and color-aware is set to disable by default, the software displays the test result as ‟PASS” if the frame loss is zero and desired rate is achieved. For comparison with the measured rate, the test uses the configured CIR, if only the CIR is configured, or it uses the PIR, if either only the PIR is specified or both the CIR and PIR are set to non-zero values. Measured values of latency, jitter, and delay variation are not compared.
If the acceptance-criteria parameter is not specified and color-aware is set to enable, the software displays the test result as ‟PASS” if the measured CIR and PIR match the configured CIR and PIR values and frame loss is zero, or if one of the following is true:
the measured throughput rate (CIR + PIR) is equal to the configured CIR rate and if no PIR rate is configured
the measured throughput rate (CIR + PIR) is equal to the configured PIR rate and if either no CIR rate is configured or if the CIR rate is configured
Otherwise, the test is declared failed. Measured values of latency, jitter, and delay variation are not compared.
If acceptance-criteria is specified and color-aware is set to enable, the test uses the configured packet header marking values (dot1p) to identify the color of the packet and classify it as green (in-profile) or yellow (out-of-profile). It measures the green packet (CIR) and the green/in-profile packet performance parameter values and the yellow packet rate (PIR) and the yellow/out-of-profile packet performance parameter values individually based on the packet markings. In addition to comparing the measured performance parameter values against the normal performance parameter threshold values (if enabled), if the user has enabled in/out thresholds for performance parameters in the acceptance criteria, the tool uses these values to compare against the measured values and declare a pass or fail result. The tool uses the cir-threshold and pir-threshold to compare against the measured CIR and PIR throughput rates and declare pass or fail if the thresholds specified by the cir-threshold and pir-threshold are achieved.
When color-aware mode is set to enable, the marking values used to identify both in-profile/green packet and out-of-profile/yellow packet must be configured. If either of the packet header marking values (for example, dot1p) is not configured by the user, the CLI displays an error.
If acceptance-criteria is specified and color-aware is set to disable, the tests are color blind (not color-aware). The tool does not use the configured packet header marking values to identify the color of the packet and treats all packets the same. The tool uses the normal thresholds configured in the acceptance-criteria (that is, the threshold values other than the in/out profile thresholds) to compare the measured values and declare a pass or fail result. The tool does not attempt to compare the in/out thresholds against measured values. The tool uses the cir-threshold and pir-threshold as follows.
If no PIR is configured and if the measured throughput rate is equal to the configured cir-threshold rate, the desired rate is said to have been achieved and the tests continue to compare the measured performance parameter thresholds with the configured performance parameter thresholds (if any).
If PIR rate is configured and no CIR is configured and if the measured throughput rate is equal to the configured pir-threshold rate, the desired rate is said to have been achieved and the tests continue to compare the measured performance parameter thresholds with the configured performance parameter thresholds (if any).
If PIR is configured and CIR is configured, and if the measured throughput rate is equal to the configured pir-threshold rate, the desired rate is said to have been achieved and the tests continue to compare the measured performance parameter thresholds with the configured performance parameter thresholds (if any).
The test-name and owner-name together uniquely identify a particular testhead invocation or session. The results of the testhead session are associated with the test-name and owner-name. Use these parameters to display the results of the testhead tool and to clear the results of a completed run. Multiple invocations of the testhead tool with the same test-name and owner-name is not allowed if the results of the old run using the same pair of test-name and owner-name are present. That is, the results are not overwritten when the testhead is invoked again with the same values for test-name and owner-name. The results must be cleared explicitly using the clear command before invoking the testhead tool with the same test-name and owner-name. Results for up to 100 unique sessions, each using a different test-name and owner-name, are saved in memory (that is, the results are not available for use after a reboot).
The testhead command is not saved in the configuration file after a reboot.
See Prerequisites for using the testhead tool for more information.
Parameters
- test-name
Specifies the test name as an ASCII string up to 32 characters.
- owner test-owner
Specifies the testhead operation owner as an ASCII string up to 32 characters.
- testhead-profile profile-id
Specifies the testhead profile ID to use with this run or session of testhead invocation. The user must configure the testhead profile beforehand using the commands in config>test-oam>testhead-profile context.
- frame-payload frame-payload-id
Specifies the frame payload ID to use for this run. It configures the parameters used to construct the frame generated by the testhead tool. If this parameter is not specified, the run, by default, uses parameters configured under frame-payload-id 1.
- acceptance-criteria acceptance-criteria-id
Specifies the test acceptance criteria parameters to use for this run. It identifies the parameters used to compare the measured performance values against the configured thresholds configured in the acceptance criteria. If this parameter is not specified, the run is declared pass if the throughput configured in the testhead-profile is achieved without any loss.
- color-aware enable | disable
Keyword to execute color-aware tests. If set to enable, the color-aware test is enabled. If set to disable, the non-color-ware test is enabled.
- sap sap-id
Specifies the test SAP. This parameter must be specified by the user.
See Configuration guidelines for more information.
- fc fc-name
Specifies the forwarding class (FC) to use to send the frames generated by the testhead tool.
- stop
Keyword to stop the currently running test, if there is one. All performance results based on the data available up to the time the test is stopped are used to determine the pass or fail criteria. Additionally, the test-status displays ‟Stopped” and test completion status is marked ‟Incomplete” or ‟No”.
- enforce-fc-check enable | disable
Keyword to enable or disable a check on the local node where the testhead OAM tool is run. The check ensures that the traffic generated by the testhead tool is received in the queue corresponding to the FC specified by the fc fc-name parameter.
OAM Performance Monitoring, bin group, and session commands
oam-pm
Syntax
oam-pm session session-name {dmm | slm | twamp-light} {start | stop}
Context
oam
Platforms
Supported on all 7210 SAS platforms as described in this document, including platforms configured in the access-uplink operating mode
Description
This command allows the operator to start and stop on-demand OAM-PM sessions.
Parameters
- session-name
Identifies the session name, up to 32 characters, that the test is associated with.
- dmm
Specifies the DMM test that is affected by the command.
- slm
Specifies the SLM test that is affected by the command.
- twamp-light
Specifies the TWAMP-Light test that is affected by the command.
- start
Keyword to manually start the test.
- stop
Keyword to manually stop the test.
oam-pm
Syntax
oam-pm
Context
config
Platforms
Supported on all 7210 SAS platforms as described in this document, including platforms configured in the access-uplink operating mode
Description
Commands in this context configure storage parameters (including binning structures), availability/resiliency, and the individual proactive and on-demand tests used to gather performance and statistical data.
bin-group
Syntax
bin-group bin-group-number [fd-bin-count fd-bin-count fdr-bin-count fdr-bin-count ifdv-bin-count ifdv-bin-count create]
no bin-group bin-group-number
Context
config>oam-pm
Platforms
Supported on all 7210 SAS platforms as described in this document, including platforms configured in the access-uplink operating mode
Description
This command configures the parameters for a specific bin group. Bin-group 1 is a default bin group and cannot be modified. If no bin group is assigned to an OAM-PM session, bin-group 1 is assigned by default. The default values for bin-group 1 are fd-bin-count 3 bin 1 lower-bound 5000 bin 2 lower-bound 10000, fdr-bin-count 2 bin 1 lower-bound 5000, and ifdv-bin-count 2 bin 1 lower-bound 5000.
The no form of this command removes the specified bin group.
Parameters
- bin-group-number
Specifies the numerical identifier for a bin group. A bin group can only shut down and modified when all of the PM sessions referencing the bin group have been shut down. The bin group description may still be modified for active bin groups.
- fd-bin-count
Specifies the number of frame delay bins that are created.
- fdr-bin-count
Specifies the number of frame delay range bins that are created.
- ifdv-bin-count
Specifies the number of inter-frame delay variation bins that are created.
- create
Creates the specified bin group.
bin-type
Syntax
bin-type {fd | fdr | ifdv}
no bin-type
Context
config>oam-pm>bin-group
Platforms
Supported on all 7210 SAS platforms as described in this document, including platforms configured in the access-uplink operating mode
Description
This command enables the specified delay metric configuration context.
The no form of this command restores the default value.
Default
bin-type fd
Parameters
- fd
Enters the frame delay bin threshold configuration context.
- fdr
Enters the frame delay range bin threshold configuration context.
- ifdv
Enters the inter-frame delay variation bin threshold configuration context.
bin
Syntax
bin bin-number
Context
config>oam-pm>bin-group>bin
Platforms
Supported on all 7210 SAS platforms as described in this document, including platforms configured in the access-uplink operating mode
Description
This command configures the floor threshold for an individual bin.
Parameters
- bin-number
Specifies the bin to configure.
lower-bound
Syntax
lower-bound microseconds
no lower-bound
Context
config>oam-pm>bin-group>bin-type>bin
Platforms
Supported on all 7210 SAS platforms as described in this document, including platforms configured in the access-uplink operating mode
Description
This command configures the lower threshold for an individual bin. The operator does not have to specific a lower threshold for every bin that was previously defined by the bin-count for the specific type. By default, the lower threshold for each bin is the bin-number * 5000 microseconds. Lower thresholds in the previous adjacent bin must be lower than the threshold of the next higher bin threshold; otherwise, an error prevents the bin from entering the active state when the no shutdown command is issued for the bin group. Bin 0 is the result of the difference between 0 and the configured lower-bound of bin 1. The highest bin in the bin-count captures every result above the threshold. Any negative delay metric result is treated as zero and placed in bin 0.
The no form of this command restores the default threshold for the bin.
Parameters
- microseconds
Specifies the lower threshold for the bin, in microseconds.
delay-event
Syntax
delay-event {forward | backward | round-trip} lowest-bin bin-number
threshold raise-threshold [clear clear-threshold]
[no] delay-event {forward | backward | round-trip}
Context
config>oam-pm>bin-group>bin-type
Platforms
Supported on all 7210 SAS platforms as described in this document, including platforms configured in the access-uplink operating mode
Description
This command configures the bin number, threshold, and direction that are monitored to determine if a delay metric threshold crossing event has occurred or has cleared. It requires a bin number, a rising threshold value and a direction. If the [clear threshold] is not specified, the traffic crossing alarm is stateless. Stateless means the state is not carried forward to other measurement intervals. Each measurement interval is analyzed independently and without regard to any previous window. When a raise threshold is reached, the log event is generated. Each unique threshold can only be raised once for the threshold within measurement interval. If the optional clear threshold is specified, the traffic crossing alarm uses stateful behavior. Stateful means each unique previous event state is carried forward to following measurement intervals. If a threshold crossing event is raised another is not raised until a measurement interval completes, and the clear threshold has not been exceeded. A clear event is raised under that condition. In general, alarms are generated when there is a state change. The thresholds configured are applied to the count in specified bin and all higher number bins.
The no version of this command removes thresholding for this delay metric. The complete command must be configured to remove the specific threshold.
Default
[no] delay-events
Parameters
- forward
Specifies that the threshold is applied to the forward direction bin.
- backward
Specifies that the threshold is applied to the backward direction bin.
- round-trip
Specifies that the threshold is applied to the roundtrip direction bin.
- lowest-bin bin-number
Specifies the number of the bin to which the threshold is applied. This bin and all higher bins monitor the sum total results in these bins to determine if they have reached or crossed the configured threshold.
- threshold raise-threshold
Specifies the rising numerical value in the range that determines when the event is to be generated, when value reached.
- clear clear-threshold
Specifies an optional numerical value in the range threshold used to indicate stateful behavior that allows the operator to configure a lower value than the rising threshold that determines when the clear event should be generated. Clear is generated when the end of measurement interval count is less than or equal to the configured value. If this option is not configured, the behavior is stateless. Zero means no results can existing in the lower bin or any higher.
description
Syntax
description description-string
no description
Context
config>oam-pm>bin-group
config>oam-pm>session
Platforms
Supported on all 7210 SAS platforms as described in this document, including platforms configured in the access-uplink operating mode
Description
This command creates a text description stored in the configuration file for a configuration context. The description command associates a text string with a configuration context to help identify the content in the configuration file.
The no form of this command removes the string from the configuration.
Parameters
- description-string
Specifies the description character string. Allowed values are any characters up to 80 characters composed of printable, 7-bit ASCII characters. If the string contains special characters (#, $, spaces, and so on), the entire string must be enclosed in double quotes.
shutdown
Syntax
[no] shutdown
Context
config>oam-pm>bin-group
config>oam-pm>session>ethernet>dmm
config>oam-pm>session>ethernet>slm
Platforms
Supported on all 7210 SAS platforms as described in this document, including platforms configured in the access-uplink operating mode
Description
This command activates and deactivates the bin group or test.
When a bin group is active, only the description of the bin group can be modified. The bin group can only be shut down and modified when all references in the various PM sessions or individual tests have been shut down. If an active PM session is referencing the bin group, it generates an error indicating there are a number of active tests referencing the bin group, and it cannot be shut down.
When a test is shut down, no active measurements are made and any outstanding requests are ignored. If the test is started or stopped during a measurement interval, the suspect flag is set to ‟yes” to indicate that the data for the specific data set is in questionable.
The no form of this command activates the bin group or test.
session
Syntax
session session-name [test-family {ethernet | ip} [session-type {proactive | on-demand}] create]
no session session-name
Context
config>oam-pm
Platforms
Supported on all 7210 SAS platforms as described in this document, including platforms configured in the access-uplink operating mode
Description
This command configures the individual session containers that house the test-specific configuration parameters. Since this session context provides only a container abstract to house the individual test functions, it cannot be shut down. Only individual tests sessions within the container may be shut down. No values, parameters, or configuration within this context may be changed if any individual test is active. Changes may only be made when all tests within the context are shut down, with the exception of the description.
The no form of this command removes the session.
Parameters
- session-name
Specifies the name of the session container. 32 characters maximum.
- ethernet
Specifies that the test is based on the Ethernet layer.
- ip
Specifies that the test is based on the IP layer.
- proactive
Specifies that the test is always on, with no stop. Tests are proactive by default.
- on-demand
Specifies that the test runs on demand, with an immediate start and no stop, or a stop based on offset.
- create
Creates the session container.
bin-group
Syntax
bin-group bin-group-number
no bin-group
Context
config>oam-pm>session
Platforms
Supported on all 7210 SAS platforms as described in this document, including platforms configured in the access-uplink operating mode
Description
This command links the individual test to the group of bins that map the probe responses.
The no form of this command installs the default bin-group 1 as the bin group for the session.
Default
bin-group 1
Parameters
- bin-group-number
Specifies the number of the bin-group that is referenced during this session.
ethernet
Syntax
ethernet
Context
config>oam-pm>session
Platforms
Supported on all 7210 SAS platforms as described in this document, including platforms configured in the access-uplink operating mode
Description
Commands in this context configure Ethernet-specific source and destination information, priority, and Ethernet test tools on the launch point.
dest-mac
Syntax
dest-mac ieee-address
no dest-mac
Context
config>oam-pm>session>ethernet
Platforms
Supported on all 7210 SAS platforms as described in this document, including platforms configured in the access-uplink operating mode
Description
This command defines the destination MAC address of the peer MEP and sets the destination MAC address in the Layer 2 header to match. This must be a unicast address.
The no form of this command removes the session parameter.
Parameters
- ieee-address
Specifies the Layer 2 unicast MAC address of the destination MEP.
dmm
Syntax
dmm [test-id test-id] [create]
no dmm
Context
config>oam-pm>session>ethernet
Platforms
Supported on all 7210 SAS platforms as described in this document, including platforms configured in the access-uplink operating mode
Description
This command configures the test ID to be assigned to the delay test, and creates the container to allow the individual test parameters to be configured.
The no form of this command removes the DMM test function from the PM session.
Parameters
- test-id
Specifies the value to be placed in the 4-byte test ID field of the ETH-DMM PDU.
- create
Creates the test.
data-tlv-size
Syntax
data-tlv-size octets
no data-tlv-size
Context
config>oam-pm>session>ethernet>dmm
config>oam-pm>session>ethernet>slm
Platforms
Supported on all 7210 SAS platforms as described in this document, including platforms configured in the access-uplink operating mode
Description
This command is used to add an optional Data TLV to the PDU and increase the frame on the wire by the specified amount. This value is not the total size of the frame on the wire, but rather the size of the additional padding added to the PDU.
The no form of this command removes the optional TLV.
Default
data-tlv-size 0
Parameters
- octets
Specifies the size of the optional Data TLV, in octets.
interval
Syntax
interval milliseconds
no interval
Context
config>oam-pm>session>ethernet>dmm
Platforms
Supported on all 7210 SAS platforms as described in this document, including platforms configured in the access-uplink operating mode
Description
This command configures the message period, or probe spacing, for the transmission of DMM frames.
The no form of this command restores the default value.
Default
interval 1000
Parameters
- milliseconds
Specifies the number of milliseconds between the transmission of DMM frames. The default value for the DMM interval is intentionally different from the default value for the SLM interval.
test-duration
Syntax
test-duration seconds
no test-duration
Context
config>oam-pm>session>ethernet>dmm
config>oam-pm>session>ethernet>slm
Platforms
Supported on all 7210 SAS platforms as described in this document, including platforms configured in the access-uplink operating mode
Description
This command defines the length of time the test runs before stopping automatically. This command is only a valid option when a session has been configured with a session-type of on-demand. This is not an option when the session-type is configured as proactive. All tests start immediately following the execution of a no shutdown command.
The test duration value, remaining time, or completed state, is not synchronized with the backup CPM. This means that a failover re-launches any active test without regard to the test-duration timer on the previously active CPM. When the test starts on the newly active CPM, the test-duration is reset to the beginning.
The no form of this command removes a previously configured test-duration and allows the test to execute until manually stopped.
Parameters
- seconds
Specifies the interval, in seconds, during which the test continues to execute after the start time.
priority
Syntax
priority priority
no priority
Context
config>oam-pm>session>ethernet
Platforms
Supported on all 7210 SAS platforms as described in this document, including platforms configured in the access-uplink operating mode
Description
This command configures the CoS priority across all tests configured under this session. This CoS value is exposed to the various QoS policies the frame passes through and does not necessarily map directly to the CoS value on the wire.
The no form of this command restores the default value.
Default
0
Parameters
- priority
Specifies the CoS priority value.
slm
Syntax
slm [test-id test-id] [create]
no slm
Context
config>oam-pm>session>ethernet
Platforms
Supported on all 7210 SAS platforms as described in this document, including platforms configured in the access-uplink operating mode
Description
This command configures the test ID to be assigned to the synthetic loss test, and creates the container to allow the individual test parameters to be configured.
The no form of this command removes the SLM test function from the PM session.
Parameters
- test-id
Specifies the value to be placed in the 4-byte test ID field of the ETH-SLM PDU.
- create
Creates the test.
flr-threshold
Syntax
flr-threshold percentage
no flr-threshold
Context
config>oam-pm>session>ethernet>slm
config>oam-pm>session>ip>twamp-light>loss-events
Platforms
Supported on all 7210 SAS platforms as described in this document, including platforms configured in the access-uplink operating mode
Description
This command configures the frame loss threshold that is used to determine whether the delta-t is available or unavailable. An individual delta-t with a frame loss threshold equal to or higher than the configured threshold is marked unavailable. An individual delta-t with a frame loss threshold lower than the configured threshold is marked as available.
The no form of this command reverts to the default value.
Default
flr-threshold 50
Parameters
- percentage
Specifies the percentage of the threshold.
loss-events
Syntax
loss-events
Context
config>oam-pm>session>ethernet>slm
config>oam-pm>session>ip>twamp-light
Platforms
Supported on all 7210 SAS platforms as described in this document, including platforms configured in the access-uplink operating mode
Description
This context enables the context to define the loss events and thresholds that are to be tracked.
avg-flr-event
Syntax
avg-flr-event {forward | backward} threshold raise-threshold-percent [clear clear-threshold-percent]
[no] avg-flr-event {forward | backward}
Context
config>oam-pm>session>ethernet>slm>loss-events
config>oam-pm>session>ip>twamp-light>loss-events
Platforms
Supported on all 7210 SAS platforms as described in this document, including platforms configured in the access-uplink operating mode
Description
This command sets the frame loss ratio threshold configuration that is applied and checked at the end of the measurement interval for the specified direction. This is a percentage based on average frame loss ratio over the entire measurement interval. If [clear clear-threshold-percent] is not specified, the traffic crossing alarm is stateless. Stateless means the state is not carried forward to other measurement intervals. Each measurement interval is analyzed independently and without regard to any previous window. Each unique event can only be raised once within measurement interval. If the optional clear threshold is specified, the traffic crossing alarm uses stateful behavior. Stateful means each unique previous event state is carried forward to following measurement intervals. If a threshold crossing event is raised, another is not raised until a measurement interval completes and the clear threshold has not been exceeded. A clear event is raised under that condition.
The no version of this command removes the event threshold for frame loss ratio. The direction must be included with the no command.
Default
no avg-flr-event forward
no avg-flr-event backward
Parameters
- forward
Specifies that the threshold is applied to the forward direction value.
- backward
Specifies that the threshold is applied to the backward direction value.
- threshold raise-threshold-percent
Specifies the rising percentage that determines when the event is to be generated.
- clear clear-threshold-percent
Specifies an optional value used for stateful behavior that allows the operator to configure a percentage of loss value lower than the rising percentage to indicate when the clear event should be generated.
chli-event
Syntax
chli-event {forward | backward | aggregate} threshold raise-threshold [clear clear-threshold]
[no] chli-event {forward | backward | aggregate}
Context
config>oam-pm>session>ethernet>slm>loss-events
config>oam-pm>session>ip>twamp-light>loss-events
Platforms
Supported on all 7210 SAS platforms as described in this document, including platforms configured in the access-uplink operating mode
Description
This command sets the consecutive high loss interval (CHLI) threshold to be monitored and the associated thresholds using the counter of the specified direction. The aggregate is a function of summing forward and backward. This value is only used as a threshold mechanism and is not part of the stored statistics. If [clear clear-threshold] is not specified, the traffic crossing alarm is stateless. Stateless means the state is not carried forward to other measurement intervals. Each measurement interval is analyzed independently and without regard to any previous window. Each unique event can only be raised once within measurement interval. If the optional clear threshold is specified, the traffic crossing alarm uses stateful behavior. Stateful means each unique previous event state is carried forward to following measurement intervals. If a threshold crossing event is raised, another is not raised until a measurement interval completes and the clear threshold has not been exceeded. A clear event is raised under that condition.
The no version of this command removes the event threshold for frame loss ratio. The direction must be included with the no command.
Default
no chli-event forward
no chli-event backward
no chli-event aggregate
Parameters
- forward
Specifies that the threshold is applied to the forward direction count.
- backward
Specifies that the threshold is applied to the backward direction count.
- aggregate
Specifies that the threshold is applied to the aggregate count (sum of forward and backward).
- threshold raise-threshold
Specifies a numerical value compared to the CHLI counter that is the rising threshold that determines when the event is to be generated, when the percentage of loss value is reached.
- clear clear-threshold
Specifies an optional numerical value compared to the CHLI counter used for stateful behavior that allows the operator to configure a value lower than the rising percentage to indicate when the clear event should be generated.
hli-event
Syntax
hli-event {forward | backward | aggregate} threshold raise-threshold [clear clear-threshold]
[no] hli-event {forward | backward | aggregate}
Context
config>oam-pm>session>ethernet>slm>loss-events
config>oam-pm>session>ip>twamp-light>loss-events
Platforms
Supported on all 7210 SAS platforms as described in this document, including platforms configured in the access-uplink operating mode
Description
This command sets the high loss interval (HLI) threshold to be monitored and the associated thresholds using the counter of the specified direction. The aggregate is a function of summing forward and backward. This value is only used as a threshold mechanism and is not part of the stored statistics. If the [clear clear-threshold] is not specified, the traffic crossing alarm is stateless. Stateless means the state is not carried forward to other measurement intervals. Each measurement interval is analyzed independently and without regard to any previous window. Each unique event can only be raised once within measurement interval. If the optional clear threshold is specified, the traffic crossing alarm uses stateful behavior. Stateful means each unique previous event state is carried forward to following measurement intervals. If a threshold crossing event is raised, another is not raised until a measurement interval completes and the clear threshold has not been exceeded. A clear event is raised under that condition.
The no version of this command removes the event threshold for frame loss ratio. The direction must be included with the no command.
Default
no hli-event backward
no hli-event aggregate
Parameters
- forward
Specifies that the threshold is applied to the forward direction count.
- backward
Specifies that the threshold is applied to the backward direction count.
- aggregate
Specifies that the threshold is applied to the aggregate count (sum of forward and backward).
- threshold raise-threshold
Specifies the rising threshold that determines when the event is to be generated, when the percentage of loss value is reached.
- clear clear-threshold
Specifies an optional value used for stateful behavior that allows the operator to configure a percentage of loss value lower than the rising percentage to indicate when the clear event should be generated.
unavailability-event
Syntax
unavailability-event {forward | backward | aggregate} threshold raise-threshold [clear clear-threshold]
[no] unavailability-event {forward | backward | aggregate}
Context
config>oam-pm>session>ethernet>slm>loss-events
config>oam-pm>session>ip>twamp-light>loss-events
Platforms
Supported on all 7210 SAS platforms as described in this document, including platforms configured in the access-uplink operating mode
Description
This command sets the threshold to be applied to the overall count of the unavailability indicators, not transitions, per configured direction. This value is compared to the 32 bit unavailability counter specific to the direction which tracks the number of individual delta-ts that have been recorded as unavailable. The aggregate is a function of summing forward and backward. This value is only used as a threshold mechanism and is not part of the stored statistics. If the [clear clear-threshold] is not specified, the traffic crossing alarm is stateless. Stateless means the state is not carried forward to other measurement intervals. Each measurement interval is analyzed independently and without regard to any previous window. Each unique event can only be raised once within measurement interval. If the optional clear threshold is specified, the traffic crossing alarm uses stateful behavior. Stateful means each unique previous event state is carried forward to following measurement intervals. If a threshold crossing event is raised, another is not raised until a measurement interval completes and the clear threshold has not been exceeded. A clear event is raised under that condition.
The no version of this command removes the event threshold for frame loss ratio. The direction must be included with the no command.
Default
no unavailable-event forward
no unavailable-event backward
no unavailable-event aggregate
Parameters
- forward
Specifies that the threshold is applied to the forward direction count.
- backward
Specifies that the threshold is applied to the backward direction count.
- aggregate
Specifies that the threshold is applied to the aggregate count (sum of forward and backward).
- threshold
Specifies a numerical value compared to the unavailability counter that is the rising threshold that determines when the event is to be generated, when value reached
- clear clear-threshold
an optional value used for stateful behavior that allows the operator to configure a percentage of loss value lower than the rising percentage to indicate when the clear event should be generated
undet-availability-event
Syntax
undet-availability-event {forward | backward | aggregate} threshold raise-threshold [clear clear-threshold]
[no] undet-availability-event {forward | backward | aggregate}
Context
config>oam-pm>session>ethernet>slm>loss-events
config>oam-pm>session>ip>twamp-light>loss-events
Platforms
Supported on all 7210 SAS platforms as described in this document, including platforms configured in the access-uplink operating mode
Description
This command sets the threshold to be applied to the overall count of the undetermined availability indicators, not transitions, per configured direction. This value is compared to the 32 bit unavailability counter specific to the direction which tracks the number of individual delta-ts that have been recorded as undetermined available. The aggregate is a function of summing forward and backward. This value is only used as a threshold mechanism and is not part of the stored statistics. If the [clear clear-threshold] is not specified, the traffic crossing alarm is stateless. Stateless means the state is not carried forward to other measurement intervals. Each measurement interval is analyzed independently and without regard to any previous window. Each unique event can only be raised once within measurement interval. If the optional clear threshold is specified, the traffic crossing alarm uses stateful behavior. Stateful means each unique previous event state is carried forward to following measurement intervals. If a threshold crossing event is raised, another is not raised until a measurement interval completes and the clear threshold has not been exceeded. A clear event is raised under that condition.
The no version of this command removes the event threshold for frame loss ratio. The direction must be included with the no command.
Default
no undetermined-available-event forward
no undetermined-available-event backward
no undetermined-available-event aggregate
Parameters
- forward
Specifies that the threshold is applied to the forward direction count.
- backward
Specifies that the threshold is applied to the backward direction count.
- aggregate
Specifies that the threshold is applied to the aggregate count (sum of forward and backward).
- threshold raise-threshold
Specifies the rising threshold that determines when the event is to be generated, when value reached.
- clear clear-threshold
Specifies an optional value used for stateful behavior that allows the operator to configure a percentage of loss value lower than the rising percentage to indicate when the clear event should be generated
undet-unavailability-event
Syntax
undet-availability-event {forward | backward | aggregate} threshold raise-threshold [clear clear-threshold]
[no] undet-availability-event {forward | backward | aggregate}
Context
config>oam-pm>session>ethernet>slm>loss-events
config>oam-pm>session>ip>twamp-light>loss-events
Platforms
Supported on all 7210 SAS platforms as described in this document, including platforms configured in the access-uplink operating mode
Description
This command sets the threshold to be applied to the overall count of the undetermined unavailability indicators, not transitions, per configured direction. This value is compared to the 32 bit unavailability counter specific to the direction which tracks the number of individual delta-ts that have been recorded as undetermined unavailable. The aggregate is a function of summing forward and backward. This value is only used as a threshold mechanism and is not part of the stored statistics. If the [clear clear-threshold] is not specified, the traffic crossing alarm is stateless. Stateless means the state is not carried forward to other measurement intervals. Each measurement interval is analyzed independently and without regard to any previous window. Each unique event can only be raised once within measurement interval. If the optional clear threshold is specified, the traffic crossing alarm uses stateful behavior. Stateful means each unique previous event state is carried forward to following measurement intervals. If a threshold crossing event is raised, another is not raised until a measurement interval completes and the clear threshold has not been exceeded. A clear event is raised under that condition.
The no version of this command removes the event threshold for frame loss ratio. The direction must be included with the no command.
Default
no undet-unavailable-event forward
no undet-unavailable-event backward
no undet-unavailable-event aggregate
Parameters
- forward
Specifies that the threshold is applied to the forward direction count.
- backward
Specifies that the threshold is applied to the backward direction count.
- aggregate
Specifies that the threshold is applied to the aggregate count (sum of forward and backward).
- threshold raise-threshold
Specifies the rising threshold that determines when the event is to be generated, when value reached.
- clear clear-threshold
Specifies an optional value used for stateful behavior that allows the operator to configure a percentage of loss value lower than the rising percentage to indicate when the clear event should be generated.
timing
Syntax
timing frames-per-delta-t frames consec-delta-t deltas interval milliseconds chli-threshold threshold
no timing
Context
config>oam-pm>session>ethernet>slm
Platforms
Supported on all 7210 SAS platforms as described in this document, including platforms configured in the access-uplink operating mode
Description
This command configures various availability parameters and the probe spacing (interval) for the SLM frames. The maximum size of the availability window must not exceed 10 s (10000 ms).
The no form of this command installs the default values for all timing parameters and uses those values to compute availability and set the SLM frequency. If an SLM test is active, it always has timing parameters, whether default or operator-configured.
Default
timing frames-per-delta-t 10 consec-delta-t 10 interval 100 chli-threshold 5
Parameters
- frames
Specifies the number of frames that define the size of the delta-t. Each delta-t is marked as available or unavailable based on the flr-threshold. The size of the delta-t measurement is the product of the number of frames and the interval.
- deltas
Specifies the number of consecutive delta-ts that make up the sliding window over which availability and unavailability is determined. Transitions from one state to another occur when the consecutive delta-ts are in a new state.
- milliseconds
Specifies the number of milliseconds between the transmission of the SLM frames. The default value for the SLM interval is intentionally different from the default interval for DMM.
- threshold
Specifies the number of consecutive unavailable delta-ts that cause the CHLI counter to be incremented. A CHLI counter is an indication that the sliding window is available but has crossed a threshold of consecutive unavailable delta-t intervals. A CHLI can only be incremented once during a sliding window and is only incremented during times of availability.
source
Syntax
source mep mep-id domain md-index association ma-index
no source
Context
config>oam-pm>session>ethernet
Platforms
Supported on all 7210 SAS platforms as described in this document, including platforms configured in the access-uplink operating mode
Description
This command configures the source launch point for Y.1731 parameters that are used by the individual tests within the session. If an MEP matching the configuration does not exist, the session is allowed to become active; however, the frames sent and received as seen under the show>oam-pm>statistics>session session-name command are zero.
The no form of this command removes this session parameter.
Parameters
- mep-id
Specifies the maintenance association end point identifier of the launch point.
- md-index
Specifies the maintenance domain (MD) index value of the launch point.
- ma-index
Specifies the maintenance association (MA) index value of the launch point.
meas-interval
Syntax
meas-interval {5-mins | 15-mins | 1-hour | 1-day} [create]
no meas-interval
Context
config>oam-pm>session
Platforms
Supported on all 7210 SAS platforms as described in this document, including platforms configured in the access-uplink operating mode
Description
This command establishes the parameters of the individual measurement intervals used by the session. A maximum of three different measurement intervals may be configured under each session.
The no form of this command deletes the specified measurement interval.
Parameters
- 5-mins
Specifies a 5 minute measurement interval duration.
- 15-mins
Specifies a 15 minute measurement interval duration.
- 1-hour
Specifies a 1 hour measurement interval duration.
- 1-day
Specifies a 1 day measurement interval duration.
- create
Creates the measurement interval.
accounting-policy
Syntax
accounting-policy acct-policy-id
no accounting-policy
Context
config>oam-pm>session>meas-interval
Platforms
Supported on all 7210 SAS platforms as described in this document, including platforms configured in the access-uplink operating mode
Description
This command assigns a record-type of complete-pm to the specified accounting policy (configured using the config>log>accounting-policy command). This runs the data collection process for completed measurement intervals in memory, file storage, and maintenance functions, moving data from memory to flash. A single accounting policy can be applied to a measurement interval.
The no form of this command removes the accounting policy.
Parameters
- acct-policy-id
Specifies the accounting policy to be applied to the measurement interval.
boundary-type
Syntax
boundary-type {clock-aligned | test-relative}
no boundary-type
Context
config>oam-pm>session>meas-interval
Platforms
Supported on all 7210 SAS platforms as described in this document, including platforms configured in the access-uplink operating mode
Description
This command establishes the alignment of the start of the measurement interval with either the time of day clock or the start of the test.
Test-relative start times launch the measurement interval when the individual test enters the active no shutdown state.
Alignment with the time of day clock always defaults to the representative top of the hour. Clocks aligned at 15-minute measurement intervals divide the hour into four equal sections at 00, 15, 30, and 45. Clocks aligned at 1-hour measurement intervals start at 00. Clocks aligned at 1-day measurement intervals start at midnight. It is typical for the first measurement interval of a clock-aligned test to have the suspect flag set to yes because it is unlikely that the no shutdown command exactly corresponds to the clock-based measurement interval start time. Clock-aligned measurement intervals can include an additional offset. See the clock-offset command option under this context.
The no form of this command restores the default value.
Default
boundary-type clock-aligned
Parameters
- clock-aligned
Aligns the start of the measurement interval with the time of day clock.
- test-relative
Aligns the start of the measurement interval with the start of the test.
clock-offset
Syntax
clock-offset seconds
no clock-offset
Context
config>oam-pm>session>meas-interval
Platforms
Supported on all 7210 SAS platforms as described in this document, including platforms configured in the access-uplink operating mode
Description
This command configures an offset between measurement intervals with a boundary-type of clock-aligned and the default time of day clock. The configured offset must be smaller than the size of the measurement interval. As an example, an offset of 300 seconds shifts the start times of the measurement intervals by 5 minutes from their default alignments with respect to the time of day clock.
The no form of this command restores the default value.
Default
clock-offset 0
Parameters
- seconds
Specifies the number of seconds to offset a clock-alignment measurement interval from its default.
event-mon
Syntax
event-mon
Context
config>oam-pm>session>measurement-interval
Platforms
Supported on all 7210 SAS platforms as described in this document, including platforms configured in the access-uplink operating mode
Description
This command enables different threshold events on a specific measurement interval. Only one measurement interval with a configured OAM PM session can have events enabled using the no shutdown command.
delay-events
Syntax
[no] delay-events
Context
config>oam-pm>session>measurement-interval>event-mon
Platforms
Supported on all 7210 SAS platforms as described in this document, including platforms configured in the access-uplink operating mode
Description
This enables the monitoring of all configured delay events.
Configuring this command starts the monitoring of the configured delay events at the start of the next measurement interval. If the command is disabled using the no command, all monitoring of configured delay events, logging, and recording of new events for that session are suspended. Any existing events at the time of the shut down are maintained until the active measurement window in which the removal was performed has completed. The state of this monitoring function can be changed without needing to shut down all the tests in the session.
The no form of this command disables the monitoring of all configured delay events.
loss-events
Syntax
[no] loss-events
Context
config>oam-pm>session>measurement-interval>event-mon
Platforms
Supported on all 7210 SAS platforms as described in this document, including platforms configured in the access-uplink operating mode
Description
This enables the monitoring of all configured loss events.
Configuring this command starts the monitoring of the configured loss events at the start of the next measurement interval. If the command is disabled using the no command, all monitoring of configured loss events, logging, and recording of new events for that session are suspended. Any existing events at the time of the shut down are maintained until the active measurement window in which the removal was performed has completed. The state of this monitoring function can be changed without needing to shut down all the tests in the session.
The no form of this command disables the monitoring of all configured loss events.
intervals-stored
Syntax
intervals-stored intervals
no intervals-stored
Context
config>oam-pm>session>meas-interval
Platforms
Supported on all 7210 SAS platforms as described in this document, including platforms configured in the access-uplink operating mode
Description
This command configures the number of completed measurement intervals per session to be stored in volatile system memory. The entire block of memory is allocated for the measurement interval when the test is active (no shutdown) to ensure that memory is available. The numbers increase from 1 to the configured value + 1. The active PM data is stored in interval number 1, and older runs are stored, in order, to the upper most number, with the oldest run being deleted when the number of completed measurement intervals exceeds the configured value + 1. As new test measurement intervals complete for the session, the stored intervals are renumbered to maintain the described order. Care must be taken when setting this value. There must be a balance between completed runs stored in volatile memory and the use of the write-to-flash function of the accounting policy.
The 5-mins and 15-mins measurement intervals share the same (1 to 96) retention pool. In the unlikely event that both intervals are required, the total of both cannot exceed 96. The 1-hour and 1-day measurement intervals use their own ranges. If this command is omitted when configuring the measurement interval, the default values are used.
Parameters
- intervals
Specifies the number of stored intervals.
Service Assurance Agent (SAA) commands
saa
Syntax
saa
Context
config
Platforms
Supported on all 7210 SAS platforms as described in this document.
Description
Commands in this context configure the Service Assurance Agent (SAA) tests.
test
Syntax
test name [owner test-owner]
no test name
Context
config>saa
Platforms
Supported on all 7210 SAS platforms as described in this document, including platforms configured in the access-uplink operating mode
Description
This command provides the test parameters for the named test. Subsequent to the creation of the test instance the test can be started in the OAM context.
A test can only be modified while it is shut down.
The no form of this command removes the test from the configuration. To remove a test it cannot be active at the time.
Parameters
- name
Specifies the SAA test name to be created or edited.
- owner test-owner
Specifies the owner of an SAA operation up to 32 characters.
accounting-policy
Syntax
accounting-policy acct-policy-id
no accounting-policy
Context
config>saa>test
Platforms
Supported on all 7210 SAS platforms as described in this document, including platforms configured in the access-uplink operating mode
Description
This command associates an accounting policy to the SAA test. The accounting policy must already be defined before it can be associated else an error message is generated.
When a test terminates, a notification trap is issued.
The no form of this command removes the accounting policy association.
Parameters
- acct-policy-id
Specifies the accounting policy-id as configured in the config>log>accounting-policy context.
continuous
Syntax
[no] continuous
Context
config>saa>test
Platforms
Supported on all 7210 SAS platforms as described in this document, including platforms configured in the access-uplink operating mode
Description
This command specifies whether the SAA test is continuous. When the test is configured as continuous, it cannot be started or stopped by using the saa command.
The no form of this command disables the continuous running of the test. Use the shutdown command to disable the test.
description
Syntax
description description-string
no description
Context
config>saa>test
Platforms
Supported on all 7210 SAS platforms as described in this document, including platforms configured in the access-uplink operating mode
Description
This command creates a text description stored in the configuration file for a configuration context.
The description command associates a text string with a configuration context to help identify the content in the configuration file.
The no form of this command removes the string from the configuration.
Parameters
- string
Specifies the description character string. Allowed values are any string up to 80 characters composed of printable, 7-bit ASCII characters. If the string contains special characters (#, $, spaces, and so on), the entire string must be enclosed within double quotes.
jitter-event
Syntax
jitter-event rising-threshold threshold [falling-threshold threshold] [direction]
no jitter-event
Context
config>saa>test
Platforms
Supported on all 7210 SAS platforms as described in this document, including platforms configured in the access-uplink operating mode
Description
This command specifies that at the termination of an SAA test probe, the calculated jitter value is evaluated against the configured rising and falling jitter thresholds. SAA threshold events are generated as required.
When the threshold (rising/falling) is crossed, it is disabled from generating additional events until the opposite threshold is crossed. If a falling-threshold is not supplied, the rising threshold is re-enabled when it falls below the threshold after the initial crossing that generate the event.
The configuration of jitter event thresholds is optional.
Parameters
- rising-threshold threshold
Specifies a rising threshold jitter value in milliseconds. When the test run is completed, the calculated jitter value is compared to the configured jitter rising threshold. If the test run jitter value is greater than the configured rising threshold value, an SAA threshold event is generated. The SAA threshold event is tmnxOamSaaThreshold, logger application OAM, event #2101.
- falling-threshold threshold
Specifies a falling threshold jitter value in milliseconds. When the test run is completed, the calculated jitter value is compared to the configured jitter falling threshold. If the test run jitter value is greater than the configured falling threshold value, an SAA threshold event is generated. The SAA threshold event is tmnxOamSaaThreshold, logger application OAM, event #2101.
- direction
Specifies the direction for OAM ping responses received for an OAM ping test run.
latency-event
Syntax
latency-event rising-threshold threshold [falling-threshold threshold] [direction]
no latency-event
Context
config>saa>test
Platforms
Supported on all 7210 SAS platforms as described in this document, including platforms configured in the access-uplink operating mode
Description
This command specifies that at the termination of an SAA test probe, the calculated latency event value is evaluated against the configured rising and falling latency event thresholds. SAA threshold events are generated as required.
When the threshold (rising/falling) is crossed, it is disabled from generating additional events until the opposite threshold is crossed. If a falling-threshold is not supplied, the rising threshold is re-enabled when it falls below the threshold after the initial crossing that generate the event.
The configuration of latency event thresholds is optional.
Parameters
- rising-threshold threshold
Specifies a rising threshold latency value in milliseconds. When the test run is completed, the calculated latency value is compared to the configured latency rising threshold. If the test run latency value is greater than the configured rising threshold value, an SAA threshold event is generated. The SAA threshold event is tmnxOamSaaThreshold, logger application OAM, event #2101.
- falling-threshold threshold
Specifies a falling threshold latency value in milliseconds. When the test run is completed, the calculated latency value is compared to the configured latency falling threshold. If the test run latency value is greater than the configured falling threshold value, an SAA threshold event is generated. The SAA threshold event is tmnxOamSaaThreshold, logger application OAM, event #2101.
- direction
Specifies the direction for OAM ping responses received for an OAM ping test run.
loss-event
Syntax
loss-event rising-threshold threshold [falling-threshold threshold] [direction]
no loss-event
Context
config>saa>test
Platforms
Supported on all 7210 SAS platforms as described in this document, including platforms configured in the access-uplink operating mode
Description
This command specifies that at the termination of an SAA testrun, the calculated loss event value is evaluated against the configured rising and falling loss event thresholds. SAA threshold events are generated as required.
The configuration of loss event thresholds is optional.
Parameters
- rising-threshold threshold
Specifies a rising threshold loss event value in packets. When the test run is completed, the calculated loss event value is compared to the configured loss event rising threshold. If the test run loss event value is greater than the configured rising threshold value, an SAA threshold event is generated. The SAA threshold event is tmnxOamSaaThreshold, logger application OAM, event #2101.
- falling-threshold threshold
Specifies a falling threshold loss event value in packets. When the test run is completed, the calculated loss event value is compared to the configured loss event falling threshold. If the test run loss event value is greater than the configured falling threshold value, an SAA threshold event is generated. The SAA threshold event is tmnxOamSaaThreshold, logger application OAM, event #2101.
- direction
Specifies the direction for OAM ping responses received for an OAM ping test run.
probe-history
Syntax
probe-history [auto | drop | keep]
Context
config>saa>test
Platforms
Supported on all 7210 SAS platforms as described in this document, including platforms configured in the access-uplink operating mode
Description
This command defines history probe behavior. Defaults are associated with various configured parameters within the SAA test. Auto (keep) is used for test with probe counts of 100 or less, and intervals of 1 second and above. Auto (drop) only maintains summary information for tests marked as continuous with file functions, probe counts in excess of 100 and intervals of less than 1 second. SAA tests that are not continuous with a write to file defaults to Auto (keep). The operator is free to change the default behaviors for each type. Each test that maintains per probe history consumes more system memory. When per probe entries are required, the probe history is available at the completion of the test.
Default
auto
Parameters
- auto
Specifies an auto selector that determines the storage of the history information.
- drop
Specifies to store summarized min/max/ave data; not per probe information for test runs. This may be configured for all tests in an effort to conserve memory.
- keep
Specifies to store per probe information for tests. This consumes significantly more memory than summary information and should only be used if necessary.
trap-gen
Syntax
trap-gen
Context
config>saa>test
Platforms
Supported on all 7210 SAS platforms as described in this document, including platforms configured in the access-uplink operating mode
Description
Commands in this context configure trap generation for the SAA test.
probe-fail-enable
Syntax
[no] probe-fail-enable
Context
config>saa>test>trap-gen
Platforms
Supported on all 7210 SAS platforms as described in this document, including platforms configured in the access-uplink operating mode
Description
This command enables the generation of an SNMP trap when probe-fail-threshold consecutive probes fail during the execution of the SAA ping test. This command is not applicable to SAA trace route tests.
The no form of this command disables the generation of an SNMP trap.
probe-fail-threshold
Syntax
[no] probe-fail-threshold threshold
Context
config>saa>test>trap-gen
Platforms
Supported on all 7210 SAS platforms as described in this document, including platforms configured in the access-uplink operating mode
Description
This command enables the generation of an SNMP trap when the probe-fail-threshold consecutive probes fail during the execution of the SAA ping test. This command is not applicable to SAA trace route tests. This command has no effect when probe-fail-enable is disabled.
The no form of this command returns the threshold value to the default.
Default
1
test-completion-enable
Syntax
[no] test-completion-enable
Context
config>saa>test>trap-gen
Platforms
Supported on all 7210 SAS platforms as described in this document, including platforms configured in the access-uplink operating mode
Description
This command enables the generation of a trap when an SAA test completes.
The no form of this command disables the trap generation.
test-fail-enable
Syntax
[no] test-fail-enable
Context
config>saa>test>trap-gen
Platforms
Supported on all 7210 SAS platforms as described in this document, including platforms configured in the access-uplink operating mode
Description
This command enables the generation of a trap when a test fails. In the case of a ping test, the test is considered failed (for the purpose of trap generation) if the number of failed probes is at least the value of the test-fail-threshold parameter.
The no form of this command disables the trap generation.
test-fail-threshold
Syntax
[no] test-fail-threshold threshold
Context
config>saa>test>trap-gen
Platforms
Supported on all 7210 SAS platforms as described in this document, including platforms configured in the access-uplink operating mode
Description
This command configures the threshold for trap generation on test failure.
This command has no effect when test-fail-enable is disabled. This command is not applicable to SAA trace route tests.
The no form of this command returns the threshold value to the default.
Default
1
type
Syntax
type
no type
Context
config>saa>test
Platforms
Supported on all 7210 SAS platforms as described in this document, including platforms configured in the access-uplink operating mode
Description
This command provides the test type for the named test. Only a single test type can be configured.
A test can only be modified while the test is in shutdown mode
When a test type has been configured, the command can be modified by re-entering the command, and the test type must be the same as the previously entered test type.
To change the test type, the old command must be removed using the config>saa>test>no type command.
cpe-ping
Syntax
cpe-ping service service-id destination ip-address source ip-address [ttl vc-label-ttl] [return-control] [source-mac ieee-address] [fc fc-name] [interval interval] [send-count send-count] [send-control]
Context
oam
config>saa>test>type
Platforms
Supported on all 7210 SAS platforms as described in this document, except those operating in access-uplink mode
Description
This command determines the IP connectivity to a CPE within a specified VPLS service.
Parameters
- service service-id
Specifies the service ID of the service to diagnose or manage.
- destination ip-address
Specifies the IP address to be used as the destination for performing an OAM ping operations.
- source ip-address
Specifies an unused IP address in the same network that is associated with the VPLS.
- ttl vc-label-ttl
Specifies the TTL value in the VC label for the OAM MAC request, expressed as a decimal integer.
- return-control
Specifies the MAC OAM reply to a data plane MAC OAM request be sent using the control plane instead of the data plane.
- source-mac ieee-address
Specifies the source MAC address that is sent to the CPE. If not specified or set to 0, the MAC address configured for the CPMCFM is used.
- fc-name
Specifies the forwarding class of the MPLS echo request encapsulation.
- interval interval
Specifies the interval parameter, in seconds, expressed as a decimal integer. This parameter is used to override the default request message send interval and defines the minimum amount of time that must expire before the next message request is sent.
If the interval is set to 1 second where the timeout value is set to 10 seconds, the maximum time between message requests is 10 seconds and the minimum is 1 second. This depends upon the receipt of a message reply corresponding to the outstanding message request.
- send-count send-count
Specifies the number of messages to send, expressed as a decimal integer. The count parameter is used to override the default number of message requests sent. Each message request must either timeout or receive a reply before the next message request is sent. The message interval value must be expired before the next message request is sent.
- send-control
Specifies the MAC OAM request to be sent using the control plane instead of the data plane.
dns
Syntax
dns target-addr dns-name name-server ip-address [source ip-address] [send-count send-count] [timeout timeout] [interval interval] [record-type {ipv4-a-record | ipv6-aaaa-record}]
Context
config>saa>test>type
Platforms
Supported on all 7210 SAS platforms as described in this document, including platforms configured in the access-uplink operating mode
Description
This command configures a DNS name resolution test.
Parameters
- target-addr
Specifies the IP host address to be used as the destination for performing an OAM ping operation.
- dns-name
Specifies the DNS name to be resolved to an IP address.
- name-server ip-address
Specifies the server connected to a network that resolves network names into network addresses.
- source ip-address
Specifies the IP address to be used as the source for performing an OAM ping operation.
- send-count send-count
Specifies the number of messages to send, expressed as a decimal integer. The send-count parameter is used to override the default number of message requests sent. Each message request must either timeout or receive a reply before the next message request is sent. The message interval value must be expired before the next message request is sent.
- timeout timeout
Specifies the timeout parameter in seconds, expressed as a decimal integer. This value is used to override the default timeout value and is the amount of time that the router waits for a message reply after sending the message request. Upon the expiration of message timeout, the requesting router assumes that the message response has not been received. Any response received after the request times out is silently discarded.
- interval interval
Specifies the interval parameter in seconds, expressed as a decimal integer. This parameter is used to override the default request message send interval and defines the minimum amount of time that must expire before the next message request is sent.
If the interval is set to 1 second, and the timeout value is set to 10 seconds, the maximum time between message requests is 10 seconds and the minimum is 1 second. This depends upon the receipt of a message reply corresponding to the outstanding message request.
- record-type
Specifies a record type.
eth-cfm-linktrace
Syntax
eth-cfm-linktrace mac-address mep mep-id domain md-index association ma-index [ttl ttlvalue]
[fc {fc-name} ] [send-count send-count] [timeout timeout] [interval interval] [record-type {ipv4-a-record|ipv6-aaaa-record}]
Context
config>saa>test>type
Platforms
Supported on all 7210 SAS platforms as described in this document, including platforms configured in the access-uplink operating mode
Description
This command configures a CFM linktrace test in SAA.
Parameters
- mac-address
Specifies a unicast destination MAC address.
- mep mep-id
Specifies the target MAC address.
- domain md-index
Specifies the MD index.
- association ma-index
Specifies the MA index.
- ttl ttl-value
Specifies the maximum number of hops traversed in the linktrace.
- fc fc-name
The fc parameter is used to indicate the forwarding class of the CFM Linktrace request messages.
The actual forwarding class encoding is controlled by the network egress mappings.
- send-count send-count
Specifies the number of messages to send, expressed as a decimal integer. The count parameter is used to override the default number of message requests sent. Each message request must either timeout or receive a reply before the next message request is sent. The message interval value must be expired before the next message request is sent.
- timeout timeout
Specifies the timeout parameter in seconds, expressed as a decimal integer. This value is used to override the default timeout value and is the amount of time that the router waits for a message reply after sending the message request. Upon the expiration of message timeout, the requesting router assumes that the message response has not been received. Any response received after the request times out is silently discarded. The timeout value must be less than the interval.
- interval interval
Specifies the interval parameter in seconds, expressed as a decimal integer. This parameter is used to override the default request message send interval and defines the minimum amount of time that must expire before the next message request is sent.
If the interval is set to ‟1” second, and the timeout value is set to ‟10” seconds, the maximum time between message requests is ‟10” seconds and the minimum is ‟1” second. This depends upon the receipt of a message reply corresponding to the outstanding message request. The timeout value must be less than the interval.
- record-type
Specifies a record type.
eth-cfm-loopback
Syntax
eth-cfm-loopback mac-address mep mep-id domain md-index association ma-index [size datasize] [fc {fc-name} ] [count send-count ][timeout timeout] [interval interval]
Context
config>saa>test>type
Platforms
Supported on all 7210 SAS platforms as described in this document, including platforms configured in the access-uplink operating mode
Description
This command configures an Ethernet CFM loopback test in SAA.
Parameters
- mac-address
Specifies a unicast destination MAC address.
- mep mep-id
Specifies the target MAC address.
- domain md-index
Specifies the MD index.
- association ma-index
Specifies the MA index.
- size data-size
The packet size in bytes, expressed as a decimal integer.
- fc fc-name
Specifies the fc parameter used to indicate the forwarding class of the CFM Loopback request messages.
The actual forwarding class encoding is controlled by the network egress mappings.
- count send-count
Specifies the number of messages to send, expressed as a decimal integer. The count parameter is used to override the default number of message requests sent. Each message request must either timeout or receive a reply before the next message request is sent. The message interval value must be expired before the next message request is sent.
- timeout timeout
Specifies the timeout parameter in seconds, expressed as a decimal integer. This value is used to override the default timeout value and is the amount of time that the router waits for a message reply after sending the message request. Upon the expiration of message timeout, the requesting router assumes that the message response has not been received. Any response received after the request times out is silently discarded. The timeout value must be less than the interval.
- interval interval
Specifies the interval parameter in seconds, expressed as a decimal integer. This parameter is used to override the default request message send interval and defines the minimum amount of time that must expire before the next message request is sent.
If the interval is set to ‟1” second, and the timeout value is set to ‟10” seconds, the maximum time between message requests is ‟10” seconds and the minimum is ‟1” second. This depends upon the receipt of a message reply corresponding to the outstanding message request. The timeout value must be less than the interval.
eth-cfm-two-way-delay
Syntax
eth-cfm-two-way-delay mac-address mep mep-id domain md-index association ma-index [fc {fc-name} ] [send-count send-count] [timeout timeout] [interval interval]
Context
config>saa>test>type
Platforms
Supported on all 7210 SAS platforms as described in this document, including platforms configured in the access-uplink operating mode
Description
This command configures an Ethernet CFM two-way delay test in SAA.
Parameters
- mac-address
Specifies a unicast destination MAC address.
- mep mep-id
Specifies the target MAC address.
- domain md-index
Specifies the MD index.
- association ma-index
Specifies the MA index.
- ttl ttl-value
Specifies the maximum number of hops traversed in the linktrace.
- fc fc-name
Specifies the fc parameter used to indicate the forwarding class of the CFM two-delay request messages.
The actual forwarding class encoding is controlled by the network egress mappings.
- send-count send-count
Specifies the number of messages to send, expressed as a decimal integer. The count parameter is used to override the default number of message requests sent. Each message request must either timeout or receive a reply before the next message request is sent. The message interval value must be expired before the next message request is sent.
- timeout timeout
Specifies the timeout parameter in seconds, expressed as a decimal integer. This value is used to override the default timeout value and is the amount of time that the router waits for a message reply after sending the message request. Upon the expiration of message timeout, the requesting router assumes that the message response has not been received. Any response received after the request times out is silently discarded. The timeout value must be less than the interval.
- interval interval
-
Specifies the interval parameter in seconds, expressed as a decimal integer. This parameter is used to override the default request message send interval and defines the minimum amount of time that must expire before the next message request is sent.
If the interval is set to ‟1” second, and the timeout value is set to ‟10” seconds, the maximum time between message requests is ‟10” seconds and the minimum is ‟1” second. This depends upon the receipt of a message reply corresponding to the outstanding message request. The timeout value must be less than the interval.
eth-cfm-two-way-slm
Syntax
eth-cfm-two-way-delay mac-address mep mep-id domain md-index association ma-index [fc fc-name] [send-count send-count] [size data-size] [timeout timeout] [interval interval]
Context
config>saa>test>type
Platforms
Supported on all 7210 SAS platforms as described in this document, including platforms configured in the access-uplink operating mode
Description
This command configures an Ethernet CFM two-way SLM test in SAA.
Parameters
- mac-address
Specifies a unicast destination MAC address.
- mep mep-id
Specifies the target MAC address.
- domain md-index
Specifies the MD index.
- association ma-index
Specifies the MA index.
- fc fc-name
Specifies the fc parameter used to indicate the forwarding class of the CFM SLM request messages. The actual forwarding class encoding is controlled by the network egress mappings.
- send-count send-count
Specifies the number of messages to send, expressed as a decimal integer. The count parameter is used to override the default number of message requests sent. Each message request must either timeout or receive a reply before the next message request is sent. The message interval value must be expired before the next message request is sent.
- size data-size
Specifies the size of the data portion of the data TLV. If 0 is specified no data TLV is added to the packet.
- timeout timeout
Specifies the timeout parameter, in seconds, expressed as a decimal integer. This value is used to override the default timeout value and is the amount of time that the router waits for a message reply after sending the message request. Upon the expiration of message timeout, the requesting router assumes that the message response has not been received. Any response received after the request times out is silently discarded. The timeout value must be less than the interval.
- interval interval
Specifies the interval parameter, in seconds, expressed as a decimal integer. This parameter is used to override the default request message send interval and defines the minimum amount of time that must expire before the next message request is sent. If the interval is set to 1 second, and the timeout value is set to 10 seconds, the maximum time between message requests is 10 seconds and the minimum is 1 second. This depends upon the receipt of a message reply corresponding to the outstanding message request. The timeout value must be less than the interval.
icmp-ping
Syntax
icmp-ping [ip-address | dns-name] [rapid | detail] [ttl time-to-live] [tos type-of-service] [size bytes] [pattern pattern] [source ip-address | dns-name] [interval seconds] [{next-hop ip-address} | {interface interface-name} | bypass-routing] [count requests] [do-not-fragment] [router router-instance | service-name service-name] [timeout timeout]
Context
config>saa>test>type
Platforms
Supported on all 7210 SAS platforms as described in this document, including platforms configured in the access-uplink operating mode
Description
This command configures an ICMP ping test.
Parameters
- ip-address
Specifies the far-end IP address to which to send the svc-ping request message in dotted decimal notation.
- dns-name
Specifies the DNS name of the far-end device to which to send the svc-ping request message, expressed as a character string up to 63 characters maximum.
- rapid
Specifies that packets are generated as fast as possible instead of the default 1 per second.
- detail
Specifies the display of detailed information.
- ttl time-to-live
Specifies the TTL value for the IP packet, expressed as a decimal integer.
- tos type-of-service
Specifies the service type.
- size bytes
Specifies the request packet size in bytes, expressed as a decimal integer.
- pattern pattern
Specifies the date portion in a ping packet are filled with the pattern value specified. If not specified, position info is filled instead.
- source ip-address|dns-name
Specifies the IP address to be used.
- interval seconds
Overrides the default request message send interval and defines the minimum amount of time that must expire before the next message request is sent.
If the interval is set to 1 second, and the timeout value is set to 10 seconds, the maximum time between message requests is 10 seconds and the minimum is 1 second. This depends upon the receipt of a message reply corresponding to the outstanding message request.
- next-hop ip-address
Specifies the next hop IP address for which to only display static routes.
- interface interface-name
Specifies the name used to refer to the interface. The name must already exist in the config>router>interface context.
- bypass-routing
Specifies whether to send the ping request to a host on a directly attached network bypassing the routing table.
- count requests
Specifies the number of times to perform an OAM ping probe operation. Each OAM echo message request must either timeout or receive a reply before the next message request is sent.
- do-not-fragment
Sets the DF (Do Not Fragment) bit in the ICMP ping packet.
- router router-instance
Specifies the router name or service ID.
- service-name service-name
Specifies the service name as an integer.
- timeout timeout
Overrides the default timeout value and is the amount of time that the router waits for a message reply after sending the message request. Upon the expiration of message timeout, the requesting router assumes that the message response has not been received. Any response received after the request times out is silently discarded.
icmp-trace
Syntax
icmp-trace [ip-address | dns-name] [ttl time-to-live] [wait milli-seconds] [tos type-of-service] [source ip-address] [tos type-of-service] [router router-instance | service-name service-name]
Context
config>saa>test>type
Platforms
Supported on all 7210 SAS platforms as described in this document, including platforms configured in the access-uplink operating mode
Description
This command configures an ICMP traceroute test.
Parameters
- ip-address
Specifies the far-end IP address to which to send the svc-ping request message in dotted-decimal notation.
- dns-name
Specifies the DNS name of the far-end device to which to send the svc-ping request message, expressed as a character string to 63 characters maximum.
- ttl time-to-live
Specifies the TTL value for the MPLS label, expressed as a decimal integer.
- wait milliseconds
Specifies the time, in milliseconds, to wait for a response to a probe, expressed as a decimal integer.
- tos type-of-service
Specifies the service type.
- source ip-address
Specifies the IP address to be used.
- router router-instance
Specifies the router name or service ID.
mac-ping
Syntax
mac-ping service service-id destination dst-ieee-address [source src-ieee-address] [fc fc-name] [size octets] [ttl vc-label-ttl] [send-count send-count] [send-control] [return-control] [interval interval] [timeout timeout]
Context
oam
config>saa>test>type
Platforms
Supported on all 7210 SAS platforms as described in this document, except those operating in access-uplink mode
Description
This command determines the existence of an egress SAP binding of a specific MAC within a VPLS service.
A mac-ping packet can be sent via the control plane or the data plane. The send-control option specifies the request be sent using the control plane. If send-control is not specified, the request is sent using the data plane.
A mac-ping is forwarded along the flooding domain if no MAC address bindings exist. If MAC address bindings exist, the packet is forwarded along those paths, provided they are active. A response is generated only when there is an egress SAP binding for that MAC address or if the MAC address is a ‟local” OAM MAC address associated with the device’s control plan.
A mac-ping reply can be sent using the data plane or the control plane. The return-control option specifies the reply be sent using the control plane. If return-control is not specified, the request is sent using the data plane.
A mac-ping with data plane reply can only be initiated on nodes that can have an egress MAC address binding. A node without a FIB and without any SAPs cannot have an egress MAC address binding, so it is not a node where replies in the data plane are trapped and sent up to the control plane.
A control plane request is responded to via a control plane reply only.
By default, MAC OAM requests are sent with the system or chassis MAC address as the source MAC. The source option allows overriding of the default source MAC for the request with a specific MAC address.
When a source ieee-address value is specified and the source MAC address is locally registered within a split horizon group (SHG), this SHG membership is used as if the packet originated from this SHG. In all other cases, SHG 0 (zero) is used. Note that if the mac-trace is originated from a non-zero SHG, such packets do not go out to the same SHG.
If EMG is enabled, mac-ping returns only the first SAP in each chain.
Parameters
- service service-id
Specifies the service ID of the service to diagnose or manage.
- destination ieee-address
Specifies the destination MAC address for the OAM MAC request.
- size octets
Specifies the MAC OAM request packet size in octets, expressed as a decimal integer. The request payload is padded to the specified size with a 6 byte PAD header and a byte payload of 0xAA as necessary. If the octet size specified is less than the minimum packet, the minimum sized packet necessary to send the request is used.
- ttl vc-label-ttl
Specifies the TTL value in the VC label for the OAM MAC request, expressed as a decimal integer.
- send-control
Specifies the MAC OAM request be sent using the control plane instead of the data plane.
- return-control
Specifies the MAC OAM reply to a data plane MAC OAM request be sent using the control plane instead of the data plane.
- source src-ieee-address
Specifies the source MAC address from which the OAM MAC request originates. By default, the system MAC address for the chassis is used.
- fc fc-name
Specifies the fc parameter used to test the forwarding class of the MPLS echo request packets. The actual forwarding class encoding is controlled by the network egress LSP-EXP mappings.
- interval interval
Specifies the interval parameter, in seconds, expressed as a decimal integer. This parameter is used to override the default request message send interval and defines the minimum amount of time that must expire before the next message request is sent.
If the interval is set to 1 second where the timeout value is set to 10 seconds, the maximum time between message requests is 10 seconds and the minimum is 1 second. This depends upon the receipt of a message reply corresponding to the outstanding message request.
- send-count send-count
Specifies the number of messages to send, expressed as a decimal integer. The count parameter is used to override the default number of message requests sent. Each message request must either timeout or receive a reply before the next message request is sent. The message interval value must be expired before the next message request is sent.
- timeout timeout
Specifies the timeout parameter, in seconds, expressed as a decimal integer. This value is used to override the default timeout value and is the amount of time that the router waits for a message reply after sending the message request. Upon the expiration of message timeout, the requesting router assumes that the message response has not been received. Any response received after the request times out is silently discarded.
Output
Sample outputoam mac-ping service 1 destination 00:bb:bb:bb:bb:bb
Seq Node-id Path RTT
----------------------------------------------------------------------------
[Send request Seq. 1, Size 126]
1 2.2.2.2:sap1/1/1:1 In-Band 960ms
----------------------------------------------------------------------------
sdp-ping
Syntax
sdp-ping orig-sdp-id [resp-sdp resp-sdp-id] [fc fc-name [profile {in | out}]] [timeout seconds] [interval seconds] [size octets] [send-count send-count] [interval <interval>]
Context
oam
config>saa>test>type
Platforms
Supported on all 7210 SAS platforms as described in this document, except those operating in access-uplink mode
Description
This command tests SDPs for unidirectional or round trip connectivity and performs SDP MTU Path tests.
The sdp-ping command accepts an originating SDP-ID and an optional responding SDP-ID. The size, number of requests sent, message time-out and message send interval can be specified. All sdp-ping requests and replies are sent with PLP OAM-Label encapsulation, as a service-id is not specified.
For round trip connectivity testing, the resp-sdp keyword must be specified. If resp-sdp is not specified, a unidirectional SDP test is performed.
To terminate an sdp-ping in progress, use the CLI break sequence <Ctrl-C>.
An sdp-ping response message indicates the result of the sdp-ping message request. When multiple response messages apply to a single SDP echo request/reply sequence, the response message with the highest precedence is displayed. The following table displays the response messages sorted by precedence.
| Result of request | Displayed response message | Precedence |
|---|---|---|
Request timeout without reply |
Request Timeout |
1 |
Request not sent because of non-existent orig-sdp-id |
Orig-SDP Non-Existent |
2 |
Request not sent because of administratively down orig-sdp-id |
Orig-SDP Admin-Down |
3 |
Request not sent because of operationally down orig-sdp-id |
Orig-SDP Oper-Down |
4 |
Request terminated by user before reply or timeout |
Request Terminated |
5 |
Reply received, invalid origination-id |
Far End: Originator-ID Invalid |
6 |
Reply received, invalid responder-id |
Far End: Responder-ID Error |
7 |
Reply received, non-existent resp-sdp-id |
Far End: Resp-SDP Non-Existent |
8 |
Reply received, invalid resp-sdp-id |
Far End: Resp-SDP Invalid |
9 |
Reply received, resp-sdp-id down (admin or oper) |
Far-end: Resp-SDP Down |
10 |
Reply received, No Error |
Success |
11 |
Special Cases
- Single Response Connectivity Tests
A single response sdp-ping test provides detailed test results.
Upon request timeout, message response, request termination, or request error the following local and remote information is displayed. Local and remote information is dependent upon SDP-ID existence and reception of reply.
Table 21. SDP ping information Field Description Values Request Result
The result of the sdp-ping request message.
Sent - Request Timeout
Sent - Request Terminated
Sent - Reply Received
Not Sent - Non-Existent Local SDP-ID
Not Sent - Local SDP-ID Down
Originating SDP-ID
The originating SDP-ID specified by orig-sdp.
orig-sdp-id
Originating SDP-ID Administrative State
The local administrative state of the originating SDP-ID. If the SDP-ID has been shutdown, Admin-Down is displayed. If the originating SDP-ID is in the no shutdown state, Admin-Up is displayed. If the orig-sdp-id does not exist, Non-Existent is displayed.
Admin-Up
Admin-Down
Non-Existent
Originating SDP-ID Operating State
The local operational state of the originating SDP-ID. If orig-sdp-id does not exist, N/A is displayed.
Oper-Up
Oper-Down
N/A
Originating SDP-ID Path MTU
The local path-mtu for orig-sdp-id. If orig-sdp-id does not exist locally, N/A is displayed.
orig-path-mtu
N/A
Responding SDP-ID
The SDP-ID requested as the far-end path to respond to the sdp-ping request. If resp-sdp is not specified, the responding router does not use an SDP-ID as the return path and N/A is displayed.
resp-sdp-id
N/A
Responding SDP-ID Path Used
Displays whether the responding 7210 SAS used the responding sdp-id to respond to the sdp-ping request. If resp-sdp-id is a valid, operational SDP-ID, it must be used for the SDP echo reply message. If the far-end uses the responding sdp-id as the return path, Yes is displayed. If the far-end does not use the responding sdp-id as the return path, No is displayed. If resp-sdp is not specified, N/A is displayed.
Yes
No
N/A
Responding SDP-ID Administrative State
The administrative state of the responding sdp-id. When resp-sdp-id is administratively down, Admin-Down is displayed. When resp-sdp-id is administratively up, Admin-Up is displayed. When resp-sdp-id exists on the far-end 7210 SAS but is not valid for the originating router, Invalid is displayed. When resp-sdp-id does not exist on the far-end router, Non-Existent is displayed. When resp-sdp is not specified, N/A is displayed.
Admin-Down
Admin-Up
Invalid
Non-Existent
N/A
Responding SDP-ID Operational State
The operational state of the far-end sdp-id associated with the return path for service-id. When a return path is operationally down, Oper-Down is displayed. If the return sdp-id is operationally up, Oper-Up is displayed. If the responding sdp-id is non-existent, N/A is displayed.
Oper-Up
Oper-Down
N/A
Responding SDP-ID Path MTU
The remote path-mtu for resp-sdp-id. If resp-sdp-id does not exist remotely, N/A is displayed
resp-path-mtu
N/A
Local Service IP Address
The local system IP address used to terminate remotely configured sdp-ids (as the sdp-id far-end address). If an IP address has not been configured to be the system IP address, N/A is displayed.
system-ip-addr
N/A
Local Service IP Interface Name
The name of the local system IP interface. If the local system IP interface has not been created, N/A is displayed.
system-interface-name
N/A
Local Service IP Interface State
The state of the local system IP interface. If the local system IP interface has not been created, Non-Existent is displayed.
Up
Down
Non-Existent
Expected Far End Address
The expected IP address for the remote system IP interface. This must be the far-end address configured for the orig-sdp-id.
orig-sdp-far-end-addr
dest-ip-addr
N/A
Actual Far End Address
The returned remote IP address. If a response is not received, the displayed value is N/A. If the far-end service IP interface is down or non-existent, a message reply is not expected.
resp-ip-addr
N/A
Responders Expected Far End Address
The expected source of the originators sdp-id from the perspective of the remote terminating the sdp-id. If the far-end cannot detect the expected source of the ingress sdp-id, N/A is displayed.
resp-rec-tunnel-far-end-addr
N/A
Round Trip Time
The round trip time between SDP echo request and the SDP echo reply. If the request is not sent, times out or is terminated, N/A is displayed.
delta-request-reply
N/A
- Multiple Response Connectivity Tests
When the connectivity test count is greater than one (1), a single line is displayed per SDP echo request send attempt.
The request number is a sequential number starting with 1 and ending with the last request sent, incrementing by one (1) for each request. This should not be confused with the message-id contained in each request and reply message.
A response message indicates the result of the message request. Following the response message is the round trip time value. If any reply is received, the round trip time is displayed.
After the last reply has been received or response timed out, a total is displayed for all messages sent and all replies received. A maximum, minimum and average round trip time is also displayed. Error response and timed out requests do not apply toward the average round trip time.
Parameters
- orig-sdp-id
Specifies the SDP-ID to be used by sdp-ping, expressed as a decimal integer. The far-end address of the specified SDP-ID is the expected responder-id within each reply received. The specified SDP-ID defines the encapsulation of the SDP tunnel encapsulation used to reach the far end. This can be IP or MPLS. If orig-sdp-id is invalid or administratively down or unavailable for some reason, the SDP Echo Request message is not sent and an appropriate error message is displayed (when the interval timer expires, sdp-ping attempts to send the next request if required).
- resp-sdp resp-sdp-id
Specifies the return SDP-ID to be used by the far-end 7210 SAS for the message reply for round trip SDP connectivity testing. If resp-sdp-id does not exist on the far-end 7210 SAS, terminates on another 7210 SAS different from the originating 7210 SAS, or another issue prevents the far-end router from using resp-sdp-id, the SDP echo reply is sent using generic IP OAM encapsulation. The received forwarding class (as mapped on the ingress network interface for the far end) defines the forwarding class encapsulation for the reply message.
- fc fc-name
Specifies the fc parameter used to indicate the forwarding class of the SDP encapsulation. The actual forwarding class encoding is controlled by the network egress DSCP or LSP-EXP mappings.
The DSCP or LSP-EXP mappings on the receive network interface controls the mapping back to the internal forwarding class used by the far-end 7210 SAS that receives the message request. The egress mappings of the egress network interface on the far-end 7210 SAS controls the forwarding class markings on the return reply message.
The DSCP or LSP-EXP mappings on the receive network interface controls the mapping of the message reply back at the originating 7210 SAS. This is displayed in the response message output upon receipt of the message reply.
- timeout seconds
Specifies the timeout parameter, in seconds, expressed as a decimal integer. This value is used to override the default timeout value and is the amount of time that the router waits for a message reply after sending the message request. Upon the expiration of message timeout, the requesting router assumes that the message response has not been received. A ‛request timeout’ message is displayed by the CLI for each message request sent that expires. Any response received after the request times out is silently discarded.
- interval seconds
Specifies the interval parameter, in seconds, expressed as a decimal integer. This parameter is used to override the default request message send interval and defines the minimum amount of time that must expire before the next message request is sent.
If the interval is set to 1 second, and the timeout value is set to 10 seconds, the maximum time between message requests is 10 seconds and the minimum is 1 second. This depends upon the receipt of a message reply corresponding to the outstanding message request.
- size octets
Specifies the size parameter in octets, expressed as a decimal integer. This parameter is used to override the default message size for the sdp-ping request. Changing the message size is a method of checking the ability of an SDP to support a path-mtu. The size of the message does not include the SDP encapsulation, VC-Label (if applied) or any DLC headers or trailers.
When the OAM message request is encapsulated in an IP/ SDP, the IP ‛DF’ (Do Not Fragment) bit is set. If any segment of the path between the sender and receiver cannot handle the message size, the message is discarded. MPLS LSPs are not expected to fragment the message either, as the message contained in the LSP is not an IP packet.
- send-count send-count
Specifies the number of messages to send, expressed as a decimal integer. The count parameter is used to override the default number of message requests sent. Each message request must either timeout or receive a reply before the next message request is sent. The message interval value must be expired before the next message request is sent.
Output
The following output is an example of Multiple Response Round Trip Connectivity Test.
Multiple response round trip connectivity test sample output*A:DUT-A# oam sdp-ping 101 resp-sdp 102
Err SDP-ID Info Local Remote
--------------------------------------------------
SDP-ID: 101 102
Administrative State: Up Up
Operative State: Up Up
Path MTU: 9186 N/A
Response SDP Used: Yes
IP Interface State: Up
Actual IP Address: 10.20.1.1 10.20.1.2
Expected Peer IP: 10.20.1.2 10.20.1.1
Forwarding Class be be
Profile Out Out
Request Result: Sent - Reply Received
RTT: 10(ms)
*A:DUT-A# oam sdp-ping 101 resp-sdp 102 count 10
Request Response RTT
-----------------------------------------------------
1 Success 10ms
2 Success 0ms
3 Success 0ms
4 Success 0ms
5 Success 0ms
6 Success 0ms
7 Success 0ms
8 Success 0ms
9 Success 0ms
10 Success 0ms
Sent: 10 Received: 10
Min: 0ms Max: 10ms Avg: 1ms
*A:DUT-A#
vccv-ping
Syntax
vccv-ping sdp-id:vc-id [src-ip-address ip-addr dst-ip-address ip-addr pw-id pw-id][reply-mode {ip-routed|control-channel}] [fc fc-name] [size octets] [send-count send-count] [timeout timeout] [interval interval] [ttl vc-label-ttl]
vccv-ping saii-type2 global-id:prefix:ac-id taii-type2 global-id:prefix:ac-id [reply-mode ip-routed | control-channel] [src-ip-address ip-addr dst-ip-address ip-addr]
vccv-ping spoke-sdp-fec spoke-sdp-fec-id [reply-mode ip-routed | control-channel] [saii-type2 global-id:prefix:ac-id taii-type2 global-id:prefix:ac-id] [src-ip-address ip-addr dst-ip-address ip-addr]
options common to all vccv-ping cases: [count send-count] [fc fc-name [profile in | out]] [interval interval] [size octets] [timeout timeout] [ttl vc-label-ttl]
Context
oam
config>saa>test
Platforms
Supported on all 7210 SAS platforms as described in this document, except those operating in access-uplink mode
Description
This command configures a Virtual Circuit Connectivity Verification (VCCV) ping test. A vccv-ping test checks connectivity of a VLL inband. It checks to verify that the destination (target) PE is the egress for the Layer 2 FEC. It provides for a cross-check between the data plane and the control plane. It is inband which means that the vccv-ping message is sent using the same encapsulation and along the same path as user packets in that VLL. The vccv-ping test is the equivalent of the lsp-ping test for a VLL service. The vccv-ping reuses an lsp-ping message format and can be used to test a VLL configured over an MPLS.
Note that VCCV ping can be initiated on TPE or SPE. If initiated on the SPE, the reply-mode parameter must be used with the ip-routed value The ping from the TPE can have either values or can be omitted, in which case the default value is used.
If a VCCV ping is initiated from TPE to neighboring a SPE (one segment only) it is sufficient to only use the sdpid:vcid parameter. However, if the ping is across two or more segments, at least the sdpId:vcId, src-ip-address ip-addr, dst-ip-address ip-addr, ttl vc-label-ttland pw-id pw-id parameters are used where:
The src-ip-address is system IP address of the router preceding the destination router.
The pwid is actually the VC ID of the last pseudowire segment.
The vc-label-ttl must have a value equal or higher than the number of pseudowire segments.
Note that VCCV ping is a multi-segment pseudowire. For a single-hop pseudowire, only the peer VCCV CC bit of the control word is advertised when the control word is enabled on the pseudowire. VCCV ping on multi-segment pseudowires require that the control word be enabled in all segments of the VLL.
If the control word is not enabled on spoke SDP it does not signal peer VCCV CC bits to the far end, consequently VCCV ping cannot be successfully initiated on that specific spoke SDP.
Parameters
- sdp-id:vc-id
Specifies the VC ID of the pseudowire being tested. The VC ID needs to exist on the local router and the far-end peer needs to indicate that it supports VCCV to allow the user to send vccv-ping message.
- spoke-sdp-fec spoke-sdp-fec-id
Specifies the spoke-sdp-fec-id if a FEC 129 PW is being tested. The spoke-sdp-fec-id must exist on the local router and the far-end peer needs to indicate that it supports VCCV to allow the user to send vccv-ping messages.
spoke-sdp-fec is mutually exclusive with the sdp-id:vc-id parameter.
- src-ip-address ip-addr
Specifies the source IP address.
- control-channel {ipv4 | non-ip}
Specifies the encapsulation format to use for the VCCV ping echo request and echo reply packet.
- saii-type2 global-id:prefix:ac-id
Specifies the source attachment individual identifier (SAII) if a FEC129 AII Type 2 pseudowire is being tested.
The saii-type2 parameter is mutually exclusive with the sdp-id:vc-id parameter.
Syntax:
global-id — The global ID of this T-PE node.
Values:
1 to 4294967295
prefix — The prefix on this T-PE node that the spoke-SDP is associated with.
ac-id — An unsigned integer representing a locally unique identifier for the spoke-SDP.
Values:
1 to 4294967295
- taii-type2 global-id:prefix:ac-id
Specifies the target attachment individual identifier (TAII) if a FEC129 AII Type 2 pseudowire is being tested. The taii-type2 parameter is mutually exclusive with sdp-id:vc-id.
Syntax:
global-id – The global ID of the far end T-PE node of the FEC129 pseudowire.
Values:
1 to 4294967295
prefix — The prefix on far end. T-PE node that the pseudowire being tested is associated with.
Values:
ipv4-formatted address: a.b.c.d
ac-id — An unsigned integer representing a locally unique identifier for the pseudowire being tested at the far end T-PE.
Values:
1 to 4294967295
- dst-ip-address ip-address
Specifies the destination IP address.
- pw-id pw-id
Specifies the pseudowire ID to be used for performing a vccv-ping operation. The pseudowire ID is a non-zero 32-bit connection ID required by the FEC 128, as defined in RFC 4379, Detecting Multi-Protocol Label Switched (MPLS) Data Plane Failures.
- reply-mode {ip-routed | control-channel}
Specifies to the far-end how to send the reply message.The option control-channel indicates a reply mode in-band using vccv control channel.
- fc fc-name
Specifies the fc parameter used to indicate the forwarding class of the MPLS echo request packets. The actual forwarding class encoding is controlled by the network egress LSP-EXP mappings.
The LSP-EXP mappings on the receive network interface controls the mapping back to the internal forwarding class used by the far-end 7210 SAS that receives the message request. The egress mappings of the egress network interface on the far-end router controls the forwarding class markings on the return reply message. The LSP-EXP mappings on the receive network interface controls the mapping of the message reply back at the originating SR.
- timeout seconds
Specifies the timeout parameter, in seconds, expressed as a decimal integer. This value is used to override the default timeout value and is the amount of time that the router waits for a message reply after sending the message request. Upon the expiration of message timeout, the requesting router assumes that the message response has not been received. A ‛request timeout’ message is displayed by the CLI for each message request sent that expires. Any response received after the request times out is silently discarded.
- interval seconds
Specifies the interval parameter, in seconds, expressed as a decimal integer. This parameter is used to override the default request message send interval and defines the minimum amount of time that must expire before the next message request is sent.
If the interval is set to 1 second, and the timeout value is set to 10 seconds, the maximum time between message requests is 10 seconds and the minimum is 1 second. This depends upon the receipt of a message reply corresponding to the outstanding message request.
- size octets
Specifies the VCCV ping echo request packet size, in octets, expressed as a decimal integer. The request payload is padded with zeros to the specified size.
- send-count send-count
Specifies the number of messages to send, expressed as a decimal integer. The count parameter is used to override the default number of message requests sent. Each message request must either timeout or receive a reply before the next message request is sent. The message interval value must be expired before the next message request is sent.
- ttl vc-label-ttl
Specifies the time-to-live value for the vc-label of the echo request message. The outer label TTL is still set to the default of 255 regardless of this value.
vccv-trace
Syntax
vccv-trace sdp-id:vc-id [fc fc-name [profile {in | out}]] [size octets] [reply-mode ip-routed | control-channel] [probe-count probe-count] [timeout timeout] [interval interval] [min-ttl min-vc-label-ttl] [max-ttl max-vc-label-ttl] [max-fail no-response-count] [detail]
vccv-trace saii-type2 global-id:prefix:ac-id taii-type2 global-id:prefix:ac-id [reply-mode ip-routed | control-channel]
vccv-trace spoke-sdp-fec spoke-sdp-fec-id [reply-mode ip-routed | control-channel] [saii-type2 global-id:prefix:ac-id taii-type2 global-id:prefix:ac-id]
options common to all vccv-trace cases: [detail] [fc fc-name [profile in | out]] [interval interval-value] [max-fail no-response-count] [max-ttl max-vc-label-ttl] [min-ttl min-vc-label-ttl] [probe-count probe-count] [size octets] [timeout timeout-value]
Context
oam
config>saa>test>type
Platforms
Supported on all 7210 SAS platforms as described in this document.
Description
This command configures a Virtual Circuit Connectivity Verification (VCCV) automated trace test. The automated VCCV-trace can trace the entire path of a PW with a single command issued at the T-PE or at an S-PE. This is equivalent to LSP-trace and is an iterative process by which the source T-PE or S-PE node sends successive VCCV-ping messages with incrementing the TTL value, starting from TTL=1.
In each iteration, the T-PE builds the MPLS echo request message in a way similar to vccv-ping. The first message with TTL=1 has the next-hop S-PE T-LDP session source address in the Remote PE Addressí field in the PW FEC TLV. Each S-PE which terminates and processes the message includes in the MPLS echo reply message the FEC 128 TLV corresponding the PW segment to its downstream node. The source T-PE or S-PE node can build the next echo reply message with TTL=2 to test the next-next hop for the MS-PW. It copies the FEC TLV it received in the echo reply message into the new echo request message. The process is terminated when the reply is from the egress T-PE or when a timeout occurs.
The user can specify to display the result of the VCCV-trace for a fewer number of PW segments of the end-to-end MS-PW path. In this case, the min-ttl and max-ttl parameters are configured accordingly. However, the T-PE/S-PE node still probes all hops up to min-ttl to correctly build the FEC of the desired subset of segments.
Parameters
- sdpid:vcid
Specifies the VC ID of the pseudowire being tested. The VC ID needs to exist on the local 7210 SAS and the far-end peer needs to indicate that it supports VCCV to allow the user to send vccv-ping message.
- reply-mode {ip-routed | control-channel}
Specifies the reply-mode parameter to indicate to the far-end how to send the reply message. The option control-channel indicates a reply mode in-band using the VCCV control channel.
Note that when a VCCV trace message is originated from an S-PE node, the user should use the IPv4 reply mode because the replying node does not know how to set the TTL to reach the sending S-PE node. If the user attempts this, a warning is issued to use the ipv4 reply mode.
- control-channel {none | non-ip}
Specifies the encapsulation format to use for the VCCV ping echo request and echo reply packet.
- spoke-sdp-fec spoke-sdp-fec-id
Specifies the spoke-sdp-fec-id if a FEC 129 PW is being tested. The spoke-sdp-fec-id must exist on the local router and the far-end peer needs to indicate that it supports VCCV to allow the user to send vccv-ping messages.
spoke-sdp-fec is mutually exclusive with the sdp-id:vc-id parameter.
- saii-type2 global-id:prefix:ac-id
Specifies the source attachment individual identifier (SAII) if a FEC129 AII Type 2 pseudowire is being tested.
The saii-type2 parameter is mutually exclusive with the sdp-id:vc-id parameter.
Syntax:
global-id — The global ID of this 7210 T-PE node.
Values:
1 to 4294967295
prefix — The prefix on this 7210 T-PE node that the spoke-SDP is associated with.
ac-id — An unsigned integer representing a locally unique identifier for the spoke-SDP.
Values:
1 to 4294967295
- taii-type2 global-id:prefix:ac-id
Specifies the target attachment individual identifier (TAII) if a FEC129 AII Type 2 pseudowire is being tested. The taii-type2 parameter is mutually exclusive with sdp-id:vc-id.
Syntax:
global-id – The global ID of the far end T-PE of the FEC129 pseudowire.
Values:
1 to 4294967295
prefix — The prefix on far end T-PE that the pseudowire being tested is associated with.
Values:
ipv4-formatted address: a.b.c.d
ac-id — An unsigned integer representing a locally unique identifier for the pseudowire being tested at the far end T-PE.
Values:
1 to 4294967295
- fc fc-name [profile {in | out}
Specifies the fc and profile parameters used to indicate the forwarding class of the VCCV trace echo request packets. The actual forwarding class encoding is controlled by the network egress LSP-EXP mappings.
The LSP-EXP mappings on the receive network interface controls the mapping back to the internal forwarding class used by the far-end router that receives the message request. The egress mappings of the egress network interface on the far-end router controls the forwarding class markings on the return reply message. The LSP-EXP mappings on the receive network interface controls the mapping of the message reply back at the originating router.
- fc-name
Specifies the forwarding class of the VCCV trace echo request encapsulation.
- profile {in | out}
Specifies the profile state of the VCCV trace echo request encapsulation.
- size octets
Specifies the VCCV ping echo request packet size in octets, expressed as a decimal integer. The request payload is padded with zeros to the specified size.
- probe-count probe-count
Specifies the number of VCCV trace echo request messages to send per TTL value.
- timeout timeout
Specifies the timeout parameter in seconds, expressed as a decimal integer. This value is used to override the default timeout value and is the amount of time that the router waits for a message reply after sending the message request. Upon the expiration of message timeout, the requesting router assumes that the message response has not been received. A request timeout message is displayed by the CLI for each message request sent that expires. Any response received after the request times out is silently discarded.
- interval interval
The interval parameter in seconds, expressed as a decimal integer. This parameter is used to override the default request message send interval and defines the minimum amount of time that must expire before the next message request is sent.
If the interval is set to 1 second, and the timeout value is set to 10 seconds, the maximum time between message requests is 10 seconds and the minimum is 1 second. This depends upon the receipt of a message reply corresponding to the outstanding message request.
- min-ttl min-vc-label-ttl
Specifies the TTL value for the VC label of the echo request message for the first hop of the MS-PW for which the results are to be displayed. This is expressed as a decimal integer. Note that the outer label TTL is still set to the default of 255 regardless of the value of the VC label.
- max-ttl max-vc-label-ttl
Specifies the TTL value for the VC label of the echo request message for the last hop of the MS-PW for which the results are to be displayed. This is expressed as a decimal integer. Note that the outer label TTL is still set to the default of 255 regardless of the value of the VC label.
- max-fail no-response-count
Specifies the maximum number of consecutive VCCV trace echo requests, expressed as a decimal integer that do not receive a reply before the trace operation fails for a specific TTL value.
OAM SAA commands
saa
Syntax
saa test-name [owner test-owner] {start | stop} [no-accounting]
Context
oam
Platforms
Supported on all 7210 SAS platforms as described in this document, including platforms configured in the access-uplink operating mode
Description
This command starts or stops an SAA test.
Parameters
- test-name
Specifies the name of the SAA test. The test name must already be configured in the config>saa>test context.
- owner test-owner
Specifies the owner of an SAA operation up to 32 characters.
- start
Starts the test. A test cannot be started if the same test is still running.
A test cannot be started if it is in a shut-down state. An error message and log event are generated to indicate a failed attempt to start an SAA test run. A test cannot be started if it is in a continuous state.
- stop
Stops a test in progress. A test cannot be stopped if it is not in progress. A log message is generated to indicate that an SAA test run has been aborted. A test cannot be stopped if it is in a continuous state.
- no-accounting
Disables the recording results in the accounting policy. If no-accounting is specified, the MIB record produced at the end of the test is not added to the accounting file. It does however use up one of the three MIB rows available for the accounting module to be collected.
LDP treetrace commands
ldp-treetrace
Syntax
ldp-treetrace {prefix ip-prefix/mask} [max-ttl ttl-value] [max-path max-paths] [timeout timeout] [retry-count retry-count] [fc fc-name [profile profile]] [downstream-map-tlv {dsmap|ddmap}]
Context
oam
Platforms
7210 SAS-T, 7210 SAS-Mxp, 7210 SAS-Sx/S 1/10GE (standalone and standalone-VC), 7210 SAS-Sx 10/100GE, 7210 SAS-R6, and 7210 SAS-R12
Description
This command configures LDP treetrace to perform a single run of the LDP ECMP OAM tree trace. LDP treetrace tests are run to discover all ECMP paths of an LDP FEC
Parameters
- prefix ip-prefix/mask
Specifies the address prefix and subnet mask of the target BGP IPv4 label route.
- max-ttl max-label-ttl
Specifies the maximum TTL value in the MPLS label for the LSP trace test, expressed as a decimal integer.
- max-paths max-paths
Specifies the maximum number of paths for an LDP treetrace test, expressed as a decimal integer.
- timeout timeout
Specifies the timeout, in seconds, expressed as a decimal integer. This value overrides the default timeout value. It specifies the amount of time the router will wait for a message reply after sending the message request. When the message timeout expires, the requesting router assumes that the message response will not be received. Any response received after the request times out is silently discarded.
- fc fc-name
Specifies the forwarding class of the MPLS echo request packet.
When an MPLS echo request packet is generated in the CPM and forwarded to the outgoing interface, the packet is queued in the egress network queue corresponding to the specified fc and profile parameter values. The LSP-EXP mappings on the outgoing interface control the marking of the packet EXP.
When the MPLS echo request packet is received on the responding node, the LSP-EXP mappings of the incoming interface determine the fc parameter values.
When an MPLS echo reply packet is generated in the CPM and forwarded to the outgoing interface, the packet is queued in the egress network queue corresponding to the fc parameter. The parameter values is determined by the classification of the echo request packet being replied to at the incoming interface control the marking of the packet. The LSP-EXP mappings on the outgoing interface. The TOS byte is not modified. The following table summarizes the MPLS echo request packet behavior.
Table 22. Request packet and behavior for sender and responder nodes Node Packet and description of behavior CPM (sender node)
echo request packet:
packet{tos=1, fc1}
fc1 and profile1 are as entered by user in OAM command or default values
tos1 as per mapping of {fc1} to IP precedence in network egress QoS policy of outgoing interface
Outgoing interface (sender node)
echo request packet:
pkt queued as {fc1}
ToS field=tos1 not remarked
EXP=exp1, as per mapping of {fc1} to EXP in network egress QoS policy of outgoing interface
Incoming interface (responder node)
echo request packet:
packet{tos1, exp1}
exp1 mapped to {fc2} as per classification in network QoS policy of incoming interface
CPM (responder node)
echo reply packet:
packet{tos=1, fc2}
Outgoing interface (responder node)
echo reply packet:
pkt queued as {fc2}
ToS filed= tos1 not remarked (reply inband or out-of-band)
EXP=exp2, if reply is inband, remarked as per mapping of {fc2, profile2} to EXP in network egress QoS policy of outgoing interface
Incoming interface (sender node)
echo reply packet:
packet{tos1, exp2}
exp2 mapped to {fc1, profile1} as per classification in network QoS policy of incoming interface
- profile profile
Specifies the profile state of the MPLS echo request packet.
- retry-count retry-count
Specifies the maximum number of consecutive MPLS echo requests, expressed as a decimal integer, that do not receive a reply before the trace operation fails for a specific TTL.
- downstream-map-tlv {dsmap | ddmap}
Specifies which format of the Downstream Mapping TLV to use in the LSP trace packet. Use dsmap for the original DSMAP TLV format defined in RFC 4379. Use ddmap for the enhanced DDMAP TLV format defined in RFC 6424.
Output
The following output is an example of LDP treetrace information.
Sample output*A:Dut-A# oam ldp-treetrace prefix 10.20.1.6/32
ldp-treetrace for Prefix 10.20.1.6/32:
127.0.0.1, ttl = 3 dst = 127.1.0.255 rc = EgressRtr status = Done
Hops: 127.0.0.1 127.0.0.1
127.0.0.1, ttl = 3 dst = 127.2.0.255 rc = EgressRtr status = Done
Hops: 127.0.0.1 127.0.0.1
ldp-treetrace discovery state: Done
ldp-treetrace discovery status: ' OK '
Total number of discovered paths: 2
Total number of failed traces: 0
test-oam
Syntax
test-oam
Context
config
Platforms
7210 SAS-T, 7210 SAS-Mxp, 7210 SAS-Sx/S 1/10GE (standalone and standalone-VC), 7210 SAS-Sx 10/100GE, 7210 SAS-R6, and 7210 SAS-R12
Description
Commands in this context configure Operations, Administration, and Maintenance test parameters.
ldp-treetrace
Syntax
[no] ldp-treetrace
Context
config>test-oam
Platforms
7210 SAS-T, 7210 SAS-Mxp, 7210 SAS-Sx/S 1/10GE (standalone and standalone-VC), 7210 SAS-Sx 10/100GE, 7210 SAS-R6, and 7210 SAS-R12
Description
This command configures the LDP ECMP OAM tree trace which consists of an LDP ECMP path discovery and an LDP ECMP path probing features.
The no option deletes the configuration for the LDP ECMP OAM tree discovery and path probing under this context.
Output
The following outputs are examples of LDP treetrace information over a numbered IP interface.
Sample output*A:Dut-B# oam ldp-treetrace prefix 10.20.1.5/32
ldp-treetrace for Prefix 10.20.1.5/32:
10.10.131.2, ttl = 2 dst = 127.1.0.253 rc = EgressRtr status = Done
Hops: 11.1.0.2
10.10.132.2, ttl = 2 dst = 127.1.0.255 rc = EgressRtr status = Done
Hops: 11.1.0.2
10.10.131.2, ttl = 2 dst = 127.2.0.255 rc = EgressRtr status = Done
Hops: 11.2.0.2
10.10.132.2, ttl = 2 dst = 127.2.0.253 rc = EgressRtr status = Done
Hops: 11.2.0.2
ldp-treetrace discovery state: Done
ldp-treetrace discovery status: ' OK '
Total number of discovered paths: 4
Total number of failed traces: 0
fc
Syntax
fc fc-name
no fc
Context
config>test-oam>ldp-treetrace
Platforms
7210 SAS-T, 7210 SAS-Mxp, 7210 SAS-Sx/S 1/10GE (standalone and standalone-VC), 7210 SAS-Sx 10/100GE, 7210 SAS-R6, and 7210 SAS-R12
Description
This command configures the forwarding class of the MPLS echo request packet.
When an MPLS echo request packet is generated in the CPM and forwarded to the outgoing interface, the packet is queued in the egress network queue corresponding to the specified fc parameter values. The LSP-EXP mappings on the outgoing interface control the marking of the packet EXP.
When the MPLS echo request packet is received on the responding node, the LSP-EXP mappings of the incoming interface determine the fc parameter values.
When an MPLS echo reply packet is generated in the CPM and forwarded to the outgoing interface, the packet is queued in the egress network queue corresponding to the fc parameter. The classification of the echo request packet being replied to at the incoming interface determines the value of the fc parameter. The LSP-EXP mappings on the outgoing interface control the marking of the packet EXP. The TOS byte is not modified. Request packet and behavior for sender and responder nodes summarizes this behavior.
The no form of this command reverts the FC type to the default value.
Default
be
Parameters
- fc-name
Specifies the forwarding class of the MPLS echo request packets.
path-discovery
Syntax
path-discovery
Context
config>test-oam>ldp-treetrace
Platforms
7210 SAS-T, 7210 SAS-Mxp, 7210 SAS-Sx/S 1/10GE (standalone and standalone-VC), 7210 SAS-Sx 10/100GE, 7210 SAS-R6, and 7210 SAS-R12
Description
Commands in this context configure LDP ECMP OAM path discovery.
The ingress LER sends LSP Trace messages, including the LDP IPv4 Prefix FEC TLV and DSMAP TLV to the downstream LSR to build the ECMP tree for a specific FEC (egress FEC). It also inserts an IP address range drawn from the 127/8 space. The downstream LSR uses the address range to determine the ECMP path exercised by an IP address or a subrange of addresses within the specified range based on its internal hash routine. When the ingress LER receives the MPLS echo reply, it records this information and proceeds with the next echo request message targeted for a node downstream of the first LSR node along one of the ECMP paths. The subrange of IP addresses indicated in the initial reply allows the LSR downstream of the ingress LER to pass this message to its downstream node along the first ECMP path.
Use the interval command to configure the frequency of running tree discovery.
The ingress LER gets the list of FECs from the LDP FEC database. New FECs are added to the discovery list at the next tree discovery, and not when they are learned and added into the FEC database. Use the policy-statement command to configure FECs to include or exclude the use of a policy profile.
interval
Syntax
interval minutes
no interval
Context
config>test-oam>ldp-treetrace>path-discovery
Platforms
7210 SAS-T, 7210 SAS-Mxp, 7210 SAS-Sx/S 1/10GE (standalone and standalone-VC), 7210 SAS-Sx 10/100GE, 7210 SAS-R6, and 7210 SAS-R12
Description
This command configures the frequency of the LDP ECMP OAM path-discovery process. At every interval, the node sends LSP trace messages to discover the entire ECMP path tree for a specific destination FEC.
The no form of this command reverts the interval to its default value.
Default
60
Parameters
- minutes
Specifies the number of minutes to wait before repeating the LDP tree auto-discovery process.
max-path
Syntax
max-path max-paths
Context
config>test-oam>ldp-treetrace>path-discovery
Platforms
7210 SAS-T, 7210 SAS-Mxp, 7210 SAS-Sx/S 1/10GE (standalone and standalone-VC), 7210 SAS-Sx 10/100GE, 7210 SAS-R6, and 7210 SAS-R12.
Description
This command configures the maximum number of ECMP paths the path discovery attempts to discover for each run every interval minutes.
The no form of this command reverts to the default value.
Default
16
Parameters
- max-paths
Specifies the maximum number of paths for the tree discovery.
max-ttl
Syntax
max-ttl ttl-value
Context
config>test-oam>ldp-treetrace>path-discovery
Platforms
7210 SAS-T, 7210 SAS-Mxp, 7210 SAS-Sx/S 1/10GE: standalone and standalone-VC, 7210 SAS-Sx 10/100GE, 7210 SAS-R6, and 7210 SAS-R12
Description
This command configures the maximum number of hops that are traced in the path of each FEC to be discovered.
The no form of this command reverts to the maximum time-to-live (TTL) default value.
Default
255
Parameters
- ttl-value
Specifies the maximum label TTL value for an LSP trace request during the tree discovery.
policy-statement
Syntax
policy-statement policy-name [...(up to 5 max)]
Context
config>test-oam>ldp-treetrace>path-discovery
Platforms
7210 SAS-T, 7210 SAS-Mxp, 7210 SAS-Sx/S 1/10GE: standalone and standalone-VC, 7210 SAS-Sx 10/100GE, 7210 SAS-R6, and 7210 SAS-R12
Description
This command configures FEC policy to determine which routes are imported from the LDP FEC database for the purpose of discovering its paths and probing them.
If no policy is specified, the ingress LER imports the full list of FECs from the LDP FEC database. New FECs are added to the discovery list at the next path discovery, and not when they are learned and added into the FEC database. A maximum of 500 FECs can be discovered using path discovery.
The user can configure the FECs to include or exclude.
Policies are configured in the config>router>policy-options context. A maximum of five policy names can be specified.
The no form of this command removes the policy from the configuration.
Default
no policy-statement
Parameters
- policy-name
Specifies the route policy name to filter LDP imported address FECs. Allowed values are any string up to 32 characters composed of printable, 7-bit ASCII characters. If the string contains special characters (#, $, spaces, and so on), the entire string must be enclosed within double quotes. The specified policy names must already be defined.
retry-count
Syntax
retry-count retry-count
no retry-count
Context
config>oam-test>ldp-treetrace>path-discovery
config>oam-test>ldp-treetrace>path-probing
Platforms
7210 SAS-T, 7210 SAS-Mxp, 7210 SAS-Sx/S 1/10GE: standalone and standalone-VC, 7210 SAS-Sx 10/100GE, 7210 SAS-R6, and 7210 SAS-R12
Description
In the config>oam-test>ldp-treetrace>path-discovery context, this command configures the number of retransmissions of an LSP trace message to discover the path of an LDP FEC when no response is received within the timeout period.
In the config>oam-test>ldp-treetrace>path-probing context, this command configures the number of retransmissions of an LSP ping message to probe the path of an LDP FEC when no response is received within the timeout period.
The no form of this command reverts to the default value.
Default
3
Parameters
- retry-count
Specifies the maximum number of consecutive timeouts allowed before failing a path probe (ping).
timeout
Syntax
timeout timeout
no timeout
Context
config>test-oam>ldp-treetrace>path-discovery
Platforms
7210 SAS-T, 7210 SAS-Mxp, 7210 SAS-Sx/S 1/10GE: standalone and standalone-VC, 7210 SAS-Sx 10/100GE, 7210 SAS-R6, and 7210 SAS-R12
Description
This command configures the maximum amount of time, in seconds, that the node will wait for a response after sending an LSP Trace message sent to discover the path of an LDP FEC before it declares failure. After consecutive failures equal to the value configured for the retry-count command, the node gives up.
The no form of this command reverts the timeout period to the default value.
Default
30
Parameters
- timeout
Specifies the timeout period, in seconds.
path-probing
Syntax
path-probing
Context
config>test-oam>ldp-treetrace
Platforms
7210 SAS-T, 7210 SAS-Mxp, 7210 SAS-Sx/S 1/10GE: standalone and standalone-VC, 7210 SAS-Sx 10/100GE, 7210 SAS-R6, and 7210 SAS-R12
Description
Commands in this context configure LDP tree trace path probing.
The periodic path exercising runs in the background to test the LDP ECMP paths discovered by the path discovery capability. The probe used is an LSP Ping message with an IP address drawn from the subrange of 127/8 addresses indicated by the output of the tree discovery for this FEC.
Use the interval command to configure the frequency of running path probes. If an interface is down on the ingress LER that is performing the LDP tree trace, LSP ping probes tfrom the interface are not sent, but the ingress LER node does not raise alarms.
The LSP ping routine updates the content of the MPLS echo request message, specifically the IP address, as soon as the LDP ECMP path discovery phase has output the results of a new computation for the path in question.
interval
Syntax
interval minutes
no interval
Context
config>test-oam>ldp-treetrace>path-probing
Platforms
7210 SAS-T, 7210 SAS-Mxp, 7210 SAS-Sx/S 1/10GE: standalone and standalone-VC, 7210 SAS-Sx 10/100GE, 7210 SAS-R6, and 7210 SAS-R12
Description
This command configures the frequency of the LSP Ping messages used to probe the paths of all LDP FECs discovered by the LDP tree trace path discovery.
The no option resets the interval to its default value.
Default
1
Parameters
- minutes
Specifies the number of minutes to wait between probing all active ECMP paths for each LDP FEC.
timeout
Syntax
timeout timeout
no timeout
Context
config>test-oam>ldp-treetrace>path-probing
Platforms
7210 SAS-T, 7210 SAS-Mxp, 7210 SAS-Sx/S 1/10GE: standalone and standalone-VC, 7210 SAS-Sx 10/100GE, 7210 SAS-R6, and 7210 SAS-R12
Description
This command configures the maximum amount of time, in minutes, that the node waits for a response after sending an LSP Ping message to probe the path of an LDP FEC before declaring failure. After consecutive failures equal to the value configured for the retry-count command, the node gives up.
The no form of this command resets the timeout period to its default value.
Default
1
Parameters
- timeout
Specifies the timeout parameter, in minutes.
mpls-echo-request-downstream-map
Syntax
mpls-echo-request-downstream-map {dsmap | ddmap}
no mpls-echo-request-downstream-map
Context
config>test-oam
Platforms
Supported on all 7210 SAS platforms as described in this document
Description
This command specifies which format of the DSMAP TLV to use in all LSP trace packets and LDP tree trace packets originated on this node. The DSMAP TLV is the original format defined in RFC 4379 and is the default value. The Downstream Detailed Mapping (DDMAP) TLV is the enhanced format, as defined in RFC 6424.
This command applies to the LSP trace of an RSVP P2P LSP, MPLS-TP LSP, or LDP unicast FEC, and to LDP tree trace of a unicast LDP FEC. It does not apply to LSP trace of an RSVP P2MP LSP, which always uses the DDMAP TLV.
The global DSMAP and DDMAP setting impacts the behavior of both OAM LSP trace packets and SAA test packets of type lsp-trace and is used by the sender node when one of the following events occurs.
An SAA test of type lsp-trace is created (not modified) and no value is specified for the per-test downstream-map-tlv {dsmap | ddmap | none} option. In this case, the SAA test downstream-map-tlv value defaults to the global mpls-echo-request-downstream-map value.
An OAM test of type lsp-trace test is executed and no value is specified for the per-test downstream-map-tlv {dsmap | ddmap | none} option. In this case, the OAM test downstream-map-tlv value defaults to the global mpls-echo-request-downstream-map value.
A consequence of the preceding rules is that a change to the value of mpls-echo-request-downstream-map does not affect the value inserted in the DSMAP TLV of existing tests.
The following are the details of the processing of the new DDMAP TLV.
When either the DSMAP TLV or the DDMAP TLV is received in an echo request message, the responder node includes the same type of TLV in the echo reply message with the correct downstream interface and label stack information.
If an echo request message without a DSMAP or DDMAP TLV expires at a node that is not the egress for the target FEC stack, the responder node always includes the DSMAP TLV in the echo reply message. This can occur in the following cases.
The user issues an LSP trace from a sender node with a min-ttl value higher than 1 and a max-ttl value lower than the number of hops to reach the egress of the target FEC stack. This is the sender node behavior when the global configuration or the per-test setting of the DSMAP or DDMAP is set to DSMAP.
The user issues an LSP ping from a sender node with a ttl value lower than the number of hops to reach the egress of the target FEC stack. This is the sender node behavior when the global configuration of the DSMAP or DDMAP is set to DSMAP.
The behavior in 2.a is changed when the global configuration or the per-test setting of the DSMAP TLV is set to DDMAP. In this case, the sender node includes the DDMAP TLV with the Downstream IP address field set to the all-routers multicast address, as defined in Section 3.3 of RFC 4379. The responder node bypasses the interface and label stack validation and replies with a DDMAP TLV with the correct downstream information for the target FEC stack.
A sender node never includes the DSMAP or DDMAP TLV in an LSP Ping message.
In addition to performing the same features as the DSMAP TLV, the new DDMAP TLV addresses the following scenarios:
full validation of an LDP FEC stitched to a BGP IPv4 label route; in this case, the LSP trace message is inserted from the LDP LSP segment or from the stitching point
full validation of a BGP IPv4 label route stitched to an LDP FEC
full validation of an LDP FEC that is stitched to a BGP LSP and stitched back into an LDP FEC; in this case, the LSP trace message is inserted from the LDP segments or the or from the stitching points
full validation of an LDP FEC tunneled over an RSVP LSP using LSP trace
To correctly check a target FEC that is stitched to another FEC (stitching FEC) of the same or a different type, or that is tunneled over another FEC (tunneling FEC), the responding nodes must provide details about the FEC manipulation back to the sender node. This is achieved using the FEC stack change sub-TLV in the DDMAP TLV, as defined in RFC 6424.
When the user configures the use of the DDMAP TLV on a trace for an LSP that does not undergo stitching or tunneling in the network, the procedures at the sender and responder nodes are the same as for the DSMAP TLV.
This feature introduces changes to the target FEC stack validation procedures at the sender and responder nodes in the case of LSP stitching and LSP hierarchy. These changes pertain to the processing of the new FEC stack change sub-TLV in the new DDMAP TLV and the new return code of value 15 Label switched with FEC change.
The no form of this command reverts to the default behavior of using the DSMAP TLV in a LSP trace packet and LDP tree trace packet.
Default
dsmap
Output
The following output is an example of DSMAP TLV information.
LDP-over-RSVPA B D F E C
o -------- o -------- o -------- o -------- o -------- o
| \______/ | \____________________________/ | \______/ |
\ RSVP / LDP \ RSVP /
\______/ \______/
LDP LDP
Testing LDP FEC of Node C with DSMAP TLV
----------------------------------------
*A:Dut-A#
*A:Dut-A# oam lsp-trace prefix 10.20.1.3/32 downstream-map-tlv dsmap detail
lsp-trace to 10.20.1.3/32: 0 hops min, 0 hops max, 104 byte packets
1 10.20.1.2 rtt=3.90ms rc=8(DSRtrMatchLabel) rsc=1
DS 1: ipaddr=10.10.4.4 ifaddr=10.10.4.4 iftype=ipv4Numbered MRU=1500
label[1]=131068 protocol=3(LDP)
2 10.20.1.4 rtt=5.69ms rc=8(DSRtrMatchLabel) rsc=1
DS 1: ipaddr=10.10.9.6 ifaddr=10.10.9.6 iftype=ipv4Numbered MRU=1500
label[1]=131066 protocol=3(LDP)
3 10.20.1.6 rtt=7.88ms rc=8(DSRtrMatchLabel) rsc=1
DS 1: ipaddr=10.10.10.5 ifaddr=10.10.10.5 iftype=ipv4Numbered MRU=1500
label[1]=131060 protocol=3(LDP)
4 10.20.1.5 rtt=23.2ms rc=8(DSRtrMatchLabel) rsc=1
DS 1: ipaddr=10.10.5.3 ifaddr=10.10.5.3 iftype=ipv4Numbered MRU=1496
label[1]=131071 protocol=3(LDP)
5 10.20.1.3 rtt=12.0ms rc=3(EgressRtr) rsc=1
*A:Dut-A#
Testing LDP FEC of Node C with DDMAP TLV
----------------------------------------
*A:Dut-A# oam lsp-trace prefix 10.20.1.3/32 downstream-map-tlv ddmap detail
lsp-trace to 10.20.1.3/32: 0 hops min, 0 hops max, 136 byte packets
1 10.20.1.2 rtt=4.00ms rc=3(EgressRtr) rsc=2
1 10.20.1.2 rtt=3.48ms rc=8(DSRtrMatchLabel) rsc=1
DS 1: ipaddr=10.10.4.4 ifaddr=10.10.4.4 iftype=ipv4Numbered MRU=1500
label[1]=131068 protocol=3(LDP)
2 10.20.1.4 rtt=5.34ms rc=8(DSRtrMatchLabel) rsc=1
DS 1: ipaddr=10.10.9.6 ifaddr=10.10.9.6 iftype=ipv4Numbered MRU=1500
label[1]=131066 protocol=3(LDP)
3 10.20.1.6 rtt=7.78ms rc=8(DSRtrMatchLabel) rsc=1
DS 1: ipaddr=10.10.10.5 ifaddr=10.10.10.5 iftype=ipv4Numbered MRU=1500
label[1]=131060 protocol=3(LDP)
4 10.20.1.5 rtt=12.8ms rc=15(LabelSwitchedWithFecChange) rsc=1
DS 1: ipaddr=10.10.5.3 ifaddr=10.10.5.3 iftype=ipv4Numbered MRU=1496
label[1]=131054 protocol=4(RSVP-TE)
label[2]=131071 protocol=3(LDP)
fecchange[1]=PUSH fectype=RSVP IPv4 prefix=10.20.1.3 remotepeer=10.10.5.3
5 10.20.1.3 rtt=12.8ms rc=3(EgressRtr) rsc=2
5 10.20.1.3 rtt=13.4ms rc=3(EgressRtr) rsc=1
*A:Dut-A#
D F E C A B
o -------- o -------- o -------- o -------- o -------- o
\_________________/ | \_________________/ | \______/ |
LDP \ RSVP ECA / \ RSVP /
\_________________/ \______/
LDP LDP
Testing LDP FEC of Node B with DDMAP TLV
----------------------------------------
*A:Dut-D#
*A:Dut-D# oam lsp-trace prefix 10.20.1.2/32 downstream-map-tlv ddmap detail
lsp-trace to 10.20.1.2/32: 0 hops min, 0 hops max, 108 byte packets
1 10.20.1.6 rtt=3.17ms rc=8(DSRtrMatchLabel) rsc=1
DS 1: ipaddr=10.10.10.5 ifaddr=10.10.10.5 iftype=ipv4Numbered MRU=1500
label[1]=131065 protocol=3(LDP)
2 10.20.1.5 rtt=8.27ms rc=15(LabelSwitchedWithFecChange) rsc=1
DS 1: ipaddr=10.10.5.3 ifaddr=10.10.5.3 iftype=ipv4Numbered MRU=1496
label[1]=131068 protocol=4(RSVP-TE)
label[2]=131065 protocol=3(LDP)
fecchange[1]=PUSH fectype=RSVP IPv4 prefix=10.20.1.1 remotepeer=10.10.5.
3 10.20.1.3 rtt=9.50ms rc=8(DSRtrMatchLabel) rsc=2
DS 1: ipaddr=10.10.2.1 ifaddr=10.10.2.1 iftype=ipv4Numbered MRU=1500
label[1]=131068 protocol=4(RSVP-TE)
4 10.20.1.1 rtt=10.4ms rc=3(EgressRtr) rsc=2
4 10.20.1.1 rtt=10.2ms rc=15(LabelSwitchedWithFecChange) rsc=1
DS 1: ipaddr=10.10.1.2 ifaddr=10.10.1.2 iftype=ipv4Numbered MRU=1496
label[1]=131066 protocol=4(RSVP-TE)
label[2]=131071 protocol=3(LDP)
fecchange[1]=PUSH fectype=RSVP IPv4 prefix=10.20.1.2 remotepeer=10.10.1.
5 10.20.1.2 rtt=13.7ms rc=3(EgressRtr) rsc=2
5 10.20.1.2 rtt=13.6ms rc=3(EgressRtr) rsc=1
*A:Dut-D#
Testing LDP FEC of Node F with DSMAP TLV
----------------------------------------
*A:Dut-A# *A:Dut-A# oam lsp-trace prefix 10.20.1.6/32 downstream-map-
tlv dsmap detail lsp-trace to 10.20.1.6/32: 0 hops min, 0 hops max, 104 byte packets
1 10.20.1.2 rtt=2.65ms rc=8(DSRtrMatchLabel) rsc=1
2 10.20.1.3 rtt=4.89ms rc=8(DSRtrMatchLabel) rsc=1
3 10.20.1.4 rtt=6.49ms rc=5(DSMappingMismatched) rsc=1
*A:Dut-A#
Testing LDP FEC of Node F with DDMAP TLV
----------------------------------------
*A:Dut-A# oam lsp-trace prefix 10.20.1.6/32 downstream-map-tlv ddmap detail lsp-
trace to 10.20.1.6/32: 0 hops min, 0 hops max, 108 byte packets
1 10.20.1.2 rtt=3.50ms rc=15(LabelSwitchedWithFecChange) rsc=1
DS 1: ipaddr=10.10.3.3 ifaddr=10.10.3.3 iftype=ipv4Numbered MRU=1496
label[1]=131068 protocol=3(LDP)
label[2]=131060 protocol=2(BGP)
fecchange[1]=POP fectype=LDP IPv4 prefix=10.20.1.6 remotepeer=0.0.0.0 (
Unknown)
fecchange[2]=PUSH fectype=BGP IPv4 prefix=10.20.1.6 remotepeer=10.20.1.5
fecchange[3]=PUSH fectype=LDP IPv4 prefix=10.20.1.5 remotepeer=10.10.3.3
2 10.20.1.3 rtt=6.53ms rc=15(LabelSwitchedWithFecChange) rsc=2
DS 1: ipaddr=10.10.11.4 ifaddr=10.10.11.4 iftype=ipv4Numbered MRU=1496
label[1]=131060 protocol=4(RSVP-TE)
label[2]=131070 protocol=3(LDP)
label[3]=131060 protocol=2(BGP)
fecchange[1]=PUSH fectype=RSVP IPv4 prefix=10.20.1.4 remotepeer=10.10.11
.4
3 10.20.1.4 rtt=7.94ms rc=3(EgressRtr) rsc=3
3 10.20.1.4 rtt=6.69ms rc=8(DSRtrMatchLabel) rsc=2
DS 1: ipaddr=10.10.6.5 ifaddr=10.10.6.5 iftype=ipv4Numbered MRU=1500
label[1]=131071 protocol=3(LDP)
label[2]=131060 protocol=2(BGP)
4 10.20.1.5 rtt=10.1ms rc=3(EgressRtr) rsc=2
4 10.20.1.5 rtt=8.97ms rc=15(LabelSwitchedWithFecChange) rsc=1
DS 1: ipaddr=10.10.10.6 ifaddr=10.10.10.6 iftype=ipv4Numbered MRU=1500
label[1]=131071 protocol=3(LDP)
fecchange[1]=POP fectype=BGP IPv4 prefix=10.20.1.6 remotepeer=0.0.0.0 (
Unknown)
fecchange[2]=PUSH fectype=LDP IPv4 prefix=10.20.1.6 remotepeer=10.10.10.
6
5 10.20.1.6 rtt=11.8ms rc=3(EgressRtr) rsc=1 *A:Dut-A#
A B C D E
o ------- o -------- o --------- o ---3--- o
\_____/ | \_______/ |
LDP | RSVP |
|\______________________________/|
| LDP |
\______________________________/
BGP
Testing BGP Label Route of Node E with DDMAP TLV
-------------------------------------------------
*A:Dut-B# oam lsp-trace prefix 11.20.1.5/32 bgp-label downstream-map-
tlv ddmap detail lsp-trace to 11.20.1.5/32: 0 hops min, 0 hops max, 124 byte packets
1 10.20.1.3 rtt=2.35ms rc=15(LabelSwitchedWithFecChange) rsc=2
DS 1: ipaddr=10.10.11.4 ifaddr=10.10.11.4 iftype=ipv4Numbered MRU=1496
label[1]=131060 protocol=4(RSVP-TE)
label[2]=131070 protocol=3(LDP)
label[3]=131070 protocol=2(BGP)
fecchange[1]=PUSH fectype=RSVP IPv4 prefix=10.20.1.4 remotepeer=10.10.11
.4
2 10.20.1.4 rtt=4.17ms rc=3(EgressRtr) rsc=3
2 10.20.1.4 rtt=4.50ms rc=8(DSRtrMatchLabel) rsc=2
DS 1: ipaddr=10.10.6.5 ifaddr=10.10.6.5 iftype=ipv4Numbered MRU=1500
label[1]=131071 protocol=3(LDP)
label[2]=131070 protocol=2(BGP)
3 10.20.1.5 rtt=7.78ms rc=3(EgressRtr) rsc=2
3 10.20.1.5 rtt=6.80ms rc=3(EgressRtr) rsc=1 *A:Dut-B#
B C D E F
o -------- o --------- o ---3--- o ---3--- o
| \_______/ | \_____/
| RSVP |
|\______________________________/|
| LDP |
\______________________________/
BGP
Testing with DDMAP TLV LDP FEC of Node F when stitched to a BGP Label Route
----------------------------------------------------------------------------
*A:Dut-B# oam lsp-trace prefix 10.20.1.6/32 bgp-label downstream-map-
tlv ddmap detail lsp-trace to 10.20.1.6/32: 0 hops min, 0 hops max, 124 byte packets
1 10.20.1.3 rtt=3.21ms rc=15(LabelSwitchedWithFecChange) rsc=2
DS 1: ipaddr=10.10.11.4 ifaddr=10.10.11.4 iftype=ipv4Numbered MRU=1496
label[1]=131060 protocol=4(RSVP-TE)
label[2]=131070 protocol=3(LDP)
label[3]=131060 protocol=2(BGP)
fecchange[1]=PUSH fectype=RSVP IPv4 prefix=10.20.1.4 remotepeer=10.10.11
.4
2 10.20.1.4 rtt=5.50ms rc=3(EgressRtr) rsc=3
2 10.20.1.4 rtt=5.37ms rc=8(DSRtrMatchLabel) rsc=2
DS 1: ipaddr=10.10.6.5 ifaddr=10.10.6.5 iftype=ipv4Numbered MRU=1500
label[1]=131071 protocol=3(LDP)
label[2]=131060 protocol=2(BGP)
3 10.20.1.5 rtt=7.82ms rc=3(EgressRtr) rsc=2
3 10.20.1.5 rtt=6.11ms rc=15(LabelSwitchedWithFecChange) rsc=1
DS 1: ipaddr=10.10.10.6 ifaddr=10.10.10.6 iftype=ipv4Numbered MRU=1500
label[1]=131071 protocol=3(LDP)
fecchange[1]=POP fectype=BGP IPv4 prefix=10.20.1.6 remotepeer=0.0.0.0 (
Unknown)
fecchange[2]=PUSH fectype=LDP IPv4 prefix=10.20.1.6 remotepeer=10.10.10.6
4 10.20.1.6 rtt=10.2ms rc=3(EgressRtr) rsc=1 *A:Dut-B#
TWAMP commands
twamp
Syntax
twamp
Context
config>test-oam
Platforms
Supported on all 7210 SAS platforms as described in this document, including platforms configured in the access-uplink operating mode
Description
Commands in this context configure TWAMP functionality.
Default
no twamp
server
Syntax
server
Context
config>test-oam>twamp
Platforms
Supported on all 7210 SAS platforms as described in this document, including platforms configured in the access-uplink operating mode
Description
Commands in this context configure the node for TWAMP server functionality.
prefix
Syntax
prefix {ip-prefix | mask} [create]
no prefix
Context
config>test-oam>twamp>server
Platforms
Supported on all 7210 SAS platforms as described in this document, including platforms configured in the access-uplink operating mode
Description
This command configures an IP address prefix containing one or more TWAMP clients. In order for a TWAMP client to connect to the TWAMP server (and subsequently conduct tests) it must establish the control connection using an IP address that is part of a configured prefix
Default
no prefix
Parameters
- prefix ip-prefix/mask
Specifies the address prefix and subnet mask of the destination node.
- ip-prefix
Specifies the IPv4 address in dotted-decimal notation.
- mask
Specifies the prefix length.
- create
Creates an entry.
description
Syntax
description description-string
no description
Context
config>test-oam>twamp>server>prefix
Platforms
Supported on all 7210 SAS platforms as described in this document, including platforms configured in the access-uplink operating mode
Description
This command creates a text description for the current configuration context that is stored in the configuration file. The description command associates a text string with a configuration context to help identify the content in the configuration file.
The no form of this command removes the description.
Parameters
- description-string
Specifies the description character string. Allowed values are any character strings up to 80 characters composed of printable, 7-bit ASCII characters. If the string contains special characters (#, $, spaces, and so on), the entire string must be enclosed in double quotes.
max-conn-prefix
Syntax
max-conn-prefix count
no max-conn-prefix
Context
config>test-oam>twamp>server>prefix
Platforms
Supported on all 7210 SAS platforms as described in this document, including platforms configured in the access-uplink operating mode
Description
This command configures the maximum number of TWAMP control connections by clients with an IP address in a specific prefix. A new control connection is rejected if accepting it would cause either the prefix limit defined by this command or the server limit (max-conn-server) to be exceeded.
The no form of this command sets the default value.
Default
no max-conn-prefix
Parameters
- count
Specifies the maximum number of control connections.
max-sess-prefix
Syntax
max-sess-prefix count
no max-sess-prefix
Context
config>test-oam>twamp>server>prefix
Platforms
Supported on all 7210 SAS platforms as described in this document, including platforms configured in the access-uplink operating mode
Description
This command configures the maximum number of concurrent TWAMP-Test sessions by clients with an IP address in a specific prefix. A new test session (described by a Request-TW-Session message) is rejected if accepting it would cause either the limit defined by this command or the server limit (max-sess-server) to be exceeded.
The no form of this command instructs the system to go with the default value.
Default
no max-sess-prefix
Parameters
- count
Specifies the maximum number of concurrent test sessions.
inactivity-timeout
Syntax
inactivity-timeout seconds
no inactivity-timeout
Context
config>test-oam>twamp>server
Platforms
Supported on all 7210 SAS platforms as described in this document, including platforms configured in the access-uplink operating mode
Description
This command configures the inactivity timeout for all TWAMP-control connections. If no TWAMP control message is exchanged over the TCP connection for this duration of time the connection is closed and all tests in progress are terminated.
The no form of this command instructs the system to go with the default value.
Default
no inactivity-timeout
Parameters
- retry-count
Specifies the duration of the inactivity timeout.
max-conn-server
Syntax
max-conn-server count
no max-conn-server
Context
config>test-oam>twamp>server
Platforms
Supported on all 7210 SAS platforms as described in this document, including platforms configured in the access-uplink operating mode
Description
This command configures the maximum number of TWAMP control connections from all TWAMP clients.
A new control connection is rejected if accepting it would cause either this limit or a prefix limit (max-conn-prefix) to be exceeded.
The no form of this command sets the default value.
Default
no max-conn-server
Parameters
- count
Specifies the maximum number of control connections.
max-sess-server
Syntax
max-sess-server count
no max-sess-server
Context
config>test-oam>twamp>server
Platforms
Supported on all 7210 SAS platforms as described in this document, including platforms configured in the access-uplink operating mode
Description
This command configures the maximum number of concurrent TWAMP-Test sessions across all allowed clients.
A new test session (described by a Request-TW-Session message) is rejected if accepting it would cause either the limit defined by this command or a prefix limit (max-sess-prefix) to be exceeded.
The no form of this command instructs the system to go with the default value.
Default
no max-sessions
Parameters
- count
Specifies the maximum number of concurrent test sessions.
shutdown
Syntax
[no] shutdown
Context
config>test-oam>twamp>server
Platforms
Supported on all 7210 SAS platforms as described in this document, including platforms configured in the access-uplink operating mode
Description
This command administratively disables the TWAMP server.
The no form of this command administratively enables the TWAMP server.
Default
shutdown
TWAMP Light commands
twamp-light
Syntax
twamp-light
Context
config>router
config>service>vprn
config>test-oam>twamp
Platforms
Supported on all 7210 SAS platforms as described in this document, including platforms configured in the access-uplink operating mode
Description
Commands in this context configure TWAMP Light functionality.
The config>service>vprn context is supported on all 7210 SAS platforms as described in this document, except those operating in access-uplink mode.
reflector
Syntax
reflector [udp-port udp-port-number] [create]
no reflector
Context
config>router>twamp-light
config>service>vprn>twamp-light
Platforms
Supported on all 7210 SAS platforms as described in this document, including platforms configured in the access-uplink operating mode
Description
This command configures TWAMP Light session reflector-specific parameters. To create a reflector, the user must configure the udp-port-number value and include the create keyword.
The no form of this command removes the reflector.
The config>service>vprn>twamp-light context is supported on all 7210 SAS platforms as described in this document, except those operating in access-uplink mode.
Parameters
- udp-port-number
Specifies the destination UDP port that the session reflector listens to for TWAMP Light packets. The session controller that is launching the TWAMP Light packets must have the same destination UDP port configured as part of the TWAMP Light test. IES services use the destination UDP port that is configured under the router context. Only one UDP port may be configured per unique context. An error message is generated if the specified UDP port is unavailable.
- create
Creates the reflector.
description
Syntax
description description-string
no description
Context
config>router>twamp-light>reflector
config>router>twamp-light>reflector>prefix
config>service>vprn>twamp-light>reflector
config>service>vprn>twamp-light>reflector>prefix
Platforms
Supported on all 7210 SAS platforms as described in this document, including platforms configured in the access-uplink operating mode
Description
The config>service>vprn>twamp-light>reflector and config>service>vprn>twamp-light>reflector>prefix contexts are supported on all 7210 SAS platforms as described in this document, except those operating in access-uplink mode.
This command creates a text description for the current configuration context that is stored in the configuration file. The description command associates a text string with a configuration context to help identify the content in the configuration file.
The no form of this command removes the description.
Parameters
- description-string
Specifies the description character string. Allowed values are any character strings up to 80 characters composed of printable, 7-bit ASCII characters. If the string contains special characters (#, $, spaces, and so on), the entire string must be enclosed in double quotes.
prefix
Syntax
prefix ip-prefix/prefix-length [create]
no prefix ip-prefix/prefix-length
Context
config>router>twamp-light>reflector
config>service>vprn>twamp-light>reflector
Platforms
Supported on all 7210 SAS platforms as described in this document, including platforms configured in the access-uplink operating mode
Description
This command configures the IP prefixes that the reflector accepts TWAMP Light packets from and respond to. Each prefix requires its own configuration entry.
The no form of this command removes the specifies prefix.
The config>service>vprn>twamp-light>reflector context is supported on all 7210 SAS platforms as described in this document, except those operating in access-uplink mode.
Parameters
- ip-prefix
Specifies the IP address.
- prefix-length
Specifies the length of the IP prefix.
- create
Keyword used to create the IP prefix entry.
shutdown
Syntax
[no] shutdown
Context
config>router>twamp-light>reflector
config>service>vprn>twamp-light>reflector
Platforms
Supported on all 7210 SAS platforms as described in this document, including platforms configured in the access-uplink operating mode
Description
This command disables the TWAMP Light reflector functionality within the current context.
The no form of this command enables the TWAMP Light reflector functionality within the current context.
The config>service>vprn>twamp-light>reflector context is supported on all 7210 SAS platforms as described in this document, except those operating in access-uplink mode.
Default
shutdown
inactivity-timeout
Syntax
inactivity-timeout seconds
no inactivity-timeout
Context
config>test-oam>twamp>twamp-light
Platforms
Supported on all 7210 SAS platforms as described in this document, including platforms configured in the access-uplink operating mode
Description
This command configures the length of time to maintain stale states on the session reflector. A stale state occurs when test data information has not been refreshed or updated by newly arriving probes for that specific test in a predetermined amount of time. Any single reflector can maintain an up state for a maximum of 12000 tests. If the maximum value is exceeded, the session reflector does not have memory to allocate to new tests.
The no form of this command disables the inactivity timer.
Default
inactivity-timer 100
Parameters
- seconds
Specifies the number of seconds to maintain a stale state.
session
Syntax
session session-name [test-family {ethernet | ip} [session-type {proactive | on-demand}] create]
no session session-name
Context
config>oam-pm
Platforms
Supported on all 7210 SAS platforms as described in this document, including platforms configured in the access-uplink operating mode
Description
This command configures the individual session containers that house the test-specific configuration parameters. Because this session context provides only a container abstract to house the individual test functions, it cannot be shut down. Only individual tests sessions within the container may be shut down. No values, parameters, or configuration within this context may be changed if any individual test is active. Changes may only be made when all tests within the context are shut down, with the exception of the description.
The no form of this command removes the session.
Parameters
- session-name
Specifies the name of the session container. 32 characters maximum.
- ethernet
Specifies that the test is based on the Ethernet layer.
- ip
Specifies that the test is based on the IP layer.
- proactive
Specifies that the test is always on, with no stop. Tests are proactive by default.
- on-demand
Specifies that the test runs on demand, with an immediate start and no stop, or a stop based on offset.
- create
Keyword to create the session container.
ip
Syntax
ip
Context
config>oam-pm>session
Platforms
Supported on all 7210 SAS platforms as described in this document, including platforms configured in the access-uplink operating mode
Description
Commands in this context configure the IP-specific source and destination information, the priority, and the IP test tools on the launch point.
destination
Syntax
destination ip-address
no destination
Context
config>oam-pm>session>ip
Platforms
Supported on all 7210 SAS platforms as described in this document, including platforms configured in the access-uplink operating mode
Description
This command configures the destination IP address to which the TWAMP Light packets are addressed. The destination address must be included in the prefix list on the session reflector within the context to allow the reflector to process the inbound TWAMP Light packets.
The no form of this command removes the destination parameters.
Default
no destination
Parameters
- ip-address
Specifies the IP address of the peer to which the packets are directed.
dest-udp-port
Syntax
dest-udp-port udp-port-number
no dest-udp-port
Context
config>oam-pm>session>ip
Platforms
Supported on all 7210 SAS platforms as described in this document, including platforms configured in the access-uplink operating mode
Description
This command configures the destination UDP port to which the TWAMP Light packets are sent from the session controller. This value must match the udp-port udp-port number configured on the TWAMP Light reflector that responds to this specific TWAMP Light test.
The no form of this command removes the destination UDP port configuration.
Parameters
- udp-port-number
Specifies the destination UDP port.
fc
Syntax
fc fc-name
no fc
Context
config>oam-pm>session>ip
Platforms
Supported on all 7210 SAS platforms as described in this document, including platforms configured in the access-uplink operating mode
Description
This command configures the forwarding class designation for TWAMP Light packets that are sent through the node and exposed to the various QoS functions on the network element.
The no form of this command restores the default value.
Default
fc be
Parameters
- fc-name
Specifies the forwarding class.
forwarding
Syntax
forwarding bypass-routing
forwarding interface interface-name
forwarding next-hop ip-address
no forwarding
Context
config>oam-pm>session>ip
Platforms
Supported on all 7210 SAS platforms as described in this document, including platforms configured in the access-uplink operating mode
Description
This command configures influence for the forwarding decision of the TWAMP Light packet. When this command is used, only one of the forwarding options can be enabled at any time.
The no form of this command removes the configured influence and enables the default forwarding logic.
Default
no forwarding
Parameters
- bypass-routing
Specifies that packets should be sent to a host on a directly attached network, bypassing the routing table.
- interface-name
Specifies the name of the interface from which the packet is sent. The name must already exist in the config>router>interface context or within the appropriate config>service context. 32 characters maximum.
- ip-address
Specifies the IP address of the next hop.
profile
Syntax
profile {in | out}
no profile
Context
config>oam-pm>session>ip
Platforms
Supported on all 7210 SAS platforms as described in this document, including platforms configured in the access-uplink operating mode
Description
This command configures whether TWAMP Light PDUs are treated as in-profile or out-of-profile.
The no form of this command restores the default value. The default has been selected because the forwarding class defaults to best effort.
Default
profile out
Parameters
- in
Specifies that TWAMP Light PDU packets are treated as in-profile.
- out
Specifies that TWAMP Light PDU packets are treated as out-of-profile.
router
Syntax
router router-instance
router service-name service-name
no router
Context
config>oam-pm>session>ip
Platforms
Supported on all 7210 SAS platforms as described in this document, including platforms configured in the access-uplink operating mode
Description
This command configures the source context from which TWAMP Light packets are launched. The routing instance and service name must be a VPRN instance.
VPRN instances may only be specified on 7210 SAS platforms that support VPRN services. See the platform-specific 7210 SAS-Mxp, R6, R12, S, Sx, T Quality of Service Guide for information about platform support for VPRN services.
The no form of this command restores the default value.
Default
router base
Parameters
- router-instance
Specifies the routing instance from which the TWAMP Light packets are launched.
- service-name
Specifies the name of the service from which the TWAMP Light packets are launched. 64 characters maximum.
source
Syntax
source ip-address
no source
Context
config>oam-pm>session>ip
Platforms
Supported on all 7210 SAS platforms as described in this document, including platforms configured in the access-uplink operating mode
Description
This command configures the source IP address that the session controller (launch point) uses for the test. The source address must be a local resident IP address in the context; otherwise, the response packets are not processed by the TWAMP Light application. Only source addresses configured as part of TWAMP tests are able to process the reflected TWAMP packets from the session reflector.
The no form of this command removes the source address parameters.
Parameters
- ip-address
Specifies the source IP address.
source-udp-port
Syntax
source-udp-port udp-port-number
no source-udp-port
Context
config>oam-pm>session>ip
Platforms
Supported on all 7210 SAS platforms as described in this document, including platforms configured in the access-uplink operating mode
Description
This command restricts the source UDP range. When this command is omitted, the source UDP port is dynamically allocated by the system. This command should only be used if a TWAMP Client is used to establish a TCP connection and communicate the test parameters to a TWAMP Server over TWAMP TCP Control, and the test is launched from OAM-PM (Session-Sender). This command should not be used when the reflection point is a TWAMP Light reflector that does not require TCP TWAMP Control.
The no form of this command removes the source UDP port configuration and enables default allocation.
Default
no source-udp-port
Parameters
- udp-port-number
Specifies the source UDP port.
ttl
Syntax
ttl time-to-live
no ttl
Context
config>oam-pm>session>ip
Platforms
Supported on all 7210 SAS platforms as described in this document, including platforms configured in the access-uplink operating mode
Description
This command configures the value of the TTL (time to live) field in the IP header.
The no form of this command restores the default value.
Default
ttl 255
Parameters
- time-to-live
Specifies the numerical value to place in the TTL field.
twamp-light
Syntax
twamp-light [test-id test-id] [create]
no twamp-light
Context
config>oam-pm>session>ip
Platforms
Supported on all 7210 SAS platforms as described in this document, including platforms configured in the access-uplink operating mode
Description
This command assigns an identifier to the TWAMP Light test and creates the individual test.
The no form of this command removes the TWAMP Light test function from the OAM-PM session.
Default
no twamp-light
Parameters
- test-id
Specifies the value of the 4-byte local test identifier that is not sent in TWAMP Light packets.
- create
Creates the test.
interval
Syntax
interval milliseconds
no interval
Context
config>oam-pm>session>ip>twamp-light
Platforms
Supported on all 7210 SAS platforms as described in this document, including platforms configured in the access-uplink operating mode
Description
This command configures the message period, or probe spacing, for the transmission of TWAMP Light frames.
The no form of this command restores the default value.
Parameters
- milliseconds
Specifies the number of milliseconds between the transmission of TWAMP Light frames.
loss
Syntax
loss
Context
config>oam-pm>session>ip>twamp-light
Description
Commands in this context configure loss parameters for the TWAMP-Light test.
pad-size
Syntax
pad-size octets
no pad-size
Context
config>oam-pm>session>ip>twamp-light
Platforms
Supported on all 7210 SAS platforms as described in this document, including platforms configured in the access-uplink operating mode
Description
This command configures the amount by which the TWAMP Light packets are padded. TWAMP session-controller packets are 27 bytes smaller than TWAMP session-reflector packets. If symmetrical packet sizes in the forward and backward direction are required, a minimum padding of 27 bytes must be configured.
The no form of this command removes all padding.
Default
pad-size 0
Parameters
- padding
Specifies the size of the padding, in octets.
record-stats
Syntax
record-stats {delay | loss | delay-and-loss}
no record-stats
Context
config>oam-pm>session>ip>twamp-light
Platforms
Supported on all 7210 SAS platforms as described in this document, including platforms configured in the access-uplink operating mode
Description
This command configures the statistics that are recorded and reported for the TWAMP-Light PDU.
The TWAMP-Light PDU can report on both delay and loss using a single packet. The user can choose which statistics to report. Only delay recording is enabled by default. All other metrics are ignored.
To change the record statistics configuration, the user must shut down the TWAMP-Light session. This is required because base statistics are shared among various datasets as a result of the single packet approach of the TWAMP-Light PDU. Issuing a no shutdown command clears all previous non-volatile memory for the session and allocates new memory blocks.
All command parameters are mutually exclusive.
The no form of this command reverts to the default value.
Default
record-stats delay
Parameters
- delay
Specifies to report on delay using a single packet.
- loss
Specifies to report on loss using a single packet.
- delay-and-loss
Specifies to report on both delay and loss using a single packet.
shutdown
Syntax
[no] shutdown
Context
config>oam-pm>session>ip>twamp-light
Platforms
Supported on all 7210 SAS platforms as described in this document, including platforms configured in the access-uplink operating mode
Description
This command starts or stops the test.
Default
shutdown
test-duration
Syntax
test-duration seconds
no test-duration
Context
config>oam-pm>session>ip>twamp-light
Platforms
Supported on all 7210 SAS platforms as described in this document, including platforms configured in the access-uplink operating mode
Description
This optional command configures the length of time that the test runs before stopping automatically. This command is only a valid option when a session-type is configured as on-demand. This command is not an option when the session-type is configured as proactive.
The no form of this command removes a previously configured test-duration value and allows the TWAMP Light test to execute until it is stopped manually.
Default
test-duration 0
Parameters
- seconds
Specifies the length of time, in seconds, that the TWAMP light test runs.
Show commands
twamp-light
Syntax
twamp-light
Context
show>router
show>service
Platforms
Supported on all 7210 SAS platforms as described in this document, including platforms configured in the access-uplink operating mode
Description
This command displays TWAMP Light information.
Output
The following output is an example of TWAMP light information, and Output fields: TWAMP Light describes the output fields.
Sample outputshow router twamp-light
-------------------------------------------------------------------------------
TWAMP-Light Reflector
-------------------------------------------------------------------------------
Admin State : Up UDP Port : 15000
Description : (Not Specified)
Up Time : 0d 00:02:24
Test Frames Received : 0 Test Frames Sent : 0
-------------------------------------------------------------------------------
-------------------------------------------------------------------------------
TWAMP-Light Reflector Prefixes
-------------------------------------------------------------------------------
Prefix Description
-------------------------------------------------------------------------------
172.16.1.0/24
-------------------------------------------------------------------------------
No. of TWAMP-Light Reflector Prefixes: 1
-------------------------------------------------------------------------------
show service id 500 twamp-light
-------------------------------------------------------------------------------
TWAMP-Light Reflector
-------------------------------------------------------------------------------
Admin State : Up UDP Port : 15000
Description : TWAMP Light reflector VPRN 500
Up Time : 0d 01:47:12
Test Frames Received : 6431 Test Frames Sent : 6431
-------------------------------------------------------------------------------
-------------------------------------------------------------------------------
TWAMP-Light Reflector Prefixes
-------------------------------------------------------------------------------
Prefix Description
-------------------------------------------------------------------------------
10.2.1.1/32 Process only 10.2.1.1 TWAMP Light
Packets
172.16.1.0/24 Process all 172.16.1.0 TWAMP
Light packets
-------------------------------------------------------------------------------
No. of TWAMP-Light Reflector Prefixes: 2
-------------------------------------------------------------------------------
| Label | Description |
|---|---|
TWAMP Light Reflector |
|
Admin State |
Up—Specifies that the server or prefix is administratively enabled (no shutdown) in configuration. Down—Specifies that the server or prefix is administratively disabled (shutdown) in configuration. |
Decription |
Text string to describe the context of the protocol. |
Up Time |
The time since the server process was started, measured in days (d), hours, minutes, and seconds |
UDP Port |
The UDP port number used |
Test Frames Received |
The total number of frames received from session senders |
Test Frames Sent |
The total number of frames sent to session senders |
Prefixes |
The time since the server process was started, measured in days (d), hours, minutes, and seconds |
saa
Syntax
saa [test-name] [owner test-owner]
Context
show>saa
Platforms
Supported on all 7210 SAS platforms as described in this document, including platforms configured in the access-uplink operating mode
Description
This command displays information about the SAA test.
If no specific test is specified, a summary of all configured tests is displayed.
If a specific test is specified, detailed test results for that test are displayed for the last three occurrences that this test has been executed, or since the last time the counters have been reset via a system reboot or clear command.
Parameters
- test-name
Specifies the name of the SAA test for which the information needs to be displayed. The test name must already be configured in the config>saa>test context.
- owner test-owner
Specifies the owner of an SAA operation up to 32 characters.
Output
The following output is an example of SAA information, and Output fields: SAA describes the output fields.
Sample output*A:7210 SAS>show# saa
===============================================================================
SAA Test Information
===============================================================================
Test name : abc
Owner name : TiMOS CLI
Description : test
Accounting policy : None
Administrative status : Disabled
Test type : Not configured
Trap generation : None
Test runs since last clear : 0
Number of failed test runs : 0
Last test result : Undetermined
-------------------------------------------------------------------------------
Threshold
Type Direction Threshold Value Last Event Run #
-------------------------------------------------------------------------------
Jitter-in Rising None None Never None
Falling None None Never None
Jitter-out Rising None None Never None
Falling None None Never None
Jitter-rt Rising 100 None Never None
Falling 10.0 None Never None
Latency-in Rising None None Never None
Falling None None Never None
Latency-out Rising None None Never None
Falling None None Never None
Latency-rt Rising 100 None Never None
Falling 20.0 None Never None
Loss-in Rising None None Never None
Falling None None Never None
Loss-out Rising None None Never None
Falling None None Never None
Loss-rt Rising 300 None Never None
Falling 30 None Never None
===============================================================================
===============================================================================
*A:7210 SAS>show#
| Label | Description |
|---|---|
Test Name |
Specifies the name of the test. |
Owner Name |
Specifies the owner of the test. |
Description |
Specifies the description for the test type. |
Accounting policy |
Specifies the associated accounting policy ID. |
Administrative status |
Specifies whether the administrative status is enabled or disabled. |
Test type |
Specifies the type of test configured. |
Trap generation |
Specifies the trap generation for the SAA test. |
Test runs since last clear |
Specifies the total number of tests performed since the last time the tests were cleared. |
Number of failed tests run |
Specifies the total number of tests that failed. |
Last test run |
Specifies the last time a test was run. |
Threshold type |
Indicates the type of threshold event being tested, jitter-event, latency-event, or loss-event, and the direction of the test responses received for a test run: in — inbound out — outbound rt — roundtrip |
Direction |
Indicates the direction of the event threshold, rising or falling. |
Threshold |
Displays the configured threshold value. |
Value |
Displays the measured crossing value that triggered the threshold crossing event. |
Last event |
Indicates the time that the threshold crossing event occurred. |
Run # |
Indicates what test run produced the specified values. |
test-oam
Syntax
test-oam
Context
show
Platforms
Supported on all 7210 SAS platforms as described in this document, including platforms configured in the access-uplink operating mode
Description
Commands in this context display Operations, Administration, and Maintenance test parameters
Output
The following output is an example of OAM test parameters information.
Sample output*A:Dut-A# show saa "Dut-A:1413:1501" owner "TiMOS"
===============================================================================
SAA Test Information
===============================================================================
Test name : Dut-A:1413:1501
Owner name : TiMOS
Administrative status : Enabled
Test type : vccv-ping 1413:1501 fc "nc" timeout 10 size 200
count 2
Test runs since last clear : 1
Number of failed test runs : 0
Last test result : Success
-------------------------------------------------------------------------------
Threshold
Type Direction Threshold Value Last Event Run #
-------------------------------------------------------------------------------
Jitter-in Rising None None Never None
Falling None None Never None
Jitter-out Rising None None Never None
Falling None None Never None
Jitter-rt Rising None None Never None
Falling None None Never None
Latency-in Rising None None Never None
Falling None None Never None
Latency-out Rising None None Never None
Falling None None Never None
Latency-rt Rising 100 None Never None
Falling None None Never None
Loss-in Rising None None Never None
Falling None None Never None
Loss-out Rising None None Never None
Falling None None Never None
Loss-rt Rising 2 None Never None
Falling None None Never None
===============================================================================
Test Run: 144
Total number of attempts: 2
Number of requests that failed to be sent out: 0
Number of responses that were received: 2
Number of requests that did not receive any response: 0
Total number of failures: 0, Percentage: 0
(in ms) Min Max Average Jitter
Outbound : 0 0 0 0
Inbound : 10 20 15 0
Roundtrip : 10 20 15 0
Per test packet:
Sequence Outbound Inbound RoundTrip Result
1 0 20 20 EgressRtr(10.20.1.4)
2 0 10 10 EgressRtr(10.20.1.4)
===============================================================================
*A:Dut-A#
eth-cfm
Syntax
eth-cfm
Context
show
Platforms
Supported on all 7210 SAS platforms as described in this document, including platforms configured in the access-uplink operating mode
Description
Commands in this context display CFM information.
association
Syntax
association [ma-index] [detail]
Context
show>eth-cfm
Platforms
Supported on all 7210 SAS platforms as described in this document, including platforms configured in the access-uplink operating mode
Description
This command displays eth-cfm association information.
Parameters
- ma-index
Specifies the MA index.
- detail
Specifies detailed information for the eth-cfm association.
Output
The following output is an example of ETH-CFM information, and Output fields: ETH-CFM association describes the output fields.
Sample output
A:dut-b# show eth-cfm association

======================================================================
CFM Association Table
======================================================================
Md-index   Ma-index   Name                     CCM-interval Bridge-id
----------------------------------------------------------------------
1          1          a1                       1            1
1          2          a2                       1            2
2          1          a1                       1            2
2          2          a2                       1            1
======================================================================
A:dut-b#
| Label | Description |
|---|---|
Md-index |
Displays the MD index |
Ma-index |
Displays the MA index |
Name |
Displays the name of the MA |
CCM-interval |
Displays the CCM interval (in seconds) |
Bridge-id |
Displays the bridge ID for the MA. The bridge ID is the same value as the service ID of the service to which the MEP belongs. |
cfm-stack-table
Syntax
cfm-stack-tableup | down[port [port-id [vlan vlan-id]]|sdp sdp-id[:vc-id]] [level 0..7] [direction up | down]
Context
show>eth-cfm
Platforms
Supported on all 7210 SAS platforms as described in this document, including platforms configured in the access-uplink operating mode
Description
This command displays stack-table information. This stack-table is used to display the various management points MEPs and MIPs that are configured on the system. These can be Service based or facility based. If no parameters are included, the entire stack-table is displayed.
Parameters
- port port-id
Specifies the bridge port or aggregated port on which MEPs or MHFs are configured.
- vlan vlan-id
Specifies the associated VLAN ID.
- level
Specifies the MD level of the maintenance point.
- direction up | down
Specifies the direction in which the MP faces on the bridge port.
Output
The following output is an example of CFM stack-table information, and Output fields: CFM stack table describes the output fields.
Sample outputA:dut-b# show eth-cfm cfm-stack-table
========================================================================
CFM SAP Stack Table
========================================================================
Sap Level Dir Md-index Ma-index Mep-id Mac-address
------------------------------------------------------------------------
1/1/9:1 6 Down 1 1 1 00:25:ba:01:c3:6a
1/1/9:1 7 Down 2 2 1 00:25:ba:01:c3:6a
1/1/9:2 6 Down 1 2 1 00:25:ba:01:c3:6a
1/1/9:2 7 Down 2 1 1 00:25:ba:01:c3:6a
========================================================================
========================================================================
CFM Ethernet Tunnel Stack Table
========================================================================
Eth-tunnel Level Dir Md-index Ma-index Mep-id Mac-address
------------------------------------------------------------------------
========================================================================
========================================================================
CFM SDP Stack Table
========================================================================
Sdp Level Dir Md-index Ma-index Mep-id Mac-address
------------------------------------------------------------------------
No Matching Entries
========================================================================
========================================================================
CFM Virtual Stack Table
========================================================================
Service Level Dir Md-index Ma-index Mep-id Mac-address
------------------------------------------------------------------------
No Matching Entries
========================================================================
A:dut-b#
| Label | Description |
|---|---|
Sap |
Displays the SAP identifier |
Level |
Displays the MD level of the domain |
Dir (direction) |
Displays the direction of OAMPDU transmission |
Md-index |
Displays the MD index of the domain |
Ma-index |
Displays the MA index of the domain |
Mep-id |
Displays the MEP identifier |
Mac-address |
Displays the MAC address of the MEP |
domain
Syntax
domain [md-index] [association ma-index | all-associations] [detail]
Context
show>eth-cfm
Platforms
Supported on all 7210 SAS platforms as described in this document, including platforms configured in the access-uplink operating mode
Description
This command displays domain information.
Parameters
- md-index
Specifies the index of the MD to which the MP is associated, or 0, if none.
- association ma-index
Specifies the index to which the MP is associated, or 0, if none.
- all-associations
Specifies all associations to the MD.
- detail
Specifies detailed domain information.
Output
The following output is an example of ETH-CFM domain information, and Output fields: ETH-CFM domain describes the output fields.
Sample outputA:dut-b# show eth-cfm domain
==============================================================================
CFM Domain Table
==============================================================================
Md-index Level Name Format
------------------------------------------------------------------------------
1 6 d1 charString
2 7 d2 charString
==============================================================================
A:dut-b#
| Label | Description |
|---|---|
Domain |
|
Md-index |
Displays the MD index of the domain |
Level |
Displays the MD level of the domain |
Name |
Displays the name of the MD |
Name Format |
Displays the format for the MD name |
mep
Syntax
mep mep-id domain md-index association ma-index [loopback] [linktrace] [eth-bandwidth-notification]
mep mep-id domain md-index association ma-index [remote-mepid mep-id | all-remote-mepids]
mep mep-id domain md-index association ma-index eth-test-results [remote-peer mac-address]
mep mep-id domain md-index association ma-index one-way-delay-test [remote-peer mac-address]
mep mep-id domain md-index association ma-index two-way-delay-test [remote-peer mac-address]
mep mep-id domain md-index association ma-index two-way-slm-test [remote-peer mac-address]
Context
show>eth-cfm
Platforms
Supported on all 7210 SAS platforms as described in this document, including platforms configured in the access-uplink operating mode
Description
This command displays information for a specified Maintenance Endpoint (MEP).
Parameters
- domain md-index
Specifies the index of the MD to which the MP is associated, or 0, if none.
- association ma-index
Specifies the index of the MA to which the MP is associated, or 0, if none.
- loopback
Specifies loopback information for the MEP.
- linktrace
Specifies linktrace information for the MEP.
- eth-bandwidth-notification
Specifies the active ETH-BN notification parameters received from the peer and reported to the rate function on the associated port. This keyword is only supported on the 7210 SAS-Mxp, 7210 SAS-R6, and 7210 SAS-R12.
- remote-mepid
Specifies remote MEP ID information for the MEP.
- remote-peer mac-address
Specifies remote peer information for the MEP.
- one-way-delay-test
Specifies one-way delay test information for the MEP.
- two-way-delay-test
Specifies two-way delay test information for the MEP.
- two-way-slm-test
Specifies two-way SLM test information for the MEP.
- eth-test-results
Specifies ETH test result information for the MEP.
- all-remote-mepids
Specifies all remote MEP information for the MEP.
- statistics
Specifies MEP statistics.
- detail
Specifies detailed MEP information.
Output
The following outputs are examples of MEP information, and the associated tables describe the output fields:
Sample output 1A:dut-b# show eth-cfm mep 1 domain 1 association 1 linktrace
-------------------------------------------------------------------------------
Mep Information
-------------------------------------------------------------------------------
Md-index : 1 Direction : Down
Ma-index : 1 Admin : Enabled
MepId : 1 CCM-Enable : Enabled
IfIndex : 35946496 PrimaryVid : 1
FngState : fngReset ControlMep : False
LowestDefectPri : macRemErrXcon HighestDefect : none
Defect Flags : None
Mac Address : 00:25:ba:01:c3:6a CcmLtmPriority : 7
CcmTx : 0 CcmSequenceErr : 0
Eth-1Dm Threshold : 3(sec)
Eth-Ais: : Disabled
Eth-Tst: : Disabled
CcmLastFailure Frame:
None
XconCcmFailure Frame:
None
-------------------------------------------------------------------------------
Mep Linktrace Message Information
-------------------------------------------------------------------------------
LtRxUnexplained : 0 LtNextSequence : 2
LtStatus : False LtResult : False
TargIsMepId : False TargMepId : 0
TargMac : 00:00:00:00:00:00 TTL : 64
EgressId : 00:00:00:25:ba:01:c3:6a SequenceNum : 1
LtFlags : useFDBonly
-------------------------------------------------------------------------------
Mep Linktrace Replies
-------------------------------------------------------------------------------
SequenceNum : 1 ReceiveOrder : 1
Ttl : 63 Forwarded : False
LastEgressId : 00:00:00:25:ba:01:c3:6a TerminalMep : True
NextEgressId : 00:00:00:25:ba:00:5e:bf Relay : rlyHit
ChassisIdSubType : unknown value (0)
ChassisId:
None
ManAddressDomain:
None
ManAddress:
None
IngressMac : 00:25:ba:00:5e:bf Ingress Action : ingOk
IngrPortIdSubType : unknown value (0)
IngressPortId:
None
EgressMac : 00:00:00:00:00:00 Egress Action : egrNoTlv
EgrPortIdSubType : unknown value (0)
EgressPortId:
None
Org Specific TLV:
None
A:dut-b#
A:dut-b#
A:dut-b# show eth-cfm mep 1 domain 1 association 1 loopback
-------------------------------------------------------------------------------
Mep Information
-------------------------------------------------------------------------------
Md-index : 1 Direction : Down
Ma-index : 1 Admin : Enabled
MepId : 1 CCM-Enable : Enabled
IfIndex : 35946496 PrimaryVid : 1
FngState : fngReset ControlMep : False
LowestDefectPri : macRemErrXcon HighestDefect : none
Defect Flags : None
Mac Address : 00:25:ba:01:c3:6a CcmLtmPriority : 7
CcmTx : 0 CcmSequenceErr : 0
Eth-1Dm Threshold : 3(sec)
Eth-Ais: : Disabled
Eth-Tst: : Disabled
CcmLastFailure Frame:
None
XconCcmFailure Frame:
None
-------------------------------------------------------------------------------
Mep Loopback Information
-------------------------------------------------------------------------------
LbRxReply : 1 LbRxBadOrder : 0
LbRxBadMsdu : 0 LbTxReply : 0
LbSequence : 2 LbNextSequence : 2
LbStatus : False LbResultOk : True
DestIsMepId : False DestMepId : 0
DestMac : 00:00:00:00:00:00 SendCount : 0
VlanDropEnable : True VlanPriority : 7
Data TLV:
None
A:dut-b#
*A:dut-b# show eth-cfm mep 1 domain 4 association 4 two-way-delay-test remote-
peer 00:25:ba:00:5e:bf
==================================================================
Eth CFM Two-way Delay Test Result Table
==================================================================
Peer Mac Addr Delay (us) Delay Variation (us)
------------------------------------------------------------------
00:25:ba:00:5e:bf 507 507
==================================================================
*A:dut-b#
*A:dut-b# show eth-cfm mep 1 domain 4 association 4 two-way-delay-test
==================================================================
Eth CFM Two-way Delay Test Result Table
==================================================================
Peer Mac Addr Delay (us) Delay Variation (us)
------------------------------------------------------------------
00:25:ba:00:5e:bf 507 507
==================================================================
*A:dut-b#
*A:dut-a# show eth-cfm mep 2 domain 4 association 4 eth-test-results remote-
peer 00:25:ba:01:c3:6a
==============================================================
Eth CFM ETH-Test Result Table
==============================================================
Current Accumulate
FrameCount ErrBits ErrBits
Peer Mac Addr ByteCount CrcErrs CrcErrs
--------------------------------------------------------------
00:25:ba:01:c3:6a 6 0 0
384 0 0
==============================================================
*A:dut-a#
*A:dut-a# show eth-cfm mep 2 domain 4 association 4 eth-test-results
==============================================================
Eth CFM ETH-Test Result Table
==============================================================
Current Accumulate
FrameCount ErrBits ErrBits
Peer Mac Addr ByteCount CrcErrs CrcErrs
--------------------------------------------------------------
00:25:ba:01:c3:6a 6 0 0
384 0 0
==============================================================
*A:dut-a# show eth-cfm mep 2 domain 4 association 4 one-way-delay-test remote-
peer 00:25:ba:01:c3:6a
==================================================================
Eth CFM One-way Delay Test Result Table
==================================================================
Peer Mac Addr Delay (us) Delay Variation (us)
------------------------------------------------------------------
00:25:ba:01:c3:6a 402 402
==================================================================
*A:dut-a#
*A:dut-a# show eth-cfm mep 2 domain 4 association 4 one-way-delay-test
==================================================================
Eth CFM One-way Delay Test Result Table
==================================================================
Peer Mac Addr Delay (us) Delay Variation (us)
------------------------------------------------------------------
00:25:ba:01:c3:6a 402 402
==================================================================
*A:dut-a#
show eth-cfm mep 28 domain 14 association 2 all-remote-mepids detail
===============================================================================
Eth-CFM Remote-MEP Information
===============================================================================
Remote MEP ID : 30 State : True/Grace
Auto Discovered : False RDI : False
Port Status TLV : Up I/F Status TLV : Up
MAC Address : 00:00:00:00:00:30 CCM Last Change : 02/06/2014 21:37:00
Chass. ID SubType: local
Chassis ID : access-012-west
Man Addr Domain : (Not Specified)
Remote MEP ID : 32 State : True/Grace
Auto Discovered : True RDI : False
Port Status TLV : Up I/F Status TLV : Up
MAC Address : 00:00:00:00:00:32 CCM Last Change : 02/06/2014 21:37:00
Chass. ID SubType: chassisComponent
Chassis ID : (Not Specified)
Man Addr Domain : (Not Specified)
===============================================================================
show eth-cfm mep 28 domain 14 association 2 remote-mepid 30 detail
===============================================================================
Eth-CFM Remote-MEP Information
===============================================================================
Remote MEP ID : 30 State : True/Grace
Auto Discovered : False RDI : False
Port Status TLV : Up I/F Status TLV : Up
MAC Address : 00:00:00:00:00:30 CCM Last Change : 02/06/2014 21:37:00
Chass. ID SubType: local
Chassis ID : access-012-west
Man Addr Domain : (Not Specified)
===============================================================================
show eth-cfm mep 28 domain 14 association 2 remote-mepid 30
=============================================================================
Eth-CFM Remote-Mep Table
=============================================================================
R-mepId AD Rx CC RxRdi Port-Tlv If-Tlv Peer Mac Addr CCM status since
-----------------------------------------------------------------------------
30 F True False Up Up 00:00:00:00:00:30 02/06/2014 21:37:00
=============================================================================
Entries marked with a 'T' under the 'AD' column have been auto-discovered.
| Label | Description |
|---|---|
Mep Information |
|
Md-index |
Displays the MD index of the domain |
Direction |
Displays the direction of OAMPDU transmission |
Ma-index |
Displays the MA index of the association |
Admin |
Displays the administrative status of the MEP |
MepId |
Displays the MEP identifier |
CCM-Enable |
Displays the status of the CCM (enabled or disabled) |
IfIndex |
Displays the index of the interface |
PrimaryVid |
Displays the identifier of the primary VLAN |
FngState |
Indicates the different states of the Fault Notification Generator |
LowestDefectPri |
Displays the lowest priority defect (a configured value) that is allowed to generate a fault alarm |
HighestDefect |
Identifies the highest defect that is present (for example, if defRDICCM and defXconCCM are present, the highest defect is defXconCCM) |
Defect Flags |
Displays the number of defect flags |
Mac Address |
Displays the MAC address of the MEP |
CcmLtmPriority |
Displays the priority value transmitted in the linktrace messages (LTM)s and CCMs for this MEP. The MEP must be configured on a VLAN. |
CcmTx |
Displays the number of Continuity Check Messages (CCM) sent. The count is taken from the last polling interval (every 10 s). |
CcmSequenceErr |
Displays the number of CCM errors |
Eth-1DM Threshold |
Displays the one-way-delay threshold value |
Eth-Ais |
Displays the state of the ETH-AIS test (enabled or disabled) |
Eth-Test |
Displays the state of the ETH-Test (enabled or disabled) |
CcmLastFailure Frame |
Displays the frame that caused the last CCM failure |
XconCcmFailure Frame |
Displays the frame that caused the XconCCMFailure |
Mep Loopback Information |
|
LbRxReply |
Displays the number of received loopback (LB) replies |
LbRxBadOrder |
Displays the number of received loopback messages that are in a bad order |
LbRxBadMsdu |
Displays the number of loopback replies that have been received with the wrong destination MAC address (MSDU = MAC Service Data Unit) |
LbTxReply |
Displays the number of loopback replies transmitted out this MEP |
LbTxReply (Total) |
Displays the total number of LBRs (loopback replies) transmitted from this MEP |
LbTxReplyNoTLV |
Displays the number of LBRs (loopback replies) transmitted from this MEP with no TLV. Because only LBMs with no TLVs are used for throughput testing, the LbTxReply (Total), LbTxReplyNoTLV, and LbTxReplyWithTLV counters can help debug problems if throughput testing is not working |
LbTxReplyWithTLV |
Displays the number of LBRs (loopback replies) transmitted from this MEP with TLV |
LbSequence |
Displays the sequence number in the loopback message |
LbNextSequence |
Displays the next loopback sequence |
LbStatus |
Displays the loopback status as True or False: True — loopback is in progress False — no loopback is in progress |
LbResultOk |
Displays the result of the loopback test |
DestIsMepId |
Identifies whether the destination interface has a MEP-ID (true or false) |
DestMepId |
Displays the MEP-ID of the destination interface |
DestMac |
Displays the MAC address of the destination interface |
SendCount |
Indicates the number of loopback messages sent |
VlanDropEnable |
Identifies whether the VLAN drop is enabled (true or false) |
VlanPriority |
Displays the VLAN priority |
Data TLV |
Displays the data TLV information |
Mep Linktrace Message Information |
|
LtRxUnexplained |
Displays the number of unexplained linktrace messages (LTM) that have been received |
LtNextSequence |
Displays the sequence number of the next linktrace message |
LtStatus |
Displays the status of the linktrace |
LtResult |
Displays the result of the linktrace |
TargIsMepId |
Identifies whether the target interface has a MEP-ID (true or false) |
TargMepId |
Displays the MEP-ID of the target interface |
TargMac |
Displays the MAC address of the target interface |
TTL |
Displays the TTL value |
EgressId |
Displays the egress ID of the linktrace message |
SequenceNum |
Displays the sequence number of the linktrace message |
LtFlags |
Displays the linktrace flags |
Mep Linktrace Replies |
|
SequenceNum |
Displays the sequence number returned by a previous transmit linktrace message, indicating which linktrace message response is returned |
ReceiveOrder |
Displays the order in which the linktrace initiator received the linktrace replies |
Ttl |
Displays the TTL field value for a returned linktrace reply |
Forwarded |
Indicates whether the linktrace message was forwarded by the responding MEP |
LastEgressId |
Displays the last egress identifier returned in the linktrace reply egress identifier TLV of the linktrace reply The last egress identifier identifies the MEP linktrace initiator that initiated, or the linktrace responder that forwarded, the linktrace message for which this linktrace reply is the response. This is the same value as the egress identifier TLV of that linktrace message. |
TerminalMep |
Indicates whether the forwarded linktrace message reached a MEP enclosing its MA |
NextEgressId |
Displays the next egress identifier returned in the linktrace reply egress identifier TLV of the linktrace reply. The next egress identifier identifies the linktrace responder that transmitted this linktrace reply and can forward the linktrace message to the next hop. This is the same value as the egress identifier TLV of the forwarded linktrace message, if any. |
Relay |
Displays the value returned in the Relay Action field |
ChassisIdSubType |
Displays the format of the chassis ID returned in the Sender ID TLV of the linktrace reply, if any. This value is meaningless if the chassis ID has a length of 0 |
ChassisId |
Displays the chassis ID returned in the Sender ID TLV of the linktrace reply, if any. The format is determined by the value of the ChassisIdSubType. |
ManAddressDomain |
Displays the TDomain that identifies the type and format of the related ManAddress, used to access the SNMP agent of the system transmitting the linktrace reply Received in the linktrace reply Sender ID TLV from that system |
ManAddress |
Displays the TAddress that can be used to access the SNMP agent of the system transmitting the CCM Received in the CCM Sender ID TLV from that system |
IngressMac |
Displays the MAC address returned in the ingress MAC address field |
Ingress Action |
Displays the value returned in the Ingress Action field of the linktrace message |
IngressPortIdSubType |
Displays the format of the ingress port ID |
IngressPortId |
Displays the ingress port ID; the format is determined by the value of the IngressPortIdSubType |
EgressMac |
Displays the MAC address returned in the egress MAC address field |
Egress Action |
Displays the value returned in the Egress Action field of the linktrace message |
EgressPortIdSubType |
Displays the format of the egress port ID |
EgressPortId |
Displays the egress port ID; the format is determined by the value of the EgressPortIDSubType |
Org Specific TLV |
Displays all organization-specific TLVs returned in the linktrace reply, if any Includes all octets including and following the TLV length field of each TLV, concatenated |
Eth-Test |
|
Peer Mac Addr |
Displays the MAC address of the peer (remote) entity |
FrameCount |
Displays the number of test frames sent between the MEP and the peer entity |
ByteCount |
Displays the number of bytes sent between the MEP and the peer entity |
Current ErrBits |
Displays the number of bit errors in the current test |
Current CrcErrs |
Displays the number of CRC errors in the current test |
Accumulate ErrBits |
Displays the accumulated number of bit errors in the current test |
Accumulate CrcErrs |
Displays the accumulated number of CRC errors in the current test |
Delay Measurement Test |
|
Peer Mac Addr |
Displays the MAC address of the peer (remote) entity |
Delay (us) |
Displays the measured delay (in microseconds) for the DM test |
Delay Variation (us) |
Displays the measured delay variation (in microseconds) for the DV test |
A:Dut-A>config>port>ethernet# show eth-cfm mep 1 domain 1 association 1 eth-
bandwidth-notification
===============================================================================
Eth-Cfm MEP Configuration Information
===============================================================================
Md-index         : 1                        Direction         : Down
Ma-index         : 1                        Admin             : Enabled
MepId            : 1                        CCM-Enable        : Enabled
Port             : 1/1/5                    VLAN              : 0
Description      : (Not Specified)
FngAlarmTime     : 0                        FngResetTime      : 0
FngState         : fngReset                 ControlMep        : False
LowestDefectPri  : macRemErrXcon            HighestDefect     : none
Defect Flags     : None
Mac Address      : d0:99:d5:80:51:a6
                                            CcmPaddingSize    : 0 octets
CcmTx            : 169                      CcmSequenceErr    : 0
CcmIgnoreTLVs    : (Not Specified)
Fault Propagation: disabled
MA-CcmInterval   : 1                        MA-CcmHoldTime    : 0ms
MA-Primary-Vid   : Disabled
                                            MD-Level          : 0
Eth-Ais          : Disabled
Eth-Ais Tx defCCM: allDef
Eth-BNM Receive  : Enabled                  Eth-BNM Rx Pacing : 5
Redundancy:
    MC-LAG State : n/a
CcmLastFailure Frame:
    None
XconCcmFailure Frame:
    None
| Label | Description |
|---|---|
Md-index |
Displays the MD index of the domain |
Direction |
Displays the direction of OAM PDU transmission |
Ma-index |
Displays the MA index of the association |
Admin |
Displays the administrative status of the MEP |
MepId |
Displays the MEP ID |
CCM-Enable |
Displays the status of the CCM (enabled or disabled) |
Port |
Displays the port number |
VLAN |
Displays the configured VLAN on the MEP |
Description |
Displays the description |
FngAlarmTime |
Displays the fault alarm time |
FngResetTime |
Displays the fault alarm reset time |
FngState |
Displays the different states of the Fault Notification Generator |
LowestDefectPri |
Displays the lowest priority defect (a configured value) that is allowed to generate a fault alarm |
HighestDefect |
Displays the highest defect that is present (for example, if defRDICCM and defXconCCM are present, the highest defect is defXconCCM) |
Defect Flags |
Displays the number of defect flags |
Mac Address |
Displays the MAC address of the MEP |
CcmTx |
Displays the total number of CCM transmitted |
CcmPaddingSize |
Displays the number of octets used to pad a CCM packet |
CcmSequenceErr |
Displays the total number of out-of-sequence CCMs received |
Fault Propagation |
Displays the fault propagation configuration for the MEP |
MA-CcmInterval |
Displays the CCM transmission interval for all MEPs in the association |
MA-CcmHoldTime |
Displays the CCM hold time for all MEPs in the association |
MD-Level |
Displays the MD level |
Eth-Ais |
Displays the state of the ETH-AIS test (enabled or disabled) |
Eth-BNM Receive |
Displays whether ETH-BN receive is enabled or disabled |
Eth-BNM Rx Pacing |
Displays the ETH-BN receive update pacing interval time |
MC-LAG State |
Displays the MC-LAG state |
CcmLastFailure Frame |
Displays the frame that caused the last CCM failure |
XconCcmFailure Frame |
Displays the frame that caused the XconCCMFailure |
mip
Syntax
mip
Context
show>eth-cfm
Platforms
Supported on all 7210 SAS platforms as described in this document, including platforms configured in the access-uplink operating mode
Description
This command displays SAPs/bindings provisioned for allowing the default MIP creation.
Output
The following output is an example of MIP information.
Sample output*A:node-1# show eth-cfm mip
==========================================================================
CFM SAP MIP Table
==========================================================================
Sap Mip-Enabled Mip Mac Address
--------------------------------------------------------------------------
1/1/1:1.1 yes Not Configured
==========================================================================
==========================================================================
CFM SDP MIP Table
==========================================================================
Sdp Mip-Enabled Mip Mac Address
--------------------------------------------------------------------------
No Matching Entries
statistics
Syntax
statistics
Context
show>eth-cfm
Platforms
Supported on all 7210 SAS platforms as described in this document, including platforms configured in the access-uplink operating mode
Description
This command displays the ETH-CFM statistics counters.
Output
The following output is an example of ETH-CFM statistics information.
Sample output# show eth-cfm system-config
===============================================================================
CFM System Configuration
===============================================================================
Redundancy
MC-LAG Standby MEP Shutdown: true
MC-LAG Hold-Timer : 1 second(s)
Synthetic Loss Measurement
Inactivity Timer : 100 second(s)
===============================================================================
system-config
Syntax
system-config
Context
show>eth-cfm
Platforms
Supported on all 7210 SAS platforms as described in this document, including platforms configured in the access-uplink operating mode
Description
This command shows various system level configuration parameters. These global eth-cfm commands are those which are configured directly under the config>eth-cfm context.
Output
The following output is an example of ETH-CFM system configuration information.
Sample output# show eth-cfm system-config
===============================================================================
CFM System Configuration
===============================================================================
Redundancy
MC-LAG Standby MEP Shutdown: true
MC-LAG Hold-Timer : 1 second(s)
Synthetic Loss Measurement
Inactivity Timer : 100 second(s)
===============================================================================
ldp-treetrace
Syntax
ldp-treetrace [prefix ip-prefix/mask] [detail]
Context
show>test-oam
Platforms
7210 SAS-T, 7210 SAS-Mxp, 7210 SAS-Sx/S 1/10GE (standalone and standalone-VC), 7210 SAS-Sx 10/100GE, 7210 SAS-R6, and 7210 SAS-R12
Description
This command displays OAM LDP treetrace information.
Parameters
- prefix ip-prefix/mask
Specifies the address prefix and subnet mask of the destination node.
- detail
Displays detailed information.
Output
The following output is an example of OAM LDP treetrace information.
Sample output*A:ALA-48# show test-oam ldp-treetrace
Admin State : Up Discovery State : Done
Discovery-intvl (min) : 60 Probe-intvl (min) : 2
Probe-timeout (min) : 1 Probe-retry : 3
Trace-timeout (sec) : 60 Trace-retry : 3
Max-TTL : 30 Max-path : 128
Forwarding-class (fc) : be Profile : Out
Total Fecs : 400 Discovered Fecs : 400
Last Discovery Start : 12/19/2006 05:10:14
Last Discovery End : 12/19/2006 05:12:02
Last Discovery Duration : 00h01m48s
Policy1 : policy-1
Policy2 : policy-2
*A:ALA-48# show test-oam ldp-treetrace detail
Admin State : Up Discovery State : Done
Discovery-intvl (min) : 60 Probe-intvl (min) : 2
Probe-timeout (min) : 1 Probe-retry : 3
Trace-timeout (sec) : 60 Trace-retry : 3
Max-TTL : 30 Max-path : 128
Forwarding-class (fc) : be Profile : Out
Total Fecs : 400 Discovered Fecs : 400
Last Discovery Start : 12/19/2006 05:10:14
Last Discovery End : 12/19/2006 05:12:02
Last Discovery Duration : 00h01m48s
Policy1 : policy-1
Policy2 : policy-2
===============================================================================
Prefix (FEC) Info
===============================================================================
Prefix Path Last Probe Discov Discov
Num Discovered State State Status
-------------------------------------------------------------------------------
10.11.11.1/32 54 12/19/2006 05:10:15 OK Done OK
10.11.11.2/32 54 12/19/2006 05:10:15 OK Done OK
10.11.11.3/32 54 12/19/2006 05:10:15 OK Done OK
…………
10.14.14.95/32 72 12/19/2006 05:11:13 OK Done OK
10.14.14.96/32 72 12/19/2006 05:11:13 OK Done OK
10.14.14.97/32 72 12/19/2006 05:11:15 OK Done OK
10.14.14.98/32 72 12/19/2006 05:11:15 OK Done OK
10.14.14.99/32 72 12/19/2006 05:11:18 OK Done OK
10.14.14.100/32 72 12/19/2006 05:11:20 OK Done OK
===============================================================================
Legend: uP - unexplored paths, tO - trace request timed out
mH - max hop exceeded, mP - max path exceeded
nR - no internal resource
*A:ALA-48# show test-oam ldp-treetrace prefix 10.12.12.10/32
Discovery State : Done Last Discovered : 12/19/2006 05:11:02
Discovery Status : ' OK '
Discovered Paths : 54 Failed Hops : 0
Probe State : OK Failed Probes : 0
*A:ALA-48# show test-oam ldp-treetrace prefix 10.12.12.10/32 detail
Discovery State : Done Last Discovered : 12/19/2006 05:11:02
Discovery Status : ' OK '
Discovered Paths : 54 Failed Hops : 0
Probe State : OK Failed Probes : 0
===============================================================================
Discovered Paths
===============================================================================
PathDest Egr-NextHop Remote-RtrAddr Discovery-time
DiscoveryTtl ProbeState ProbeTmOutCnt RtnCode
-------------------------------------------------------------------------------
127.1.0.5 10.10.1.2 10.12.12.10 12/19/2006 05:11:01
7 OK 0 EgressRtr
127.1.0.9 10.10.1.2 10.12.12.10 12/19/2006 05:11:01
7 OK 0 EgressRtr
127.1.0.15 10.10.1.2 10.12.12.10 12/19/2006 05:11:01
7 OK 0 EgressRtr
127.1.0.19 10.10.1.2 10.12.12.10 12/19/2006 05:11:01
7 OK 0 EgressRtr
127.1.0.24 10.10.1.2 10.12.12.10 12/19/2006 05:11:01
7 OK 0 EgressRtr
127.1.0.28 10.10.1.2 10.12.12.10 12/19/2006 05:11:01
……………..
127.1.0.252 10.10.1.2 10.12.12.10 12/19/2006 05:11:01
7 OK 0 EgressRtr
127.1.0.255 10.10.1.2 10.12.12.10 12/19/2006 05:11:01
7 OK 0 EgressRtr
===============================================================================
*A:ALA-48#
twamp
Syntax
twamp
Context
show>test-oam
Platforms
Supported on all 7210 SAS platforms as described in this document, including platforms configured in the access-uplink operating mode
Description
Commands in this context request TWAMP information.
twamp-light
Syntax
twamp-light
Context
show>test-oam>twamp
Platforms
Supported on all 7210 SAS platforms as described in this document, including platforms configured in the access-uplink operating mode
Description
Commands in this context request TWAMP Light information.
reflectors
Syntax
reflectors
Context
show>test-oam>twamp>twamp-light
Platforms
Supported on all 7210 SAS platforms as described in this document, including platforms configured in the access-uplink operating mode
Description
This command displays TWAMP Light reflector information.
Output
The following output is an example of OAM TWAMP light information, and Output fields: TWAMP Light reflectors describes the output fields.
Sample outputshow test-oam twamp twamp-light reflectors
=======================================================================
TWAMP-Light Reflectors
=======================================================================
Router/VPRN Admin UDP Port Prefixes Frames Rx Frames Tx
-----------------------------------------------------------------------
Base Up 15000 1 0 0
500 Up 15000 2 6340 6340
-----------------------------------------------------------------------
No. of TWAMP-Light Reflectors: 2
=======================================================================
| Label | Description |
|---|---|
TWAMP Light Reflector |
|
Router/VPRN |
The TWAMP Light clients |
Admin |
Displays one of the following: Up—the server or prefix is administratively enabled (no shutdown) in configuration Down—the server or prefix is administratively disabled (shutdown) in configuration |
UDP Port |
The UDP port number used |
Prefixes |
The time since the server process was started, measured in days (d), hours, minutes, and seconds |
Frames Rx |
The total number of frames received from session senders |
Frames Tx |
The total number of frames sent to session senders |
server
Syntax
server all
server prefix ip-prefix/mask
server
Context
show>test-oam>twamp
Platforms
Supported on all 7210 SAS platforms as described in this document, including platforms configured in the access-uplink operating mode
Description
This command displays information about the TWAMP server. It displays summary information for the ip-prefix in use.
Parameters
- all
Specifies to display all information about the TWAMP server.
- ip-prefix/mask
Specifies the destination address of the static route and the prefix length.
Output
The following outputs are examples of TWAMP server information, and Output fields: TWAMP server describes the output fields.
Sample output*A:Dut-G>show>test-oam# twamp server
===============================================================================
TWAMP Server
===============================================================================
Admin State : Down Operational State : Down
Up Time : 0d 00:00:00
Current Connections : 0 Max Connections : 8
Connections Rejected : 0 Inactivity Time Out : 900 seconds
Current Sessions : 0 Max Sessions : 8
Sessions Rejected : 0 Sessions Aborted : 0
Sessions Completed : 0
Test Packets Rx : 0 Test Packets Tx : 0
===============================================================================
===============================================================================
TWAMP Server Prefix Summary
===============================================================================
Prefix Current Current Description
Connections Sessions
-------------------------------------------------------------------------------
-------------------------------------------------------------------------------
No. of TWAMP Server Prefixes: 0
===============================================================================
*A:Dut-G>show>test-oam#
The following output is an example of all TWAMP server information.
7210SAS# show  test-oam twamp server all

===============================================================================
TWAMP Server
===============================================================================
Admin State          : Up                  Operational State   : Up
Up Time              : 0d 08:17:34
Current Connections  : 0                   Max Connections     : 16
Connections Rejected : 0                   Inactivity Time Out : 900 seconds
Current Sessions     : 0                   Max Sessions        : 16
Sessions Rejected    : 0                   Sessions Aborted    : 0
Sessions Completed   : 0
Test Packets Rx      : 0                   Test Packets Tx     : 0
===============================================================================

===============================================================================
TWAMP Server Prefix 10.1.1.0/24
===============================================================================
Description          : (Not Specified)
Current Connections  : 0                   Max Connections     : 16
Connections Rejected : 0
Current Sessions     : 0                   Max Sessions        : 16
Sessions Rejected    : 0                   Sessions Aborted    : 0
Sessions Completed   : 0
Test Packets Rx      : 0                   Test Packets Tx     : 0
===============================================================================

===============================================================================
Connection information for TWAMP server prefix 10.1.1.0/24
===============================================================================
Client          State      Curr Sessions  Sessions Rejected  Sessions Completed
                           Idle Time (s)    Test Packets Rx     Test Packets Tx
-------------------------------------------------------------------------------
-------------------------------------------------------------------------------
No. of TWAMP Server Connections for Prefix 10.1.1.0/24: 0
===============================================================================

===============================================================================
TWAMP Server Prefix 10.1.1.0/24
===============================================================================
Description          : (Not Specified)
Current Connections  : 0                   Max Connections     : 16
Connections Rejected : 0
Current Sessions     : 0                   Max Sessions        : 16
Sessions Rejected    : 0                   Sessions Aborted    : 0
Sessions Completed   : 0
Test Packets Rx      : 0                   Test Packets Tx     : 0
===============================================================================

===============================================================================
Connection information for TWAMP server prefix 10.1.1.0/24
===============================================================================
Client          State      Curr Sessions  Sessions Rejected  Sessions Completed
                           Idle Time (s)    Test Packets Rx     Test Packets Tx
-------------------------------------------------------------------------------
-------------------------------------------------------------------------------
No. of TWAMP Server Connections for Prefix 10.1.1.0/24: 0
===============================================================================
===============================================================================
No. of TWAMP Server Prefixes: 2
===============================================================================
The following output is an example of TWAMP server prefix information.
*A:7210SAS# show test-oam twamp server  prefix 10.1.1.0/24

===============================================================================
TWAMP Server Prefix 10.1.1.0/24
===============================================================================
Description          : (Not Specified)
Current Connections  : 0                   Max Connections     : 16
Connections Rejected : 0
Current Sessions     : 0                   Max Sessions        : 16
Sessions Rejected    : 0                   Sessions Aborted    : 0
Sessions Completed   : 0
Test Packets Rx      : 0                   Test Packets Tx     : 0
===============================================================================

===============================================================================
Connection information for TWAMP server prefix 10.1.1.0/24
===============================================================================
Client          State      Curr Sessions  Sessions Rejected  Sessions Completed
                           Idle Time (s)    Test Packets Rx     Test Packets Tx
-------------------------------------------------------------------------------
-------------------------------------------------------------------------------
No. of TWAMP Server Connections for Prefix 10.1.1.0/24: 0
===============================================================================
| Label | Description |
|---|---|
Admin State |
Displays one of the following: Up — The server or prefix is administratively enabled (no shutdown) in configuration. Down — The server or prefix is administratively disabled (shutdown) in configuration. |
Operational State |
Displays one of the following: Up — The server or prefix is operationally enabled. Down — The server or prefix is operationally disabled. |
Up Time |
Displays the time since the server process was started, measured in days (d), hours, minutes, and seconds. |
Current Connections |
Displays the total number of currently connected clients. |
Max Connections |
Displays the maximum number of connected clients. |
Connections Rejected |
Displays the number of connection rejections. |
Inactivity Timeout |
Displays the configured inactivity timeout for all TWAMP-control connections (inactivity-timeout). |
Current Sessions |
Displays the number of current sessions. |
Max Sessions |
Displays the maximum number of sessions. |
Sessions Rejected |
Displays the number of rejected sessions for the TWAMP client. |
Sessions Aborted |
Displays the number of manually aborted sessions for the TWAMP client. |
Sessions Completed |
Displays the number of completed sessions for the TWAMP client. |
Test Packets Rx |
Displays the number of test packets received. |
Test Packets Tx |
Displays the number of test packets transmitted. |
Description |
Displays the configured description of the TWAMP server. |
Connection information for TWAMP server prefix |
Displays the IP address prefix of a TWAMP server. |
Client |
Displays the IP address of the TWAMP client. |
State |
Displays the operational state of the TWAMP client. |
Curr Sessions |
Displays the number of current sessions for the TWAMP client. |
Idle Time (s) |
Displays the total idle time, in seconds, of the TWAMP client. |
No. of Conns for Prefix |
Displays the total number of connections for the TWAMP server with the displayed IP address prefix. |
No. of TWAMP Server Prefixes |
Displays the total number of displayed TWAMP server IP address prefixes. |
testhead-profile
Syntax
testhead-profile profile-id
Context
show>test-oam
Platforms
Supported on all 7210 SAS platforms as described in this document, including platforms configured in the access-uplink operating mode
Description
This command specifies the testhead profile ID to use with this run or session of testhead invocation. The testhead profile must be configure before using the commands under config> test-oam> testhead-profile context.
Output
The following output is an example of testhead profile information, and Output fields: test OAM testhead profile describes the output fields.
Sample output*A:7210SAS>config>test-oam># show test-oam testhead-profile 1
===============================================================================
Y.1564 Testhead Profile
===============================================================================
Description : Testhead_Profile_1
Profile Id : 1 Frame Size : 512
CIR Configured : 100 CIR Operational : 96
PIR Configured : 200 PIR Operational : 200
CIR Rule : max Ref. Count : 0
InPrf Dot1p : 2 OutPrf Dot1p : 4
Duration Hrs : 0
Duration Mins : 3
Duration Secs : 0
-------------------------------------------------------------------------------
Acceptance Criteria Id 1
-------------------------------------------------------------------------------
Loss TH : 0.000100 Jitter TH : 100
InProf Loss TH : 0.000100 InProf Jitter TH : 100
OutProf Loss TH : 0.000100 OutProf Jitter TH : 100
Latency TH : 100 Ref. Count : 0
InProf Latency TH : 100 CIR TH : 1000
OutProf Latency TH : 100 PIR TH : 200
-------------------------------------------------------------------------------
Frame Payload Id 1
-------------------------------------------------------------------------------
Payload Type : tcp-ipv4
Description : Frame_Payload_1
Dst Mac : 00:00:00:00:00:02
Src Mac : 00:00:00:00:00:01
Vlan Tag 1 : Not configured
Vlan Tag 2 : Not configured
Ethertype : 0x0800 DSCP : af11
TOS : 8 TTL : 64
Src. IP : 10.1.1.1 Dst. IP : 10.2.2.2
L4 Dst Port : 50 L4 Src Port : 40
Protocol : 6 Ref. Count : 0
Data Pattern : a1b2c3d4e5f6
===============================================================================
*A:7210SAS>config>test-oam>#
| Label | Description |
|---|---|
Description |
Displays the description configured by the user for the test. |
Profile Id |
Displays the profile identifier. |
CIR Configured |
Displays the value of the CIR configured. |
PIR Configured |
Displays the value of the PIR configured. |
Frame Size |
Displays the size of the frame. |
CIR Operational |
Displays the value of the CIR operational rate configured. |
PIR Operational |
Displays the value of the PIR operational rate configured. |
CIR Rule |
Displays the adaptation rule configured by the user. |
InPrf Dot1p |
Displays the dot1p value used to identify green or in-profile packets. |
Ref. Count |
Displays the total number of testhead (completed or running) sessions pointing to a profile or acceptance criteria or a frame payload. |
OutPrf Dot1p |
Displays the dot1p value used to identify green or out-of-profile packets. |
Duration Hrs, mins, and secs |
Displays the test duration in hours, minutes, and seconds. |
Loss TH |
Displays the user configured loss threshold value for comparison with measured value. |
Jitter TH |
Displays the user configured jitter threshold value for comparison with measured value. |
InProf Loss TH |
Displays the user configured in-profile loss threshold value for comparison with measured value. |
OutProf Loss TH |
Displays the user configured out-of-profile loss threshold value for comparison with measured value. |
Latency TH |
Displays the user configured latency threshold value for comparison with measured value. |
InProf Latency TH |
Displays the user configured in-profile latency threshold value for comparison with measured value. |
OutProf Latency TH |
Displays the user configured out-of-profile latency threshold value for comparison with measured value. |
InProf Jitter TH |
Displays the user configured in-profile jitter threshold value for comparison with measured value. |
OutProf Jitter TH |
Displays the user configured out-of-profile jitter threshold value for comparison with measured value. |
CIR TH |
Displays the user configured CIR threshold value for comparison with measured value. |
PIR TH |
Displays the user configured PIR threshold value for comparison with measured value. |
Payload Type |
Identifies the type of the payload. |
Dst Mac |
Displays the value of destination MAC configured by the user to use in the frame generated by the testhead tool |
Src Mac |
Displays the value of source MAC configured by the user to use in the frame generated by the testhead tool |
Vlan Tag 1 |
Displays the values of the outermost vlan-tag configured by the user to use in the frame generated by the testhead tool. |
Vlan Tag 2 |
Displays the values of the second vlan-tag configured by the user to use in the frame generated by the testhead tool. |
Ethertype |
Displays the values of the ethertype configured by the user to use in the frame generated by the testhead tool. |
TOS |
Displays the values of the IP TOS (Type of Service) configured by the user to use in the frame generated by the testhead tool. |
Src. IP |
Displays the values of the source IPv4 address configured by the user to use in the frame generated by the testhead tool. |
L4 Dst Port |
Displays the values of the TCP header configured by the user to use in the frame generated by the testhead tool. |
Protocol |
Displays the values of the IP protocol value configured by the user to use in the frame generated by the testhead tool. |
Data Pattern |
Displays the values of the data pattern configured by the user to use in the frame generated by the testhead tool. |
DSCP |
Displays the values of the DSCP configured by the user to use in the frame generated by the testhead tool. |
TTL |
Displays the values of the IP TTL (Time-to-Live) value configured by the user to use in the frame generated by the testhead tool. |
Dst. IP |
Displays the values of the destination IPv4 address configured by the user to use in the frame generated by the testhead tool. |
L4 Src Port |
Displays the values of the source port configured by the user to use in the frame generated by the testhead tool. |
testhead
Syntax
testhead test-name owner test-owner
Context
show
Platforms
Supported on all 7210 SAS platforms as described in this document, including platforms configured in the access-uplink operating mode
Description
This command displays the testhead test identified by the test name and owner.
Parameters
- test-name
Name of the SAA test. The test name must already be configured in the config>saa>test context.
- owner test-owner
Specifies the owner of an SAA operation up to 32 characters.
Output
The following output is an example of testhead information, and Output fields: testhead describes the output fields.
Sample output*A:7210SAS# show testhead test-me owner owner-me
===============================================================================
Y.1564 Testhead Session
===============================================================================
Owner : owner-me
Test : test-me
Profile Id : 1 SAP : 1/1/2:100
Accept. Crit. Id : 0 Completed : Yes
Frame Payload Id : 1 Stopped : No
Frame Payload Type : tcp-ipv4 FC : be
Color Aware Test : Yes
Start Time : 08/08/2001 19:37:11
End Time : 08/08/2001 19:40:16
Total time taken : 0d 00:03:05
-------------------------------------------------------------------------------
Latency Results
-------------------------------------------------------------------------------
(total pkts in us): Min Max Average Jitter
Roundtrip : 0 0 0 0
(OutPrf pkts in us): Min Max Average Jitter
Roundtrip : 0 0 0 0
(InPrf pkts in us): Min Max Average Jitter
Roundtrip : 0 0 0 0
-------------------------------------------------------------------------------
Packet Count
-------------------------------------------------------------------------------
Total Injected : 42273637
Total Received : 0
OutPrf Injected : 16898179
OutPrf Received : 0
InPrf Injected : 25375450
InPrf Received : 0
-------------------------------------------------------------------------------
Test Compliance Report
-------------------------------------------------------------------------------
Throughput Configd : 962388
Throughput Oper : 962384
Throughput Measurd : 0
PIR Tput Threshld : Not configured
PIR Tput Meas : 0
CIR Tput Threshld : Not configured
CIR Tput Meas : 0
FLR Configured : None
FLR Measurd : Not Applicable
FLR Acceptance : Fail
OutPrf FLR Conf : None
OutPrf FLR Meas : Not Applicable
OutPrf FLR Acep : Not Applicable
InPrf FLR Conf : None
InPrf FLR Meas : Not Applicable
InPrf FLR Acep : Not Applicable
Latency Configd(us): None
Latency Measurd(us): None
Latency Acceptance : Not Applicable
OutPrf Lat Conf(us): None
OutPrf Lat Meas(us): None
OutPrf Lat Acep : Not Applicable
InPrf Lat Conf(us) : None
InPrf Lat Meas(us) : None
InPrf Lat Acep : Not Applicable
Jitter Configd(us) : None
Jitter Measurd(us) : None
Jitter Acceptance : Not Applicable
OutPrf Jit Conf(us): None
OutPrf Jit Meas(us): None
OutPrf Jit Acep : Not Applicable
InPrf Jit Conf(us) : None
InPrf Jit Meas(us) : None
InPrf Jit Acep : Not Applicable
Total Pkts. Tx. : 13 Latency Pkts. Tx. : 8
OutPrf Latency Pkt*: 0 InPrf Latency Pkt*: 0
Total Tx. Fail : 0 =============================================================
==================
*A:7210SAS# show testhead test-me owner owner-me
| Label | Description |
|---|---|
Owner |
Displays the owner of the test. |
Name |
Displays the name of the test. |
Description |
Displays the description for the test type. |
Profile Id |
Displays the associated profile ID. |
Accept. Crit. Id |
Displays the test acceptance criteria ID to be used by the testhead OAM tool to declare the PASS/FAIL result at the completion of the test. |
Frame Payload Id |
Displays frame payload ID, that determines the frame content of the frames generated by the tool. |
Frame Payload Type |
Displays the type of frame payload to be used in frames generated by testhead tool. |
Color Aware Test |
Displays if color aware tests need to be executed. |
SAP |
Displays the SAP ID configured. |
Completed |
Displays if the test has been completed. |
Stopped |
Displays if the test has been stopped. |
FC |
Displays the forwarding class (FC) to use to send the frames generated by the testhead tool. |
Start Time |
Displays the start time of the test. |
End Time |
Displays the end time of the test. |
Total time taken |
Displays the total time taken to execute the test. |
total pkts in us |
Displays the total packets in microseconds. |
OutPrf pkts in us |
Displays the out-of-profile packets in microseconds. |
InPrf pkts in us |
Displays the in-profile packets in microseconds. |
Total Injected |
Displays the running count of total injected packets, including marker packets. |
Total Received |
Displays the running count of total received packets, including marker packets. |
OutPrf Injected |
Displays the running count of total out-of-profile packets, excluding marker packets. |
OutPrf Received |
Displays the running count of total out-of-profile packets received, including marker packets. |
InPrf Injected |
Displays the running count of total in-profile packets, excluding marker packets. |
InPrf Received |
Displays the running count of total in-profile packets received, including marker packets. |
Throughput Configd |
Displays the CIR Throughput rate Threshold Configured (in Kbps). |
Throughput Oper |
Displays the operational rate used for the configured rate. Operational rate is arrived considering the adaptation rule configured by the user and supported hardware rate. |
Throughput Measurd |
Displays the CIR Throughput Measured Value (in Kbps). |
PIR Tput Threshld |
Displays the PIR Throughput rate Threshold Configured (in Kbps). |
PIR Tput Meas |
Displays the PIR Throughput rate Measured Value (in Kbps). |
FLR Configured |
Displays the Frame Loss Ratio Threshold Configured (in-profile). |
FLR Measurd |
Displays the Frame Loss Ratio Measured (in-profile). |
FLR Acceptance |
Displays Pass, Fail, or Not Applicable. It displays Pass, if the measured value is less than or equal to the configured threshold and displays "Fail" otherwise, and displays "Not Applicable", if the FLR criteria is not used to determine whether the test is in Passed or Failed status. |
OutPrf FLR Conf |
Displays the out-of-profile Frame Loss Ratio configured. |
OutPrf FLR Meas |
Displays the out-of-profile Frame Loss Ratio measured. |
OutPrf FLR Acep |
Displays Pass, Fail, or Not Applicable. It displays Pass, if the measured value is less than or equal to the configured threshold and displays "Fail" otherwise, and displays "Not Applicable", if the out-of-profile FLR criteria is not used to determine whether the test is in Passed or Failed status. |
InPrf FLR Conf |
Displays the in-profile Frame Loss Ratio configured. |
InPrf FLR Meas |
Displays the in-profile Frame Loss Ratio measured. |
InPrf FLR Acep |
Displays Pass, Fail, or Not Applicable. It displays Pass, if the measured value is less than or equal to the configured threshold and displays "Fail" otherwise, and displays "Not Applicable", if the in-profile FLR criteria is not used to determine whether the test is in Passed or Failed status. |
Latency Configd(us) |
Displays the Latency Threshold configured (in microseconds) |
Latency Measurd(us) |
Displays the Average Latency measured (in microseconds) |
Latency Acceptance |
Displays Pass, Fail, or Not Applicable. It displays Pass, if the measured value is less than or equal to the configured threshold and displays "Fail" otherwise, and displays "Not Applicable", if the latency criteria is not used to determine whether the test is in Passed or Failed status. |
OutPrf Lat Conf(us) |
Displays the out-of-profile latency configured. |
OutPrf Lat Meas(us) |
Displays the out-of-profile latency measured. |
OutPrf Lat Acep |
Displays Pass, Fail, or Not Applicable. It displays Pass, if the measured value is less than or equal to the configured threshold and displays "Fail" otherwise, and displays "Not Applicable", if the out-of-profile latency criteria is not used to determine whether the test is in Passed or Failed status. |
InPrf Lat Conf(us) |
Displays the in-profile latency configured. |
InPrf Lat Meas(us) |
Displays the in-profile latency measured. |
InPrf Lat Acep |
Displays Pass, Fail, or Not Applicable. It displays Pass, if the measured value is less than or equal to the configured threshold and displays "Fail" otherwise, and displays "Not Applicable", if the in-profile latency criteria is not used to determine whether the test is in Passed or Failed status. |
Jitter Configd(us) |
Displays the Jitter Threshold Configured (in microseconds). |
Jitter Measurd(us) |
Displays the Jitter Measured (in microseconds). |
Jitter Acceptance |
Displays Pass, Fail, or Not Applicable. It displays Pass, if the measured value is less than or equal to the configured threshold and displays "Fail" otherwise, and displays "Not Applicable", if the jitter criteria is not used to determine whether the test is in Passed or Failed status. |
OutPrf Jit Conf(us) |
Displays the out-of-profile Jitter configured. |
OutPrf Jit Meas(us) |
Displays the out-of-profile Jitter measured. |
OutPrf Jit Acep |
Displays Pass, Fail, or Not Applicable. It displays Pass, if the measured value is less than or equal to the configured threshold and displays "Fail" otherwise, and displays "Not Applicable", if the out-of-profile jitter criteria is not used to determine whether the test is in Passed or Failed status. |
InPrf Jit Conf(us) |
Displays the in-profile Jitter configured. |
InPrf Jit Meas(us) |
Displays the in-profile Jitter measured. |
InPrf Jit Acep |
Displays Pass, Fail, or Not Applicable. It displays Pass, if the measured value is less than or equal to the configured threshold and displays "Fail" otherwise, and displays "Not Applicable", if the in-profile jitter criteria is not used to determine whether the test is in Passed or Failed status. |
Total Pkts. Tx. |
Displays the total number of packets (that is, data and marker) transmitted by the testhead session for the duration of the test. |
OutPrf Latency Pkt* |
Displays the total number of out-of-profile marker packets received by the testhead session for the duration of the test. |
Total Tx. Fail |
Displays the total number of failed transmission attempts by the testhead session for the duration of the test. |
Latency Pkts. Tx |
Displays the total number of marker packets transmitted by the testhead session for the duration of the test. |
InPrf Latency Pkt* |
Displays the total number of in-profile marker packets received by the testhead session for the duration of the test. |
bin-group
Syntax
bin-group [bin-group-number]
Context
show>oam-pm
Platforms
Supported on all 7210 SAS platforms as described in this document, including platforms configured in the access-uplink operating mode
Description
This command displays data for one or all OAM-PM bin groups.
Parameters
- bin-group-number
Specifies an OAM-PM bin group.
Output
The following output is an example of OAM-PM bin group information.
Sample outputshow oam-pm bin-group
-------------------------------------------------------------------------------
Configured Lower Bounds for Delay Measurement (DMM) Tests, in microseconds
-------------------------------------------------------------------------------
Group Description Admin Bin FD(us) FDR(us) IFDV(us)
-------------------------------------------------------------------------------
1 OAM PM default bin group (not* Up 0 0 0 0
1 5000 5000 5000
2 10000 - -
-------------------------------------------------------------------------------
2 Up 0 0 0 0
1 1000 5000 100
2 2000 - 200
3 3000 - 300
4 4000 - 400
5 5000 - 500
6 6000 - 600
7 7000 - 700
8 8000 - 800
9 10000 - 1000
-------------------------------------------------------------------------------
3 Down 0 0 0 0
1 6000 5000 8000
2 10000 10000 10000
3 15000 15000 -
4 22000 - -
-------------------------------------------------------------------------------
10 base Up 0 0 0 0
1 5000 5000 5000
2 10000 10000 10000
-------------------------------------------------------------------------------
-------------------------------------------------------------------------------
* indicates that the corresponding row element may have been truncated.
show oam-pm bin-group 2
-------------------------------------------------------------------------------
Configured Lower Bounds for Delay Measurement (DMM) Tests, in microseconds
-------------------------------------------------------------------------------
Group Description Admin Bin FD(us) FDR(us) IFDV(us)
-------------------------------------------------------------------------------
2 Up 0 0 0 0
1 1000 5000 100
2 2000 - 200
3 3000 - 300
4 4000 - 400
5 5000 - 500
6 6000 - 600
7 7000 - 700
8 8000 - 800
9 10000 - 1000
-------------------------------------------------------------------------------
bin-group-using
Syntax
bin-group-using [bin-group bin-group-number]
Context
show>oam-pm
Platforms
Supported on all 7210 SAS platforms as described in this document, including platforms configured in the access-uplink operating mode
Description
This command displays the list of sessions configured against one or all OAM-PM bin groups.
Parameters
- bin-group-number
Specifies an OAM-PM bin group.
Output
The following output is an example of OAM-PM bin group sessions information.
Sample outputshow oam-pm bin-group-using
=========================================================================
OAM Performance Monitoring Bin Group Configuration for Sessions
=========================================================================
Bin Group Admin Session Session State
-------------------------------------------------------------------------
2 Up eth-vpls-00005 Inact
eth-pm-service-4 Act
-------------------------------------------------------------------------
3 Down eth-epipe-000001 Inact
-------------------------------------------------------------------------
10 Up eth-epipe-00002 Inact
-------------------------------------------------------------------------
=========================================================================
Admin: State of the bin group
Session State: The state of session referencing the bin-group
show oam-pm bin-group-using bin-group 2
=========================================================================
OAM Performance Monitoring Bin Group Configuration for Sessions
=========================================================================
Bin Group Admin Session Session State
-------------------------------------------------------------------------
2 Up eth-vpls-00005 Inact
eth-pm-service-4 Act
-------------------------------------------------------------------------
=========================================================================
Admin: State of the bin group
Session State: The state of session referencing the bin-group
session
Syntax
session session-name [{all | base | bin-group | event-mon | meas-interval}]
Context
show>oam-pm
Platforms
Supported on all 7210 SAS platforms as described in this document, including platforms configured in the access-uplink operating mode
Description
This command displays the configuration and status information for an OAM-PM session.
Parameters
- session-name
Specifies the name of the session. 32 characters maximum.
- all
Specifies all attributes.
- base
Specifies the base configuration option for the session.
- bin-group
Specifies the associated bin group and its attributes.
- event-mon
Specifies configured event monitoring and last TCA information.
- meas-interval
Specifies the associated measured interval and its attributes.
Output
The following output is an example of OAM-PM session information.
Sample outputshow oam-pm session "eth-pm-service-4" all
-------------------------------------------------------------------------------
Basic Session Configuration
-------------------------------------------------------------------------------
Session Name : eth-pm-service-4
Description : (Not Specified)
Test Family : ethernet Session Type : proactive
Bin Group : 2
-------------------------------------------------------------------------------
-------------------------------------------------------------------------------
Ethernet Configuration
-------------------------------------------------------------------------------
Source MEP : 28 Priority : 0
Source Domain : 12 Dest MAC Address : 00:00:00:00:00:30
Source Assoc'n : 4
-------------------------------------------------------------------------------
-------------------------------------------------------------------------------
DMM Test Configuration and Status
-------------------------------------------------------------------------------
Test ID : 10004 Admin State : Up
Oper State : Up Data TLV Size : 1000 octets
On-Demand Duration: Not Applicable On-Demand Remaining: Not Applicable
Interval : 1000 ms
-------------------------------------------------------------------------------
-------------------------------------------------------------------------------
SLM Test Configuration and Status
-------------------------------------------------------------------------------
Test ID : 10004 Admin State : Up
Oper State : Up Data TLV Size : 1000 octets
On-Demand Duration: Not Applicable On-Demand Remaining: Not Applicable
Interval : 100 ms
CHLI Threshold : 4 HLIs Frames Per Delta-T : 10 SLM frames
Consec Delta-Ts : 10 FLR Threshold : 50%
-------------------------------------------------------------------------------
-------------------------------------------------------------------------------
15-mins Measurement Interval Configuration
-------------------------------------------------------------------------------
Duration : 15-mins Intervals Stored : 32
Boundary Type : clock-aligned Clock Offset : 0 seconds
Accounting Policy : none
-------------------------------------------------------------------------------
-------------------------------------------------------------------------------
Configured Lower Bounds for Delay Measurement (DMM) Tests, in microseconds
-------------------------------------------------------------------------------
Group Description Admin Bin FD(us) FDR(us) IFDV(us)
-------------------------------------------------------------------------------
2 Up 0 0 0 0
1 1000 5000 100
2 2000 - 200
3 3000 - 300
4 4000 - 400
5 5000 - 500
6 6000 - 600
7 7000 - 700
8 8000 - 800
9 10000 - 1000
-------------------------------------------------------------------------------
show oam-pm session "eth-pm-service-4" base
-------------------------------------------------------------------------------
Basic Session Configuration
-------------------------------------------------------------------------------
Session Name : eth-pm-service-4
Description : (Not Specified)
Test Family : ethernet Session Type : proactive
Bin Group : 2
-------------------------------------------------------------------------------
-------------------------------------------------------------------------------
Ethernet Configuration
-------------------------------------------------------------------------------
Source MEP : 28 Priority : 0
Source Domain : 12 Dest MAC Address : 00:00:00:00:00:30
Source Assoc'n : 4
-------------------------------------------------------------------------------
-------------------------------------------------------------------------------
DMM Test Configuration and Status
-------------------------------------------------------------------------------
Test ID : 10004 Admin State : Up
Oper State : Up Data TLV Size : 1000 octets
On-Demand Duration: Not Applicable On-Demand Remaining: Not Applicable
Interval : 1000 ms
-------------------------------------------------------------------------------
-------------------------------------------------------------------------------
SLM Test Configuration and Status
-------------------------------------------------------------------------------
Test ID : 10004 Admin State : Up
Oper State : Up Data TLV Size : 1000 octets
On-Demand Duration: Not Applicable On-Demand Remaining: Not Applicable
Interval : 100 ms
CHLI Threshold : 4 HLIs Frames Per Delta-T : 10 SLM frames
Consec Delta-Ts : 10 FLR Threshold : 50%
-------------------------------------------------------------------------------
show oam-pm session "eth-pm-service-4" bin-group
-------------------------------------------------------------------------------
Configured Lower Bounds for Delay Measurement (DMM) Tests, in microseconds
-------------------------------------------------------------------------------
Group Description Admin Bin FD(us) FDR(us) IFDV(us)
-------------------------------------------------------------------------------
2 Up 0 0 0 0
1 1000 5000 100
2 2000 - 200
3 3000 - 300
4 4000 - 400
5 5000 - 500
6 6000 - 600
7 7000 - 700
8 8000 - 800
9 10000 - 1000
-------------------------------------------------------------------------------
show oam-pm session "eth-pm-service-4" meas-interval
-------------------------------------------------------------------------------
15-mins Measurement Interval Configuration
-------------------------------------------------------------------------------
Duration : 15-mins Intervals Stored : 32
Boundary Type : clock-aligned Clock Offset : 0 seconds
Accounting Policy : none
-------------------------------------------------------------------------------
sessions
Syntax
sessions [test-family {ethernet | ip}] [event-mon]
Context
show>oam-pm
Platforms
Supported on all 7210 SAS platforms as described in this document, including platforms configured in the access-uplink operating mode
Description
This command displays a summary of the OAM-PM sessions.
Parameters
- ethernet
Specifies Ethernet sessions only.
- ip
Specifies IP sessions only.
- event-mon
Specifies a summary of all event monitoring information, and the current state for each session.
Output
The following output is an example of summary OAM-PM session information.
Sample outputshow oam-pm sessions
============================================================================
OAM Performance Monitoring Session Summary for the Ethernet Test Family
============================================================================
Session State Bin Group Sess Type Test Types
----------------------------------------------------------------------------
eth-vpls-00005 Inact 2 proactive DMM SLM
eth-epipe-00002 Inact 10 proactive DMM SLM
eth-epipe-000001 Inact 3 proactive DMM
eth-pm-service-4 Act 2 proactive DMM SLM
============================================================================
show oam-pm sessions test-family ethernet
============================================================================
OAM Performance Monitoring Session Summary for the Ethernet Test Family
============================================================================
Session State Bin Group Sess Type Test Types
----------------------------------------------------------------------------
eth-vpls-00005 Inact 2 proactive DMM SLM
eth-epipe-00002 Inact 10 proactive DMM SLM
eth-epipe-000001 Inact 3 proactive DMM
eth-pm-service-4 Act 2 proactive DMM SLM
============================================================================
statistics
Syntax
statistics
Context
show>oam-pm
Platforms
Supported on all 7210 SAS platforms as described in this document, including platforms configured in the access-uplink operating mode
Description
Commands in this context display OAM-PM delay or synthetic loss statistics.
session
Syntax
session session-name
Context
show>oam-pm>statistics
Platforms
Supported on all 7210 SAS platforms as described in this document, including platforms configured in the access-uplink operating mode
Description
This command displays OAM-PM session statistics.
Parameters
- session-name
Specifies the session name. 32 characters maximum.
dmm
Syntax
dmm
Context
show>oam-pm>statistics>session
Platforms
Supported on all 7210 SAS platforms as described in this document, including platforms configured in the access-uplink operating mode
Description
Commands in this context display DMM test statistics.
meas-interval
Syntax
meas-interval raw [{all | bins | summary}]
meas-interval {5-mins | 15-mins | 1-hour | 1-day} interval-number interval-number [{all | bins | summary}]
Context
show>oam-pm>statistics>session>dmm
Platforms
Supported on all 7210 SAS platforms as described in this document, including platforms configured in the access-uplink operating mode
Description
This command displays measured interval statistics for DMM tests in the specified session.
Parameters
- raw
Specifies raw information.
- 5-mins
Specifies information for 5-min intervals.
- 15-mins
Specifies information for 15-min intervals.
- 1-hour
Specifies information for 1-hour intervals.
- 1-day
Specifies information for 1-day intervals.
- interval-number
Specifies the interval number.
- all
Specifies all information for the interval.
- bins
Specifies bin information for the interval.
- summary
Specifies summarized information for the interval.
Output
The following output is an example of DMM measured interval statistics information.
Sample outputshow oam-pm statistics session "eth-pm-service-4" dmm meas-interval 15-
mins all interval-number 2
------------------------------------------------------------------------------
Start (UTC) : 2014/02/01 10:15:00 Status : completed
Elapsed (seconds) : 900 Suspect : no
Frames Sent : 900 Frames Received : 900
------------------------------------------------------------------------------
----------------------------------------------------------------------
Bin Type Direction Minimum (us) Maximum (us) Average (us)
----------------------------------------------------------------------
FD Forward 0 11670 779
FD Backward 0 7076 1746
FD Round Trip 1109 13222 2293
FDR Forward 0 11670 779
FDR Backward 0 7076 1738
FDR Round Trip 0 12104 1178
IFDV Forward 0 10027 489
IFDV Backward 0 5444 742
IFDV Round Trip 0 11853 1088
----------------------------------------------------------------------
---------------------------------------------------------------
Frame Delay (FD) Bin Counts
---------------------------------------------------------------
Bin Lower Bound Forward Backward Round Trip
---------------------------------------------------------------
0 0 us 625 244 0
1 1000 us 194 356 465
2 2000 us 50 153 244
3 3000 us 11 121 119
4 4000 us 10 17 40
5 5000 us 5 6 20
6 6000 us 4 2 5
7 7000 us 0 1 3
8 8000 us 0 0 3
9 10000 us 1 0 1
---------------------------------------------------------------
---------------------------------------------------------------
Frame Delay Range (FDR) Bin Counts
---------------------------------------------------------------
Bin Lower Bound Forward Backward Round Trip
---------------------------------------------------------------
0 0 us 890 891 889
1 5000 us 10 9 11
---------------------------------------------------------------
---------------------------------------------------------------
Inter-Frame Delay Variation (IFDV) Bin Counts
---------------------------------------------------------------
Bin Lower Bound Forward Backward Round Trip
---------------------------------------------------------------
0 0 us 398 255 102
1 100 us 82 88 89
2 200 us 79 57 59
3 300 us 60 63 61
4 400 us 39 37 54
5 500 us 31 24 42
6 600 us 26 30 43
7 700 us 29 20 34
8 800 us 54 47 67
9 1000 us 102 279 349
---------------------------------------------------------------
show oam-pm statistics session "eth-pm-service-4" dmm meas-interval 15-
mins bins interval-number 2
------------------------------------------------------------------------------
Start (UTC) : 2014/02/01 10:30:00 Status : completed
Elapsed (seconds) : 900 Suspect : no
Frames Sent : 900 Frames Received : 900
------------------------------------------------------------------------------
---------------------------------------------------------------
Frame Delay (FD) Bin Counts
---------------------------------------------------------------
Bin Lower Bound Forward Backward Round Trip
---------------------------------------------------------------
0 0 us 699 167 0
1 1000 us 169 312 456
2 2000 us 24 228 274
3 3000 us 3 136 111
4 4000 us 3 48 41
5 5000 us 1 7 10
6 6000 us 1 1 3
7 7000 us 0 1 2
8 8000 us 0 0 3
9 10000 us 0 0 0
---------------------------------------------------------------
---------------------------------------------------------------
Frame Delay Range (FDR) Bin Counts
---------------------------------------------------------------
Bin Lower Bound Forward Backward Round Trip
---------------------------------------------------------------
0 0 us 898 891 892
1 5000 us 2 9 8
---------------------------------------------------------------
---------------------------------------------------------------
Inter-Frame Delay Variation (IFDV) Bin Counts
---------------------------------------------------------------
Bin Lower Bound Forward Backward Round Trip
---------------------------------------------------------------
0 0 us 462 217 107
1 100 us 63 99 80
2 200 us 64 85 71
3 300 us 63 74 53
4 400 us 34 53 45
5 500 us 37 24 50
6 600 us 34 17 41
7 700 us 35 23 57
8 800 us 46 32 60
9 1000 us 62 276 336
---------------------------------------------------------------
show oam-pm statistics session "eth-pm-service-4" dmm meas-interval 15-
mins summary interval-number 2
------------------------------------------------------------------------------
Start (UTC) : 2014/02/01 10:30:00 Status : completed
Elapsed (seconds) : 900 Suspect : no
Frames Sent : 900 Frames Received : 900
------------------------------------------------------------------------------
----------------------------------------------------------------------
Bin Type Direction Minimum (us) Maximum (us) Average (us)
----------------------------------------------------------------------
FD Forward 0 6379 518
FD Backward 0 7856 2049
FD Round Trip 1118 9879 2241
FDR Forward 0 6379 518
FDR Backward 0 7856 2049
FDR Round Trip 9 8770 1132
IFDV Forward 0 6021 328
IFDV Backward 0 5800 732
IFDV Round Trip 2 7758 984
----------------------------------------------------------------------
show oam-pm statistics session "eth-pm-service-4" dmm meas-interval raw
------------------------------------------------------------------------------
Start (UTC) : 2014/02/01 09:43:58 Status : in-progress
Elapsed (seconds) : 3812 Suspect : yes
Frames Sent : 3812 Frames Received : 3812
------------------------------------------------------------------------------
----------------------------------------------------------------------
Bin Type Direction Minimum (us) Maximum (us) Average (us)
----------------------------------------------------------------------
FD Forward 0 11670 629
FD Backward 0 11710 2156
FD Round Trip 1109 14902 2497
FDR Forward 0 11670 617
FDR Backward 0 11710 2156
FDR Round Trip 0 13784 1360
IFDV Forward 0 10027 404
IFDV Backward 0 10436 768
IFDV Round Trip 0 13542 1056
----------------------------------------------------------------------
---------------------------------------------------------------
Frame Delay (FD) Bin Counts
---------------------------------------------------------------
Bin Lower Bound Forward Backward Round Trip
---------------------------------------------------------------
0 0 us 2815 661 0
1 1000 us 803 1287 1591
2 2000 us 127 971 1227
3 3000 us 21 639 623
4 4000 us 25 181 232
5 5000 us 12 42 72
6 6000 us 7 14 28
7 7000 us 0 4 13
8 8000 us 1 12 19
9 10000 us 1 1 7
---------------------------------------------------------------
---------------------------------------------------------------
Frame Delay Range (FDR) Bin Counts
---------------------------------------------------------------
Bin Lower Bound Forward Backward Round Trip
---------------------------------------------------------------
0 0 us 3792 3740 3751
1 5000 us 21 73 62
---------------------------------------------------------------
---------------------------------------------------------------
Inter-Frame Delay Variation (IFDV) Bin Counts
---------------------------------------------------------------
Bin Lower Bound Forward Backward Round Trip
---------------------------------------------------------------
0 0 us 1815 884 410
1 100 us 338 439 354
2 200 us 280 313 282
3 300 us 241 313 268
4 400 us 162 193 231
5 500 us 134 141 202
6 600 us 126 102 178
7 700 us 127 97 153
8 800 us 208 165 276
9 1000 us 381 1165 1458
---------------------------------------------------------------
slm
Syntax
slm
Context
show>oam-pm>statistics>session
Platforms
Supported on all 7210 SAS platforms as described in this document, including platforms configured in the access-uplink operating mode
Description
Commands in this context display SLM test statistics.
meas-interval
Syntax
meas-interval raw
meas-interval {5-mins | 15-mins | 1-hour | 1-day} interval-number interval-number
Context
show>oam-pm>statistics>session>slm
Platforms
Supported on all 7210 SAS platforms as described in this document, including platforms configured in the access-uplink operating mode
Description
This command displays measured interval statistics for SLM tests in the specified session
Parameters
- raw
Specifies raw information.
- 5-mins
Specifies information for 5-min intervals.
- 15-mins
Specifies information for 15-min intervals.
- 1-hour
Specifies information for 1-hour intervals.
- 1-day
Specifies information for 1-day intervals.
- interval-number
Specifies the interval number.
Output
The following output is an example of SLM measured interval statistics information.
Sample outputshow oam-pm statistics session "eth-pm-service-4" slm meas-interval 15-
mins interval-number 2
------------------------------------------------------------------------------
Start (UTC) : 2014/02/01 10:30:00 Status : completed
Elapsed (seconds) : 900 Suspect : no
Frames Sent : 9000 Frames Received : 9000
------------------------------------------------------------------------------
------------------------------------------------------
Frames Sent Frames Received
------------------------------------------------------
Forward 9000 9000
Backward 9000 9000
------------------------------------------------------
-------------------------------------------
Frame Loss Ratios
-------------------------------------------
Minimum Maximum Average
-------------------------------------------
Forward 0.000% 0.000% 0.000%
Backward 0.000% 0.000% 0.000%
-------------------------------------------
-------------------------------------------------------------------------------
Availability Counters (Und = Undetermined)
-------------------------------------------------------------------------------
Available Und-Avail Unavailable Und-Unavail HLI CHLI
-------------------------------------------------------------------------------
Forward 900 0 0 0 0 0
Backward 900 0 0 0 0 0
-------------------------------------------------------------------------------
show oam-pm statistics session "eth-pm-service-4" slm meas-interval raw
------------------------------------------------------------------------------
Start (UTC) : 2014/02/01 09:44:03 Status : in-progress
Elapsed (seconds) : 4152 Suspect : yes
Frames Sent : 41523 Frames Received : 41523
------------------------------------------------------------------------------
------------------------------------------------------
Frames Sent Frames Received
------------------------------------------------------
Forward 41369 41369
Backward 41369 41369
------------------------------------------------------
-------------------------------------------
Frame Loss Ratios
-------------------------------------------
Minimum Maximum Average
-------------------------------------------
Forward 0.000% 0.000% 0.000%
Backward 0.000% 0.000% 0.000%
-------------------------------------------
-------------------------------------------------------------------------------
Availability Counters (Und = Undetermined)
-------------------------------------------------------------------------------
Available Und-Avail Unavailable Und-Unavail HLI CHLI
-------------------------------------------------------------------------------
Forward 4137 0 0 0 0 0
Backward 4137 0 0 0 0 0
-------------------------------------------------------------------------------
Ib
twamp-light
Syntax
twamp-light
Context
show>oam-pm>statistics>session
Platforms
Supported on all 7210 SAS platforms as described in this document, including platforms configured in the access-uplink operating mode
Description
Commands in this context display TWAMP Light test statistics.
meas-interval
Syntax
meas-interval raw delay [{all | bins | summary}]
meas-interval raw [loss]
meas-interval {5-mins | 15-mins | 1-hour | 1-day} interval-number interval-number delay [{all | bins | summary}]
meas-interval {5-mins | 15-mins | 1-hour | 1-day} interval-number interval-number [loss]
Context
show>oam-pm>statistics>session>twamp-light
Platforms
Supported on all 7210 SAS platforms as described in this document, including platforms configured in the access-uplink operating mode
Description
This command displays measured interval statistics for TWAMP-Light tests in the specified session.
Parameters
- raw
Specifies raw information.
- 5-mins
Specifies information for 5-min intervals.
- 15-mins
Specifies information for 15-min intervals.
- 1-hour
Specifies information for 1-hour intervals.
- 1-day
Specifies information for 1-day intervals.
- interval-number
Specifies the interval number.
- delay
Specifies TWAMP Light delay statistics only.
- loss
Specifies TWAMP Light loss statistics only.
- all
Specifies all information for the interval.
- bins
Specifies bin information for the interval.
- summary
Specifies summarized information for the interval.
Monitor commands
session
Syntax
session session-name [{dmm | slm | twamp-light}]
Context
monitor>oam-pm
Platforms
Supported on all 7210 SAS platforms as described in this document.
Description
This command monitors the raw measurement interval for the specified session.
Parameters
- session-name
Specifies the session name, up to 32 characters.
- dmm
Specifies monitoring information for DMM tests only.
- slm
Specifies monitoring information for SLM tests only.
- twamp-light
Specifies monitoring information for TWAMP-Light tests only.
Output
Sample outputmonitor oam-pm session "eth-pm-service-4" dmm
-------------------------------------------------------------------------------
At time t = 0 sec (Base Statistics)
-------------------------------------------------------------------------------
---------------------------------------------------------------
Frame Delay (FD) Bin Counts
---------------------------------------------------------------
Bin Lower Bound Forward Backward Round Trip
---------------------------------------------------------------
0 0 us 3928 1125 0
1 1000 us 1197 1855 2611
2 2000 us 183 1361 1565
3 3000 us 36 762 778
4 4000 us 30 214 280
5 5000 us 14 45 81
6 6000 us 8 17 35
7 7000 us 1 5 16
8 8000 us 5 15 26
9 10000 us 1 4 11
---------------------------------------------------------------
---------------------------------------------------------------
Frame Delay Range (FDR) Bin Counts
---------------------------------------------------------------
Bin Lower Bound Forward Backward Round Trip
---------------------------------------------------------------
0 0 us 5374 5317 5321
1 5000 us 29 86 82
---------------------------------------------------------------
---------------------------------------------------------------
Inter-Frame Delay Variation (IFDV) Bin Counts
---------------------------------------------------------------
Bin Lower Bound Forward Backward Round Trip
---------------------------------------------------------------
0 0 us 2475 1268 625
1 100 us 516 676 554
2 200 us 395 479 417
3 300 us 338 451 398
4 400 us 224 291 340
5 500 us 185 212 280
6 600 us 187 137 234
7 700 us 185 134 208
8 800 us 315 223 392
9 1000 us 582 1531 1954
---------------------------------------------------------------
-------------------------------------------------------------------------------
At time t = 10 sec (Mode: Delta)
-------------------------------------------------------------------------------
---------------------------------------------------------------
Frame Delay (FD) Bin Counts
---------------------------------------------------------------
Bin Lower Bound Forward Backward Round Trip
---------------------------------------------------------------
0 0 us 0 7 0
1 1000 us 10 2 6
2 2000 us 0 1 3
3 3000 us 0 0 1
4 4000 us 0 0 0
5 5000 us 0 0 0
6 6000 us 0 0 0
7 7000 us 0 0 0
8 8000 us 0 0 0
9 10000 us 0 0 0
---------------------------------------------------------------
---------------------------------------------------------------
Frame Delay Range (FDR) Bin Counts
---------------------------------------------------------------
Bin Lower Bound Forward Backward Round Trip
---------------------------------------------------------------
0 0 us 10 10 10
1 5000 us 0 0 0
---------------------------------------------------------------
---------------------------------------------------------------
Inter-Frame Delay Variation (IFDV) Bin Counts
---------------------------------------------------------------
Bin Lower Bound Forward Backward Round Trip
---------------------------------------------------------------
0 0 us 5 4 2
1 100 us 2 2 2
2 200 us 2 1 1
3 300 us 1 0 0
4 400 us 0 0 1
5 500 us 0 0 0
6 600 us 0 0 0
7 700 us 0 0 1
8 800 us 0 0 0
9 1000 us 0 3 3
---------------------------------------------------------------
-------------------------------------------------------------------------------
At time t = 20 sec (Mode: Delta)
-------------------------------------------------------------------------------
---------------------------------------------------------------
Frame Delay (FD) Bin Counts
---------------------------------------------------------------
Bin Lower Bound Forward Backward Round Trip
---------------------------------------------------------------
0 0 us 9 0 0
1 1000 us 0 7 6
2 2000 us 0 3 3
3 3000 us 1 0 0
4 4000 us 0 0 0
5 5000 us 0 0 1
6 6000 us 0 0 0
7 7000 us 0 0 0
8 8000 us 0 0 0
9 10000 us 0 0 0
---------------------------------------------------------------
---------------------------------------------------------------
Frame Delay Range (FDR) Bin Counts
---------------------------------------------------------------
Bin Lower Bound Forward Backward Round Trip
---------------------------------------------------------------
0 0 us 10 10 10
1 5000 us 0 0 0
---------------------------------------------------------------
---------------------------------------------------------------
Inter-Frame Delay Variation (IFDV) Bin Counts
---------------------------------------------------------------
Bin Lower Bound Forward Backward Round Trip
---------------------------------------------------------------
0 0 us 5 3 2
1 100 us 0 2 2
2 200 us 0 1 0
3 300 us 0 3 1
4 400 us 2 0 0
5 500 us 1 0 0
6 600 us 0 1 2
7 700 us 0 0 0
8 800 us 0 0 0
9 1000 us 2 0 3
---------------------------------------------------------------
monitor oam-pm session "eth-pm-service-4" slm
-------------------------------------------------------------------------------
At time t = 0 sec (Base Statistics)
-------------------------------------------------------------------------------
------------------------------------------------------
Frames Sent Frames Received
------------------------------------------------------
Forward 54749 54749
Backward 54749 54749
------------------------------------------------------
-------------------------------------------------------------------------------
Availability Counters (Und = Undetermined)
-------------------------------------------------------------------------------
Available Und-Avail Unavailable Und-Unavail HLI CHLI
-------------------------------------------------------------------------------
Forward 5475 0 0 0 0 0
Backward 5475 0 0 0 0 0
-------------------------------------------------------------------------------
-------------------------------------------------------------------------------
At time t = 10 sec (Mode: Delta)
-------------------------------------------------------------------------------
------------------------------------------------------
Frames Sent Frames Received
------------------------------------------------------
Forward 100 100
Backward 100 100
------------------------------------------------------
-------------------------------------------------------------------------------
Availability Counters (Und = Undetermined)
-------------------------------------------------------------------------------
Available Und-Avail Unavailable Und-Unavail HLI CHLI
-------------------------------------------------------------------------------
Forward 10 0 0 0 0 0
Backward 10 0 0 0 0 0
-------------------------------------------------------------------------------
-------------------------------------------------------------------------------
At time t = 20 sec (Mode: Delta)
-------------------------------------------------------------------------------
------------------------------------------------------
Frames Sent Frames Received
------------------------------------------------------
Forward 100 100
Backward 100 100
------------------------------------------------------
-------------------------------------------------------------------------------
Availability Counters (Und = Undetermined)
-------------------------------------------------------------------------------
Available Und-Avail Unavailable Und-Unavail HLI CHLI
-------------------------------------------------------------------------------
Forward 10 0 0 0 0 0
Backward 10 0 0 0 0 0
-------------------------------------------------------------------------------
Clear commands
saa
Syntax
saa-test [test-name [owner test-owner]]
Context
clear
Platforms
Supported on all 7210 SAS platforms as described in this document, including platforms configured in the access-uplink operating mode
Description
This command clears the SAA results for the latest and the history for this test. If the test name is omitted, all the results for all tests are cleared.
Parameters
- test-name
Specifies the name of the SAA test. The test name must already be configured in the config>saa>test context.
- owner test-owner
Specifies the owner of an SAA operation up to 32 characters.
session
Syntax
session session-name {dmm | slm | twamp-light}
Context
clear>oam-pm
Platforms
Supported on all 7210 SAS platforms as described in this document, including platforms configured in the access-uplink operating mode
Description
This command clears the raw measurement interval for the specified session and test.
Parameters
- session-name
Specifies the name of the session, 32 characters maximum.
- dmm
Clears the raw measurement interval for DMM tests.
- slm
Clears the raw measurement interval for SLM tests.
- twamp-light
Clears the raw measurement interval for TWAMP Light tests.
mep
Syntax
mep mep-id domain md-index association ma-index statistics
Context
clear>eth-cfm
Platforms
Supported on all 7210 SAS platforms as described in this document, including platforms configured in the access-uplink operating mode
Description
This command clears the specified MEP.
Parameters
- mep-id
Specifies the MEP ID.
- md-index
Specifies the domain context for the MEP.
- ma-index
Specifies the association context for the MEP.
- statistics
Clears MEP statistics for the specified MEP.
statistics
Syntax
statistics
Context
clear>eth-cfm
Platforms
Supported on all 7210 SAS platforms as described in this document, including platforms configured in the access-uplink operating mode
Description
This command clears the ETH-CFM statistics counters.
test-oam
Syntax
test-oam
Context
clear
Platforms
Supported on all 7210 SAS platforms as described in this document, including platforms configured in the access-uplink operating mode
Description
This command clears the Operations, Administration, and Maintenance test parameters.
twamp
Syntax
twamp
Context
clear>test-oam
Platforms
Supported on all 7210 SAS platforms as described in this document, including platforms configured in the access-uplink operating mode
Description
Commands in this context clear TWAMP server statistics.
server
Syntax
server
Context
clear>test-oam>twamp
Platforms
Supported on all 7210 SAS platforms as described in this document, including platforms configured in the access-uplink operating mode
Description
This command clears TWAMP server statistics.
testhead
Syntax
testhead
Context
clear
Platforms
Supported on all 7210 SAS platforms as described in this document, including platforms configured in the access-uplink operating mode
Description
Commands in this context clear teasthead statistics.
result
Syntax
result [test-name] [owner test-owner]
result testhead-profile profile-id
Context
clear>testhead
Platforms
Supported on all 7210 SAS platforms as described in this document, including platforms configured in the access-uplink operating mode
Description
This command clears testhead results from the latest history for the test.
Parameters
- test-name
Specifies the name of the test.
- test-owner
Specifies the owner of a testhead operation.
- profile-id
Clears the testhead profile ID to use with this run/session of testhead invocation.
Tools command reference
Command hierarchies
Configuration commands
Tools dump commands
tools
    - dump
        - accounting-policy acct-policy-id flash-write-count [clear]
        - top-active-meps [rx-sort | tx-sort] [clear]
        - eth-ring ring-index [clear]
        - lag lag-id lag-id
        - ldp-treetrace {prefix ip-prefix/mask | manual-prefix ip-prefix/mask} [path-destination ip-address] [trace-tree]
        - redundancy
            - multi-chassis
                - mc-endpoint peer ip-address
                - sync-database [peer ip-address] [port port-id | lag-id] [sync-tag sync-tag] [application application] [detail] [type type]
        - router router-instance
            - dintf [ip-address]
            - filter-info [verbose]
            - l3info
            - l3-stats [clear]
            - service-name service-name
            - ldp
                - fec prefix ip-prefix/mask
                - fec p2mp-id id root ip-address [detail]
                - fec vc-type {vc-type} agi agi
                - fec vc-type {ethernet | vlan} vc-id vc-id
                - interface [ip-int-name | ip-address]
                - memory-usage
                - peer ip-address
                - session [ip-addr[:label-space] [connection | peer | adjacency]
                - sockets
                - timers
            - mpls
                - cspf to ip-addr [from ip-addr] [strict-srlg] [srlg-group grp-id...(up to 8 max)] [bandwidth bandwidth] [include-bitmap bitmap] [exclude-bitmap bitmap] [hop-limit limit] [exclude-address excl-addr [excl-addr...(upto
8 max)]] [use-te-metric] [exclude-node excl-node-id [excl-node-id...(upto 8 max)]] [skip-interface interface-name]
                - force-switch-path lsp lsp-name path path-name
                - no force-switch-path lsp lsp-name
                - ftn [endpoint endpoint | sender sender | nexthop nexthop | lsp-id lsp-id | tunnel-id tunnel-id | label start-label end-label]
                - ilm [endpoint endpoint | sender sender | nexthop nexthop | lsp-id lsp-id | tunnel-id tunnel-id | label start-label end-label]
                - lspinfo [lsp-name] [detail]
                - memory-usage
                - te-lspinfo [endpoint ip-address] [sender ip-address] [lspid lsp-id] [detail]
                - te-lspinfo [endpoint ip-address] [sender ip-address] [lspid lsp-id] [detail]
                - switch-path lsp lsp-name path path-name
                - tp-tunnel
                    - clear {lsp-name | id tunnel-id}
                    - force {lsp-name | id tunnel-id}
                    - manual {lsp-name | id tunnel-id}
                    - lockout {lsp-name | id tunnel-id}
                - trap-suppress number-of-traps time-interval
            - ospf ospf-instance
                - abr [detail]
                - asbr [detail]
                - bad-packet interface-name
                - leaked-routes [summary | detail]
                - memory-usage [detail]
                - request-list [neighbor ip-address] [detail]
                - request-list virtual-neighbor ip-address area-id area-id [detail]
                - retransmission-list [neighbor ip-address] [detail]
                - retransmission-list virtual-neighbor ip-address area-id area-id [detail]
                - route-summary
                - route-table ip-prefix/mask [type] [detail]
            - ospf3
            - rsvp
                - psb [endpoint endpoint-address] [sender sender-address] [tunnelid tunnel-id] [lspid lsp-id]
                - rsb [endpoint endpoint-address] [sender sender-address] [tunnelid tunnel-id] [lspid lsp-id]
                - tcsb[endpoint endpoint-address] [sender sender-address] [tunnelid tunnel-id] [lspid lsp-id]
                - neighbor [ip-address] [detail]
        - service
            - base-stats [clear]
            - dpipe service-id
            - dtls service-id
            - iom-stats [clear]
            - l2pt-diags
            - l2pt-diags clear
            - l2pt-diags detail
            - vpls-fdb-stats [clear]
            - vpls-mfib-stats [clear]
        - system
            - cpu-pkt-stats
        - system-resources slot-number [sap-ingress-qos] [associations]
        - system-resources slot-number mcast-groups
        - system-resources slot-number g8032-control-sap-tags
        - system-resources slot-number l4-port-range
        - system-resources sap [port port-id] [lag lag-id]
        - vc-stack card slot-number [detail]
        - vc-stack card slot-number [detail] fabric-ports [pools]
Tools perform commands
tools
    - perform
        - eth-ring
            - clear ring-index
            - force ring-index path {a | b}
            - manual ring-index path {a | b}
        - lag
            - clear-force all-mc
            - clear-force lag-id lag-id [sub-group sub-group-id]
            - clear-force peer-mc ip-address
            - force all-mc {active | standby}
            - force lag-id lag-id [sub-group sub-group-id] {active | standby}
            - force peer-mc peer-ip-address {active | standby}
        - log
            - test-event
        - redundancy
            - issu-post-process
        - router [router-instance]
            - isis
            - mpls
                - cspf to ip-addr [from ip-addr] [bandwidth bandwidth] [include-bitmap bitmap] [exclude-bitmap bitmap] [hop-limit limit] [exclude-address excl-addr [excl-addr...(up to 8 max)]] [use-te-metric] [skip-interface interface-name]
                - resignal lsp lsp-name path path-name delay minutes
                - resignal {p2mp-lsp p2mp-lsp-name p2mp-instance p2mp-instancename | p2mp-delay p2mp-minutes}
                - trap-suppress number-of-traps time-interval
            - ospf [ospf-instance]
                - ldp-sync-exit
                - refresh-lsas
                - run-manual-spf
            - ospf3
                - ldp-sync-exit
                - refresh-lsas
                - run-manual-spf
        - service
            - eval-pw-template policy-id [allow-service-impact]
            - id service-id
                - endpoint endpoint-name
                    - force-switchover sdp-id:vc-id
                    - no force-switchover
                - eval-pw-template policy-id [allow-service-impact]
            - pw-routing
                - eval-expired-fec spoke-sdp-fec-id
                - eval-expired-fec all
            - spoke-sdp-fec-release global-id[:prefix[:ac-id]]
        - system
            - cron
                - tod
                    - re-evaluate
                        - customer customer-id [site customer-site-name]
                        - filter ip-filter [filter-id]
                        - filter ipv6-filter [filter-id]
                        - filter mac-filter [filter-id]
                        - service id service-id [sap sap-id]
                        - tod-suite tod-suite-name
            - script-control
                - script-policy
                    - stop [script-policy-name] [owner script-policy-owner] [all]
Command descriptions
Tools commands
Generic commands
tools
Syntax
tools
Context
root
Platforms
Supported on all 7210 SAS platforms as described in this document
Description
Commands in this context configure debugging tools.
Parameters
- dump
Enables dump tools for the various protocols.
- perform
Enables tools to perform specific tasks.
Dump commands
dump
Syntax
dump router-name
Context
tools
Platforms
Supported on all 7210 SAS platforms as described in this document
Description
Commands in this context display information for debugging.
Parameters
- router-name
Specifies a router name, up to 32 characters.
accounting-policy
Syntax
accounting-policy acct-policy-id flash-write-count [clear]
Context
tools>dump
Platforms
Supported on all 7210 SAS platforms as described in this document, including platforms configured in the access-uplink operating mode.
Description
This command dumps the total count of flash writes for the accounting policy specified by the user. The clear option allows the user to clear the count maintained per accounting policy and starts the counter afresh.
Parameters
- flash-write-count
Dumps the total number of flash writes up to the present for the accounting policy specified by accounting-policy 'id'.
- acct-policy-id
Specifies the Accounting policy.
- clear
Clears statistics.
top-active-meps
Syntax
top-active-meps [rx-sort | tx-sort] [clear]
Context
tools>dump>eth-cfm
Platforms
Supported on all 7210 SAS platforms as described in this document, including platforms configured in the access-uplink operating mode.
Description
This command displays, and optionally clears, the most active MEPs on the system.
Default
sorts total in both directions
Parameters
- rx-sort
Sorts in the receive (Rx) direction.
- tx-sort
Sorts in the transmit (Tx) direction.
- clear
Clears the current counters.
eth-ring
Syntax
eth-ring ring-index [clear]
Context
tools>dump
Platforms
Supported on all 7210 SAS platforms as described in this document, including platforms configured in the access-uplink operating mode.
Description
This command displays Ethernet ring information.
Parameters
- ring-index
Specifies the ring index.
- clear
Clears statistics.
lag
Syntax
lag lag-id lag-id
Context
tools>dump
Platforms
Supported on all 7210 SAS platforms as described in this document, including platforms configured in the access-uplink operating mode.
Description
This command displays LAG information.
Parameters
- lag-id
Specifies an existing LAG ID.
Output
*A:kiran3>tools>dump# lag lag-id 1
Port state      : Up
Selected subgrp : 1
NumActivePorts  : 2
ThresholdRising : 2
ThresholdFalling: 0
IOM bitmask     : 2
Config MTU      : 1522
Oper. MTU       : 1522
Bandwidth       : 200000

multi-chassis   : NO

------------------------------------------------------------------------------------
Indx   PortId   RX pkts   TX pkts   State Active Port  Cfg Oper Speed       BW AP CS
                                                 Pri   Mtu Mtu
------------------------------------------------------------------------------------
   0    1/1/
1         1         1      Up    yes 32768 1522 1522  1000   100000  0  2
   1    1/1/
2         0         0      Up    yes 32768 1522 1522  1000   100000  0  2
ldp-treetrace
Syntax
ldp-treetrace {prefix ip-prefix/mask | manual-prefix ip-prefix/mask} [path-destination ip-address] [trace-tree]
Context
tools>dump
Platforms
Supported on all 7210 SAS platforms as described in this document
Description
This command displays LDP treetrace information.
The tools dump ldp-treetrace prefix command displays entries only if ldp-treetrace is enabled, that is, configure test-oam ldp-treetrace no shutdown is configured.
Parameters
- prefix ip-prefix/mask
Specifies the IP prefix and host bits.
Output
The following output is an example of automated LDP treetrace information.
Sample output — automated LDP treetrace*A:Dut-B# tools dump ldp-treetrace prefix 10.20.1.6/32
Discovered Paths:
===================
Id PathDst EgrNextHop ReplyRtrAddr DiscoveryTime
DiscoveryTtl ProbeState ProbeTmOutCnt RtnCode
=== ================ ================ ================ ===================
001 127.1.0.255 10.10.41.2 10.10.9.6 11/09/2010 16:15:54
002 OK 00 EgressRtr
002 127.2.0.255 10.10.42.2 10.10.9.6 11/09/2010 16:15:54
002 OK 00 EgressRtr
003 127.3.0.255 10.10.43.2 10.10.9.6 11/09/2010 16:15:54
002 OK 00 EgressRtr
004 127.4.0.255 10.10.44.2 10.10.9.6 11/09/2010 16:15:54
002 OK 00 EgressRtr
005 127.5.0.255 10.10.45.2 10.10.9.6 11/09/2010 16:15:54
002 OK 00 EgressRtr
ldp-treetrace discovery state: Done
ldp-treetrace discovery status: ' OK '
Total number of discovered paths: 5
Total number of probe-failed paths: 0
Total number of failed traces: 0
*A:Dut-B#
eth-ring
Syntax
eth-ring ring-index [clear]
Context
tools>dump
Platforms
Supported on all 7210 SAS platforms as described in this document
Description
This command displays eth-ring information.
Parameters
- ring-index
Specifies the ring index.
- clear
Clears the eth-ring statistics.
redundancy
Syntax
redundancy
Context
tools>dump
Platforms
Supported on all 7210 SAS platforms as described in this document
Description
Commands in this context dump tools for redundancy.
multi-chassis
Syntax
multi-chassis
Context
tools>dump>redundancy>multi-chassis
Platforms
Supported on all 7210 SAS platforms as described in this document
Description
Commands in this context dump tools for multi-chassis redundancy.
mc-endpoint
Syntax
multi-chassis
Context
tools>dump>redundancy>multi-chassis
Platforms
Supported on all 7210 SAS platforms as described in this document
Description
This command dumps multi-chassis endpoint information.
Parameters
- peer ip-address
Specifies the peer IP address.
sync-database
Syntax
sync-database [peer ip-address] [port port-id | lag-id] [sync-tag sync-tag] [application application] [detail] [type type]
Context
tools>dump>redundancy>multi-chassis
Platforms
Supported on all 7210 SAS platforms as described in this document
Description
This command dumps MCS database information.
Parameters
- peer ip-address
Specifies the peer IP address.
- port port-id | lag-id
Indicates the port or LAG ID to be synchronized with the multi-chassis peer.
- sync-tag sync-tag
Specifies a synchronization tag to be used while synchronizing this port with the multi-chassis peer.
- application application
Specifies a particular multi-chassis peer synchronization protocol application.
- type type
Indicates the locally deleted or alarmed deleted entries in the MCS database per multi-chassis peer.
- detail
Displays detailed information.
system
Syntax
system
Context
tools>dump
Platforms
Supported on all 7210 SAS platforms as described in this document
Description
This command dumps tools for system information.
cpu-pkt-stats
Syntax
cpu-pkt-stats
Context
tools>dump>system
Platforms
Supported on all 7210 SAS platforms as described in this document
Description
This command dumps statistics for CPU traffic.
system-resources
Syntax
system-resources slot-number [sap-ingress-qos] [associations]
system-resources mcast-groups
system-resources slot-number g8032-control-sap-tags
system-resources [slot-number] l4-port-range
system-resources sap [port port-id] [lag lag-id]
Context
tools>dump
Platforms
Supported on all 7210 SAS platforms as described in this document, including platforms configured in the access-uplink operating mode
Description
This command displays system resource information.
Parameters
- slot-number
Specifies the slot for which system resources information is displayed.
- sap-ingress-qos
Displays details on usage of resources allocated for QoS classification and different match criteria under QoS classification.
- associations
Displays all SAPs with the allocated resource type and chunk ID.
- mcast-groups
Displays details on usage of resources allocated for multicast group resource consumption.
- g8032-control-sap-tags
Displays details on usage of VLANs used for a G8032 control session. This keyword is supported only on the 7210 SAS-T.
- l4-port-range
-
Displays details on the range qualifier resources in use. This keyword is supported only on the 7210 SAS-Mxp.
- sap
Displays the total number of SAPs configured on the system. This keyword is supported only on the 7210 SAS-Mxp.
- port-id
Specifies the port ID for which to display a total SAP count. This parameter is supported only on the 7210 SAS-Mxp.
- lag-id
Specifies the LAG ID for which to displays a total SAP count. This parameter is supported only on the 7210 SAS-Mxp.
Output
The following outputs are examples of port information, and the associated tables describe the output fields:
-
Sample output: SAP ingress QoS, Output fields: dump system-resource SAP ingress QoS
-
Sample output: SAP ingress policy using DSCP classification (for 7210 SAS-Mxp, 7210 SAS-R6, and 7210 SAS-R12) , Output fields: SAP ingress policy using DSCP classification and various hardware resouce pools
-
Sample output: SAP egress aggregate meter (7210 SAS-T), Output fields: SAP ingress policy using DSCP classification and various hardware resouce pools
-
Sample output: Resource utilization for SAP egress aggregate meter (7210 SAS-Mxp), Output fields: SAP ingress policy using DSCP classification and various hardware resouce pools
-
Sample output: SAP ingress QoS policy associations, Output fields: SAP ingress QoS policy associations
-
Sample output: multicast groups, Output fields: multicast groups
-
Sample output: g8032 control SAP tags (for 7210 SAS-T), Output fields: multicast groups
-
Sample output: system resources SAP (for 7210 SAS-Mxp), Output fields: g8032 control SAP tags
- Sample output: Port range support in an IPv4 filter (for 7210 SAS-Mxp)Output fields: Port range support in an IPv4 filter (for 7210 SAS-Mxp)
*A:7210-SAS>tools>dump# system-resources sap-ingress-qos
Sap Resource Manager info at 001 d 10/11/12 04:42:00.043:
Sap Ingress Resource Usage for Slot #1, Cmplx #0:

Total Chunks Configured : 6
Total Chunks Available  : 6
Number of Chunks in Use : 1
Number of Free Chunks   : 5
Number of Chunks in use for IP match   :0
Number of Chunks in use for IPv6 match :0
Number of Chunks in use for MAC match  :1
                 |  Classification Entries   |           Meters
    Chunk | Type | Total  |Allocated|  Free  | Total  |Allocated|  Free
  --------+------+--------+---------+--------+--------+---------+---------
         0|   Mac|     512|        2|     510|     256|        1|     255

Number of Chunks available for use with IP match*   : 5
Number of Chunks available for use with IPv6 match* : 0
Number of Chunks available for use with MAC match*  : 5

* - Assumes all remaining chunks are used
*A:Dut-A>tools>dump#
For the 7210 SAS-Mxp:
*A:dut-a# tools dump system-resources sap-ingress-qos
Sap Resource Manager info at 014 h 10/30/18 09:50:01.718:
Sap Ingress Resource Usage for Slot #1, Cmplx #0:

Total Chunks Configured : 5
Total Chunks Available  : 5
Number of Chunks in Use : 2
Number of Free Chunks   : 3
Number of Chunks in use for IP match       : 0
Number of Chunks in use for IPv6 match     : 0
Number of Chunks in use for IP + Mac match : 0
Number of Chunks in use for MAC match      : 1
Number of Chunks in use for DSCP           : 1
                 |  Classification Entries   |           Meters
    Chunk | Type | Total  |Allocated|  Free  | Total  |Allocated|  Free
  --------+------+--------+---------+--------+--------+---------+---------
         0|   Mac|     256|      120|     136|     128|       60|      68
         1|  Dscp|     256|       32|     224|     128|       16|     112
Number of Chunks available for use with IP match*        : 4
Number of Chunks available for use with IPv6 match*      : 0
Number of Chunks available for use with Ip + Mac match*  : 4
Number of Chunks available for use with MAC match*       : 4
Number of Chunks available for use with DSCP match*      : 4
* - Assumes all remaining chunks are used
*A:dut-a#
| Labels | Descriptions |
|---|---|
|
Total Chunks Configured |
Displays the total number of chunks configured for use by SAP ingress QoS classification across all the match criteria. |
|
Total Chunks Available |
Displays the total number of chunks alloted by software for use by SAP ingress QoS classification across all the match criteria. |
|
Number of Chunks in Use |
Displays the total number of chunks in use by SAP for SAP ingress QoS classification. |
|
Number of Free Chunks |
Displays the total number of chunks available for use by SAP for SAP ingress QoS classification. |
|
Number of Chunks in use for IP match |
Displays the total number of chunks in use by SAP that uses IP classification match criteria in the SAP ingress QoS policy. |
|
Number of Chunks in use for IPv6 match |
Displays the total number of chunks in use by SAP that uses IPv6 classification match criteria in the SAP ingress QoS policy. |
|
Number of Chunks in use for MAC match |
Displays the total number of chunks in use by SAP that uses MAC classification match criteria in the SAP ingress QoS policy. |
|
Number of Chunks in use for DSCP |
Displays the total number of chunks in use by SAP that uses DSCP table-based classification policy match criteria in the SAP ingress QoS policy. |
|
Classification Entries |
The total number of classification entries that are available/allocated/free per chunk. Information is displayed only for chunks that are in use. |
|
Meters |
The total number of meters that are available/allocated/free per chunk. Information is displayed only for chunks that are in use. |
|
Number of Chunks available for use with IP match criteria |
Displays the total number of chunks available for use by SAP that uses IP classification match criteria in the SAP ingress QoS policy. This assumes all of the free chunks are alloted to IP classification match criteria. |
|
Number of Chunks available for use with IPv6 match criteria |
Displays the total number of chunks available for use by SAP that uses IPv6 classification match criteria in the SAP ingress QoS policy. This assumes all of the free chunks are alloted to IPv6 classification match criteria. |
|
Number of Chunks available for use with MAC match criteria |
Displays the total number of chunks available for use by SAP that uses MAC classification match criteria in the SAP ingress QoS policy. This assumes all of the free chunks are alloted to MAC classification match criteria. |
|
Number of Chunks available for use with DSCP match criteria |
Displays the total number of chunks available for use by SAP that uses DSCP table-based classification policy match criteria in the SAP ingress QoS policy. This assumes all of the free chunks are alloted to DSCP table-based classification policy match criteria. |
7210SAS>tools>dump# system-resources

Hardware Resource Usage for Slot #1, CardType iom-sas, Cmplx #0:
                                 |   Total   | Allocated |    Free
  -------------------------------+-----------+-----------+------------
        SAP Ingress QoS Policies |       1791|          1|       1790
        Access Egr. QoS Policies |        255|          1|        254
         SAP Egress QoS Policies |       2047|          1|       2046
     SAP Ingress Aggregate-Meter |        384|          0|        384
       Shared Qos Ingress Meters |        640|          0|        640
  Shared Qos Ingress CAM Entries |       1280|          0|       1280
          Mac Qos Ingress Meters |          0|          0|          0
     Mac Qos Ingress CAM Entries |          0|          0|          0
        IPv4  Qos Ingress Meters |          0|          0|          0
    IPv4 Qos Ingress CAM Entries |          0|          0|          0
        IPv6  Qos Ingress Meters |          0|          0|          0
    IPv6 Qos Ingress CAM Entries |          0|          0|          0
    IP + Mac  Qos Ingress Meters |          0|          0|          0
IP + Mac Qos Ingress CAM Entries |          0|          0|          0
        DSCP  Qos Ingress Meters |          0|          0|          0
                DSCP CAM Entries |          0|          0|          0
                    DSCP Profile |         62|          1|         61
         Network Ing Port Meters |        128|         28|        100
    Network Ing Port CAM Entries |        256|         28|        228
       Network Ing IpIntf Meters |        128|          0|        128
  Network Ing IpIntf CAM Entries |        256|          0|        256
  Network MPLS Exp Profile Table |         31|          0|         31
         Port Scheduler Policies |          0|          0|          0
       Queue Management Policies |        500|          1|        499
                 Remark Policies |        256|          2|        254
      Shared Egr QOS MAP Entries |         14|          0|         14
          Egress QOS CAM Entries |        400|          0|        400
    Dscp Classification policies |         51|          1|         50
      Ingress Shared ACL Entries |        768|          0|        768
         Ingress Mac ACL Entries |          0|          0|          0
        Ingress IPv4 ACL Entries |          0|          0|          0
    Ing IPv6 128 bit ACL Entries |          0|          0|          0
     Ing IPv6 64 bit ACL Entries |          0|          0|          0
       Egress Shared ACL Entries |        256|          0|        256
     Egress Mac only ACL Entries |          0|          0|          0
     Egress Mac+IPv4 ACL Entries |          0|          0|          0
    Egr IPv6 128 bit ACL Entries |          0|          0|          0
 Egr Mac+IPv6 64 bit ACL Entries |          0|          0|          0
      Ingress SAP Lookup Entries |        703|          0|        703
               TWAMP/LT  Entries |         32|          0|         32
         MEP Lookup CAM Entries  |        256|          0|        256
                  DN MEP Entries |       1024|         42|        982
Num VLAN-ID/Range in Con Profile |       4096|          0|       4096
        Egress TLS Mcast Entries |     147455|          0|     147455
*7210SAS>config>service# /tools dump system-resources
Resource Manager info at 022 h 07/27/01 22:50:44.676:

Hardware Resource Usage per Node:

                                 |   Total   | Allocated |    Free
  -------------------------------+-----------+-----------+------------
          Max System Ecmp Routes |           |          1|


Hardware Resource Usage for Slot #1, CardType iom-sas, Cmplx #0:
                                 |   Total   | Allocated |    Free
  -------------------------------+-----------+-----------+------------
        SAP Ingress QoS Policies |       1791|          1|       1790
        Access Egr. QoS Policies |        255|          1|        254
     SAP Ingress Aggregate-Meter |        256|          0|        256
       Shared Qos Ingress Meters |       1280|        256|       1024
  Shared Qos Ingress CAM Entries |       2560|        512|       2048
          Mac Qos Ingress Meters |        256|          2|        254
     Mac Qos Ingress CAM Entries |        512|          4|        508
        IPv4  Qos Ingress Meters |          0|          0|          0
    IPv4 Qos Ingress CAM Entries |          0|          0|          0
        IPv6  Qos Ingress Meters |          0|          0|          0
    IPv6 Qos Ingress CAM Entries |          0|          0|          0
    IP + Mac  Qos Ingress Meters |          0|          0|          0
IP + Mac Qos Ingress CAM Entries |          0|          0|          0
SAP Egress Aggregate-Meter Entries|        512|          2|        510
          Network Ingress Meters |        256|          0|        256
         Network Ing CAM Entries |        512|          0|        512
         Port Scheduler Policies |       1023|          1|       1022
      Ingress Shared ACL Entries |       2560|          0|       2560
         Ingress Mac ACL Entries |          0|          0|          0
        Ingress IPv4 ACL Entries |          0|          0|          0
    Ing IPv6 128 bit ACL Entries |          0|          0|          0
     Ing IPv6 64 bit ACL Entries |          0|          0|          0
       Egress Shared ACL Entries |          0|          0|          0
     Egress Mac only ACL Entries |          0|          0|          0
     Egress Mac+IPv4 ACL Entries |          0|          0|          0
    Egr IPv6 128 bit ACL Entries |          0|          0|          0
 Egr Mac+IPv6 64 bit ACL Entries |          0|          0|          0
      Ingress SAP Lookup Entries |       1496|          4|       1492
Num VLAN-ID/Range in Con Profile |       4096|          0|       4096
========================================================================
The following sample displays the resource utilization for various hardware resource pools on the 7210 SAS-R6:
A:7210SAS-053>tools>dump# system-resources
Resource Manager info at 001 h 02/29/16 10:03:45.035:

Hardware Resource Usage per Node:

                                 |   Total   | Allocated |    Free
  -------------------------------+-----------+-----------+------------
          Max System Ecmp Routes |           |          1|
          Ldp Ecmp percent value |           |          0|
    Eth-Ring Fast Flood Entries  |       1280|          1|       1279

Hardware Resource Usage for Slot #1, CardType imm-sas-b-10sfp-1sfp+, Cmplx #0:
                                 |   Total   | Allocated |    Free
  -------------------------------+-----------+-----------+------------
        SAP Ingress QoS Policies |       1791|          2|       1789
        Access Egr. QoS Policies |        255|          2|        253
         SAP Egress QoS Policies |       2047|          2|       2045
     SAP Ingress Aggregate-Meter |        384|          0|        384
       Shared Qos Ingress Meters |        640|        128|        512
  Shared Qos Ingress CAM Entries |       1280|        256|       1024
          Mac Qos Ingress Meters |        128|          6|        122
     Mac Qos Ingress CAM Entries |        256|         12|        244
        IPv4  Qos Ingress Meters |          0|          0|          0
    IPv4 Qos Ingress CAM Entries |          0|          0|          0
        IPv6  Qos Ingress Meters |          0|          0|          0
    IPv6 Qos Ingress CAM Entries |          0|          0|          0
    IP + Mac  Qos Ingress Meters |          0|          0|          0
IP + Mac Qos Ingress CAM Entries |          0|          0|          0
    SAP Egress Agg-Meter Entries |          0|          0|          0
         Network Ing Port Meters |        128|         10|        118
    Network Ing Port CAM Entries |        256|         10|        246
       Network Ing IpIntf Meters |        128|          4|        124
  Network Ing IpIntf CAM Entries |        256|          4|        252
  Network MPLS Exp Profile Table |         31|          0|         31
         Port Scheduler Policies |          0|          0|          0
       Queue Management Policies |        500|          1|        499
                 Remark Policies |        256|          5|        251
      Shared Egr QOS MAP Entries |         14|          1|         13
          Egress QOS CAM Entries |        400|          6|        394
      Ingress Shared ACL Entries |        768|          0|        768
         Ingress Mac ACL Entries |          0|          0|          0
        Ingress IPv4 ACL Entries |          0|          0|          0
    Ing IPv6 128 bit ACL Entries |          0|          0|          0
     Ing IPv6 64 bit ACL Entries |          0|          0|          0
       Egress Shared ACL Entries |        128|          0|        128
     Egress Mac only ACL Entries |          0|          0|          0
     Egress Mac+IPv4 ACL Entries |          0|          0|          0
    Egr IPv6 128 bit ACL Entries |          0|          0|          0
 Egr Mac+IPv6 64 bit ACL Entries |          0|          0|          0
      Ingress SAP Lookup Entries |        706|          8|        698
      Egress Sap Counter Entries |        127|          0|        127
         MEP Lookup CAM Entries  |        256|          0|        256
                  DN MEP Entries |        256|         38|        218
             Port Scheduler Mode |          0|          0|          0
Num VLAN-ID/Range in Con Profile |       4096|          0|       4096
The following sample displays the resource utilization for various hardware resource pools on the 7210 SAS-Sx 10/100GE:
7210SAS>tools>dump# system-resources
Resource Manager info at 008 d 01/09/00 06:24:56.148:

Hardware Resource Usage per Node:

                                 |   Total   | Allocated |    Free
  -------------------------------+-----------+-----------+------------
          Max System Ecmp Routes |           |          1|


Hardware Resource Usage for Slot #1, CardType iom-sas, Cmplx #0:
                                 |   Total   | Allocated |    Free
  -------------------------------+-----------+-----------+------------
        SAP Ingress QoS Policies |       1791|          1|       1790
        Access Egr. QoS Policies |        255|          1|        254
            Network QoS Policies |        255|          2|        253
      Network Queue QoS Policies |        255|          1|        254
       Shared Qos Ingress Meters |       3072|          0|       3072
  Shared Qos Ingress CAM Entries |       6144|          0|       6144
          Mac Qos Ingress Meters |          0|          0|          0
     Mac Qos Ingress CAM Entries |          0|          0|          0
        IPv4  Qos Ingress Meters |          0|          0|          0
    IPv4 Qos Ingress CAM Entries |          0|          0|          0
        IPv6  Qos Ingress Meters |          0|          0|          0
    IPv6 Qos Ingress CAM Entries |          0|          0|          0
    IP + Mac  Qos Ingress Meters |          0|          0|          0
IP + Mac Qos Ingress CAM Entries |          0|          0|          0
    SAP Egress Agg-Meter Entries |          0|          0|          0
              Network Ing Meters |        512|         68|        444
         Network Ing CAM Entries |       1024|         68|        956
  Network MPLS Exp Profile Table |         31|          0|         31
         Port Scheduler Policies |       1023|          1|       1022
                 Remark Policies |        256|          2|        254
      Shared Egr QOS MAP Entries |         13|          0|         13
      Ingress Shared ACL Entries |       2048|          0|       2048
         Ingress Mac ACL Entries |          0|          0|          0
        Ingress IPv4 ACL Entries |          0|          0|          0
    Ing IPv6 128 bit ACL Entries |          0|          0|          0
     Ing IPv6 64 bit ACL Entries |          0|          0|          0
       Egress Shared ACL Entries |        256|          0|        256
     Egress Mac only ACL Entries |          0|          0|          0
     Egress Mac+IPv4 ACL Entries |          0|          0|          0
    Egr IPv6 128 bit ACL Entries |          0|          0|          0
 Egr Mac+IPv6 64 bit ACL Entries |          0|          0|          0
      Ingress SAP Lookup Entries |        703|          0|        703
               TWAMP/LT  Entries |         32|          0|         32
         MEP Lookup CAM Entries  |        256|          0|        256
                  DN MEP Entries |       1024|         42|        982
Num VLAN-ID/Range in Con Profile |       4096|          0|       4096
        Egress TLS Mcast Entries |     147455|          0|     147455
tools dump system-resources
Resource Manager info at 004 h 03/06/23 08:41:24.963:

Hardware Resource Usage per Node:

                                 |   Total   | Allocated |    Free
  -------------------------------+-----------+-----------+------------
          Max System Ecmp Routes |           |          1|


Hardware Resource Usage for Slot #1, CardType iom-sas, Cmplx #0:
                                 |   Total   | Allocated |    Free
  -------------------------------+-----------+-----------+------------
        SAP Ingress QoS Policies |       1791|          2|       1789
        Access Ing. QoS Policies |        255|          6|        249
        Access Egr. QoS Policies |        255|          1|        254
            Network QoS Policies |        255|          2|        253
         SAP Egress QoS Policies |       2047|          1|       2046
     SAP Ingress Aggregate-Meter |        384|          0|        384
       Shared Qos Ingress Meters |        256|          0|        256
  Shared Qos Ingress CAM Entries |        512|          0|        512
          Mac Qos Ingress Meters |          0|          0|          0
     Mac Qos Ingress CAM Entries |          0|          0|          0
        IPv4  Qos Ingress Meters |          0|          0|          0
    IPv4 Qos Ingress CAM Entries |          0|          0|          0
        IPv6  Qos Ingress Meters |          0|          0|          0
    IPv6 Qos Ingress CAM Entries |          0|          0|          0
    IP + Mac  Qos Ingress Meters |          0|          0|          0
IP + Mac Qos Ingress CAM Entries |          0|          0|          0
        DSCP  Qos Ingress Meters |          0|          0|          0
                DSCP CAM Entries |          0|          0|          0
          Ingress Service Meters |       5120|          0|       5120
     Ingress Service Meter Stats |      10240|          0|      10240
                    DSCP Profile |         61|          3|         58
                   DOT1P Profile |         61|          3|         58
         Network Ing Port Meters |        128|         19|        109
    Network Ing Port CAM Entries |        256|         19|        237
       Network Ing IpIntf Meters |        128|          0|        128
  Network Ing IpIntf CAM Entries |        256|          0|        256
  Network MPLS Exp Profile Table |         31|          0|         31
          Access Ing Port Meters |          0|          0|          0
     Access Ing Port CAM Entries |          0|          0|          0
           Shared Acc Ing Meters |        512|        512|          0
      Shared Acc Ing CAM Entries |       1024|       1024|          0
          Acc Ing Shrd IP Meters |        128|         83|         45
     Acc Ing Shrd IP CAM Entries |        256|        166|         90
 Acc Ing Shrd IpPortRange Meters |        128|         16|        112
Acc Ing Shrd IpPortRange CAM Ent |        256|         32|        224
        Acc Ing Shrd DSCP Meters |        128|         66|         62
   Acc Ing Shrd DSCP CAM Entries |        256|        132|        124
         Port Scheduler Policies |          0|          0|          0
       Queue Management Policies |        500|          1|        499
                 Remark Policies |        256|          2|        254
      Shared Egr QOS MAP Entries |         13|          0|         13
          Egress QOS CAM Entries |        400|          0|        400
   Dot1p Classification policies |         51|          2|         49
    Dscp Classification policies |         51|          2|         49
      Ingress Shared ACL Entries |          0|          0|          0
         Ingress Mac ACL Entries |          0|          0|          0
        Ingress IPv4 ACL Entries |          0|          0|          0
    Ing IPv6 128 bit ACL Entries |          0|          0|          0
     Ing IPv6 64 bit ACL Entries |          0|          0|          0
 Ing IPv4 Port Range ACL Entries |          0|          0|          0
       Egress Shared ACL Entries |        128|          0|        128
     Egress Mac only ACL Entries |          0|          0|          0
     Egress Mac+IPv4 ACL Entries |          0|          0|          0
    Egr IPv6 128 bit ACL Entries |          0|          0|          0
 Egr Mac+IPv6 64 bit ACL Entries |          0|          0|          0
      Ingress SAP Lookup Entries |        706|          0|        706
               TWAMP/LT  Entries |         32|          0|         32
         MEP Lookup CAM Entries  |        256|          0|        256
                  DN MEP Entries |        256|         44|        212
Num VLAN-ID/Range in Con Profile |       4096|          0|       4096
        Egress TLS Mcast Entries |     147455|        800|     146655
        L3 Protocol Tcam Entries |        128|         83|         45
            DHCP6 SDP Entries    |          0|          0|          0
Port Range Entries | 15| 15| 0| Labels | Descriptions |
|---|---|
|
SAP Ingress QoS Policies |
Displays the number of SAP ingress policies that are allowed to be configured (software-limit) |
|
Access Egr. QoS Policies |
Displays the number of Access egress policies that are allowed to be configured (software-limit) |
|
SAP Egress QoS Policies |
Displays the number of SAP egress policies that are allowed to be configured (software-limit) |
|
SAP Ingress Aggregate-Meter |
Displays the number of SAP ingress aggregate meter (that is, per SAP aggregate meter) allowed (hardware limit) |
|
Shared Qos Ingress Meters |
Displays the number of SAP ingress meter (that is, per FC meter) across all type of match-criteria (that is, MAC, IPv4, IPv6) (hardware limit) |
|
Shared Qos Ingress CAM Entries |
Displays the number of SAP ingress classification CAM entries across all match-criteria (hardware limit) |
|
Mac Qos Ingress Meters |
Displays the number of SAP ingress meter (that is, per FC meter) for MAC match-criteria (hardware limit) |
|
Mac Qos Ingress CAM Entries |
Displays the number of SAP ingress classification CAM entries for MAC match-criteria (hardware limit) |
|
IPv4 Qos Ingress Meters |
Displays the number of SAP ingress meter (that is, per FC meter) for IPv4 match-criteria (hardware limit) |
|
IPv4 Qos Ingress CAM Entries |
Displays the number of SAP ingress classification CAM entries for IPv4 match-criteria (hardware limit) |
|
IPv6 Qos Ingress Meters |
Displays the number of SAP ingress meter (that is, per FC meter) for IPv6 match-criteria (hardware limit) |
|
IPv6 Qos Ingress CAM Entries |
Displays the number of SAP ingress classification CAM entries for IPv6 match-criteria (hardware limit) |
|
IP + Mac Qos Ingress Meters |
Displays the number of SAP ingress meter (that is, per FC meter) for IP+MAC match-criteria (hardware limit) |
|
IP + Mac Qos Ingress CAM Entries |
Displays the number of SAP ingress classification CAM entries for IP+MAC match-criteria (that is, IP and MAC criteria in the same policy) (hardware limit) |
|
DSCP Qos Ingress Meters |
Displays the number of SAP ingress meter (that is, per FC meter) when using IP DSCP table-based classification (hardware limit) |
|
DSCP CAM Entries |
Displays the number of CAM entries for IP DSCP table-based classification. (hardware limit) |
|
DSCP Profile |
Displays the number of IP DSCP table-based classification resources (hardware limit) |
|
Network Ing Port Meters |
Displays the number of Network Port Ingress Meters (hardware limit) |
|
Network Ing Port CAM Entries |
Displays the number of Network port ingress classification CAM entries used for FC classification. (hardware limit) |
|
Network Ing IpIntf Meters |
Displays the number of Network IP interface meters ( hardware limit) |
|
Network Ing IpIntf CAM Entries |
Displays the number of Network IP interface ingress classification CAM entries used for FC classification. (hardware limit) |
|
Network MPLS Exp Profile Table |
Displays the number of MPLS EXP to FC mapping table resources (hardware limit) |
|
Access Ing Port Meters |
Displays the number of access ingress port meters |
|
Access Ing Port CAM Entries |
Displays the number of access ingress port CAM entries |
|
Shared Acc Ing Meters |
Displays the number of shared access ingress meters |
|
Shared Acc Ing CAM Entries |
Displays the number of shared access ingress CAM entries |
|
Acc Ing Shrd IP Meters |
Displays the number of shared access ingress IP meters |
|
Acc Ing Shrd IP CAM Entries |
Displays the number of shared access ingress IP CAM entries |
|
Acc Ing Shrd IpPortRange Meters |
Displays the number of shared access ingress IP port range meters |
|
Acc Ing Shrd IpPortRange CAM Ent |
Displays the number of shared access ingress IP port range CAM entries |
|
Acc Ing Shrd DSCP Meters |
Displays the number of shared access ingress DSCP meters |
|
Acc Ing Shrd DSCP CAM Entries |
Displays the number of shared access ingress DSCP CAM entries |
|
Port Scheduler Policies |
Displays the number of Port Scheduler policies that can be configured (software limit). |
|
Queue Management Policies |
Displays the number of Queue Management policies that can be configured (software limit). |
|
Remark Policies |
Displays the number of Remark policies that can be configured (software limit). |
|
Shared Egr QOS MAP Entries |
Displays the number of entries in the remark table used for access SAP egress marking, network IP interface egress MPLS EXP marking, and access egress marking (hardware limit). |
|
Egress QOS CAM Entries |
Displays the number of resources used for access SAP egress queuing (hardware limit). These resources are taken from the ingress-internal-tcam pool. |
|
Dscp Classification policies |
Displays the number of IP DSCP table-based classification policy templates (software limit). |
|
Ingress Shared ACL Entries |
Displays the number of CAM entries for ingress ACLs across all match-criteria (some of these are shared with SAP aggregate meter) (hardware limit). Read the system resource profile command description for more information. |
|
Ingress Mac ACL Entries |
Displays the Ingress ACL CAM entries for MAC match criteria (hardware limit). |
|
Ingress IPv4 ACL Entries |
Displays the Ingress ACL CAM entries for IPv4 match criteria (hardware limit). |
|
Ing IPv6 128 bit ACL Entries |
Displays the Ingress ACL CAM entries for IPv6 with 128-bit addresses match criteria (hardware limit). |
|
Ing IPv6 64 bit ACL Entries |
Displays the Ingress ACL CAM entries for IPv6 with 64-bit addresses match criteria (hardware limit). |
|
Egress Shared ACL Entries |
Displays the number of CAM entries for egress ACLs across all match-criteria (hardware limit). |
|
Egress Mac only ACL Entries |
Displays the Egress ACL CAM entries for MAC match criteria (hardware limit). |
|
Egress Mac+IPv4 ACL Entries |
Displays the Egress ACL CAM entries for MAC and IPv4 match criteria (hardware limit). |
|
Egr IPv6 128 bit ACL Entries |
Displays the Egress ACL CAM entries for IPv6 128-bit match criteria (hardware limit). |
|
Egr Mac+IPv6 64 bit ACL Entries |
Displays the Egress ACL CAM entries for MAC + IPv6 64-bit match criteria (hardware limit). |
|
Ingress SAP Lookup Entries |
Displays the number of entries used to identify the SAP on port ingress (hardware limit). |
|
Egress Aggregate Meter |
Displays the resources used for egress aggregate meter configured for access SAP (hardware limit). |
|
TWAMP/LT Entries |
Displays the number of CAM entries used for TWAMP/TWAMP light (hardware limit). |
|
MEP Lookup CAM Entries |
Displays the number of CAM entries (pre-ingress resource pool) used for CFM/Y.1731 Down MEP processing (hardware limit). |
|
DN MEP Entries |
Displays the number of CAM entries in the ingress-internal-tcam pool for CFM/Y.1731 Down MEP processing (hardware limit). |
|
Num VLAN-ID/Range in Con Profile |
Displays the number of VLAN IDs that can be listed explicitly in the connection profile, instead of specifying the range value (hardware limit). |
|
Egress TLS Mcast Entries |
Displays the number of egress multicast entries (software limit). |
|
Port Range Entries |
Displays the number of port range entries |
*A:dut-a# tools dump system-resources sap-ingress-qos associations
Sap Resource Manager info at 008 h 10/28/18 05:34:18.747:
==============================================================================
Service Access Points TCAM Ingress Resource Usage Slot #1, Cmplx #0:
==============================================================================
  Sap Id                     SvcId     Ing. Qos    Chunk    Num       Type
                                            Pol.          Classifiers
==============================================================================
  1/1/1:100                    505       1           0        2        Mac
  lag-6:300                    505       1           0        2        Mac
  1/1/1:200                    506       1           0        2        Mac
  lag-6:400                    506       1           0        2        Mac
  1/1/1:201                    507       1           0        2        Mac
  lag-6:401                    507       1           0        2        Mac
  1/1/1:202                    508       1           0        2        Mac
  lag-6:402                    508       1           0        2        Mac
  1/1/1:300                    605       1           0        2        Mac
  lag-6:100                    605       21          0        32       Mac
  1/1/1:400                    606       1           0        2        Mac
  lag-6:200                    606       22          1        32       Dscp
  1/1/1:401                    607       1           0        2        Mac
  lag-6:201                    607       23          0        32       Mac
  1/1/1:402                    608       1           0        2        Mac
  lag-6:202                    608       24          1        32       Dscp
------------------------------------------------------------------------------
Number of SAPs : 16
------------------------------------------------------------------------------
==============================================================================
| Labels | Descriptions |
|---|---|
|
Sap Id |
Displays the SAP ID |
|
SvcId |
Displays service ID |
|
Ing. Qos Pol. |
Displays the ingress QoS policy ID |
|
Chunk |
Displays the total number of chunks available for use by the SAP |
|
Num Classifiers |
Displays the number of classifiers |
|
Type |
Displays the SAP type |
|
Number of SAPs |
Displays the total number of SAPs |
*A:Dut-B# tools dump system-resources mcast-groups
 ============================================================
 Multicast Group Usage
 ============================================================
              Owner    No. of Mcast Groups
 ------------------------------------------------------------
             SVCMGR    2
               MFIB    11
 ------------------------------------------------------------
    Total Available    4080
    Total Allocated    13
 ============================================================
*A:Dut-B#
| Labels | Descriptions |
|---|---|
|
Owner |
Displays the multicast resource modules that are using the resources |
|
No. of Mcast Groups |
Displays the number of multicast group resources used by the module identified in the Owner field |
|
Total Available |
Displays the total number of available resources for multicast groups per node |
|
Total Allocated |
Displays the total number of resources allocated to multicast groups per node |
*A:dut-a# tools dump system-resources 1 g8032-control-sap-tags
Control Sap Tag on SlotNum 1
------Port-----|------Vlan Tags--------------------------|
---------------------------------------------------------|
    1/1/16       601   605   610   630
    1/1/18       601   605   610   630
*A:dut-a# show version
| Labels | Descriptions |
|---|---|
|
Port |
Displays the port number |
|
VLAN Tags |
Displays the control SAP VLAN tags associated with the port |
*A:Dut-A# /tools dump system-resources sap
Maximum Total SAP per node                                                3072
Count of SAPs with port ingress QoS policy per node                       2
Count of SAPs with SAP ingress QoS policy (svc-meter) per node            2
Count of SAPs with SAP ingress QoS policy (tcam-meter) per node           0

*A:Dut-A# /tools dump system-resources sap port 1/1/2
Total count of SAP on port 1/1/2                                          2
Count of SAPs with port ingress QoS policy port ID 1/1/2                  2

*A:Dut-A# /tools dump system-resources sap port 1/1/1
Total count of SAP on port 1/1/1                                          1
Count of SAPs with SAP ingress QoS policy (svc-meter) port ID 1/1/1       1
Count of SAPs with SAP ingress QoS policy (tcam-meter) port ID 1/1/1      0

*A:Dut-B# tools dump system-resources sap lag 1
Total count of SAP on lag 1                                               64
Count of SAPs with SAP ingress QoS policy (svc-meter) lag ID 1            0
Count of SAPs with SAP ingress QoS policy (tcam-meter) lag ID 1           64
| Labels | Descriptions |
|---|---|
|
Maximum Total SAP per node |
Displays the maximum number of SAPs that can be configured per node |
|
Count of SAPs with port ingress QoS policy per node |
Displays the total number of SAPs using a port ingress QoS policy per node |
|
Count of SAPs with SAP ingress QoS policy (svc-meter) per node |
Displays the number of SAPs using a SAP ingress QoS policy that is using service meter resources |
|
Count of SAPs with SAP ingress QoS policy (tcam-meter) per node |
Displays the number of SAPs using a SAP ingress QoS policy that is using tcam meter resources |
*A:Dut-A/tools dump system-resources l4-port-range 1
====================================================================
IPv4 Port Range Information
====================================================================
--------------------------------------------------------------------
                               |   Total   | Allocated |    Free   |
-------------------------------+-----------+-----------+-----------+
       IPv4 Port Range Entries |         15|         15|          0|
-------------------------------+-----------+-----------+-----------+

--------------------------------------------------------------------
             Match Criteria    |   Start   |    End    |   Count   |
-------------------------------+-----------+-----------+-----------+
                   Source Port |          1|       1024|          3|
                   Source Port |       1000|       2000|          1|
                   Source Port |       1024|      65535|          3|
                   Source Port |       1762|       1764|          1|
                   Source Port |       6000|       6063|          1|
                   Source Port |       8000|      12000|          3|
                   Source Port |      33434|      33625|          1|
-------------------------------+-----------+-----------+-----------+
                   Dest Port   |         60|        520|          3|
                   Dest Port   |        120|        200|          1|
                   Dest Port   |       1000|       2000|          1|
                   Dest Port   |       1024|      65535|          4|
                   Dest Port   |       1761|       1764|          1|
                   Dest Port   |       6000|       6063|          1|
                   Dest Port   |       8000|      12000|          3|
                   Dest Port   |       8160|       8161|          1|
--------------------------------------------------------------------
====================================================================
| Labels | Descriptions |
|---|---|
|
IPv4 Port Range Entries |
Displays the number of total, allocated, and free TCP/UDP port range entries |
|
Match Criteria |
Displays whether the source port match uses range values or the destination port match uses range values |
|
Source Port |
Displays the start, end, and count of source port match range values |
|
Dest Port |
Displays the start, end, and count of destination port match range values |
vc-stack
Syntax
vc-stack card slot-number [detail]
vc-stack card slot-number [detail] fabric-ports [pools]
Context
tools>dump
Platforms
7210 SAS-Sx 1/10GE (standalone-VC), 7210 SAS-S 1/10GE (standalone-VC)
Description
This command displays card information and statistics for the specified node in a VC.
Parameters
- slot-number
Specifies the slot number for the node.
- detail
Displays detailed information about the card.
- fabric-ports
Displays statistics for each queue on the card stacking ports.
- pools
Displays the stacking port queue buffer information.
Output
The following output is an example of VC-stack card information and statistics.
Detailed VC-stack information exampleA:Dut-A# tools dump vc-stack card 1 detail
[membership information]
==========================
vc-stack-name : VC-3
Active Card Number : 9
Vc-Stack-Node-Type : cpm-imm
Base Mac Address : d0:99:d5:91:1c:41
CPM Card Number : 10
Neighbour1 : Card 2
Neighbour1 State : Two-Way
Neighbour1 Cost : 1
Neighbour2 : Card 3
Neighbour2 State : Two-Way
Neighbour2 Cost : 1
number of nodes in the vc: 3
[Topology Information]
==========================
-------------------------------------------
Card Neighbour1 Neighbour2
-------------------------------------------
1: 2 3
2: 3 1
3: 1 2
[Virtual Fabric Layer Software Module Statistics]
=================================================
Number of Discovery packets transmitted: 345469
Number of Discovery packets received from Cards:
Card # # of Packets received
------ ---------------------
2 339202
3 340335
Number of Hello packets transmitted on Fabric Port #1: 183381
Number of Hello packets transmitted on Fabric Port #2: 183268
Number of Hello packets received from Neighbours:
Card # # of Packets received
------ ---------------------
2 183092
3 182699
For Tree rooted at the present Card (used by unicast packets):
List of cards on Fabric Port #1: [ 2 ]
List of cards on Fabric Port #2: [ 3 ]
For tree rooted at the Active Card (used by multicast packets):
List of cards on Fabric Port #1: [ 2 ]
List of cards on Fabric Port #2: [ 3 ]
A:Dut-A# tools dump vc-stack card 1 fabric-ports detail
===============================================================================
HG0 Queue Statistics
===============================================================================
-------------------------------------------------------------------------------
Packets
-------------------------------------------------------------------------------
Egress Queue 0
Fwd Stats : 0
Drop Stats : 0
Fwd Stats (uc) : 0
Drop Stats (uc) : 0
Fwd Stats (mc) : 0
Drop Stats (mc) : 0
Egress Queue 1
Fwd Stats : 0
Drop Stats : 0
Fwd Stats (uc) : 0
Drop Stats (uc) : 0
Fwd Stats (mc) : 0
Drop Stats (mc) : 0
Egress Queue 2
Fwd Stats : 0
Drop Stats : 0
Fwd Stats (uc) : 0
Drop Stats (uc) : 0
Fwd Stats (mc) : 0
Drop Stats (mc) : 0
Egress Queue 3
Fwd Stats : 1323
Drop Stats : 0
Fwd Stats (uc) : 286
Drop Stats (uc) : 0
Fwd Stats (mc) : 1037
Drop Stats (mc) : 0
Egress Queue 4
Fwd Stats : 0
Drop Stats : 0
Fwd Stats (uc) : 0
Drop Stats (uc) : 0
Fwd Stats (mc) : 0
Drop Stats (mc) : 0
Egress Queue 5
Fwd Stats : 0
Drop Stats : 0
Fwd Stats (uc) : 0
Drop Stats (uc) : 0
Fwd Stats (mc) : 0
Drop Stats (mc) : 0
Egress Queue 6
Fwd Stats : 0
Drop Stats : 0
Fwd Stats (uc) : 0
Drop Stats (uc) : 0
Fwd Stats (mc) : 0
Drop Stats (mc) : 0
Egress Queue 7
Fwd Stats : 374
Drop Stats : 0
Fwd Stats (uc) : 61
Drop Stats (uc) : 0
Fwd Stats (mc) : 313
Drop Stats (mc) : 0
===============================================================================
HG1 Queue Statistics
===============================================================================
-------------------------------------------------------------------------------
Packets
-------------------------------------------------------------------------------
Egress Queue 0
Fwd Stats : 0
Drop Stats : 0
Fwd Stats (uc) : 0
Drop Stats (uc) : 0
Fwd Stats (mc) : 0
Drop Stats (mc) : 0
Egress Queue 1
Fwd Stats : 0
Drop Stats : 0
Fwd Stats (uc) : 0
Drop Stats (uc) : 0
Fwd Stats (mc) : 0
Drop Stats (mc) : 0
Egress Queue 2
Fwd Stats : 0
Drop Stats : 0
Fwd Stats (uc) : 0
Drop Stats (uc) : 0
Fwd Stats (mc) : 0
Drop Stats (mc) : 0
Egress Queue 3
Fwd Stats : 1945
Drop Stats : 0
Fwd Stats (uc) : 895
Drop Stats (uc) : 0
Fwd Stats (mc) : 1050
Drop Stats (mc) : 0
Egress Queue 4
Fwd Stats : 0
Drop Stats : 0
Fwd Stats (uc) : 0
Drop Stats (uc) : 0
Fwd Stats (mc) : 0
Drop Stats (mc) : 0
Egress Queue 5
Fwd Stats : 0
Drop Stats : 0
Fwd Stats (uc) : 0
Drop Stats (uc) : 0
Fwd Stats (mc) : 0
Drop Stats (mc) : 0
Egress Queue 6
Fwd Stats : 0
Drop Stats : 0
Fwd Stats (uc) : 0
Drop Stats (uc) : 0
Fwd Stats (mc) : 0
Drop Stats (mc) : 0
Egress Queue 7
Fwd Stats : 3336
Drop Stats : 0
Fwd Stats (uc) : 3023
Drop Stats (uc) : 0
Fwd Stats (mc) : 313
Drop Stats (mc) : 0
===============================================================================
A:Dut-A#
Dump router commands
router
Syntax
router router-instance
Context
tools>dump
tools>perform
Platforms
Supported on all 7210 SAS platforms as described in this document
Description
This command enables tools for the router instance.
Parameters
- router router-instance
Specifies the router name or service ID.
dintf
Syntax
dintf [ip-address]
Context
tools>dump>router
Platforms
Supported on all 7210 SAS platforms as described in this document
Description
This command displays the internal IP interface details.
Parameters
- ip-address
Specifies the IP interface details to display.
filter-info
Syntax
filter-info [verbose]
Context
tools>dump>router
Platforms
Supported on all 7210 SAS platforms as described in this document
Description
This command dumps the hardware-specific filter information.
Parameters
- verbose
Displays the verbose hardware information of the filter.
l3info
Syntax
lag
Context
tools>dump>router
Platforms
Supported on all 7210 SAS platforms as described in this document
Description
This command dumps the hardware-specific Layer 3 information.
l3-stats
Syntax
l3-stats [clear]
Context
tools>dump>router
Platforms
Supported on all 7210 SAS platforms as described in this document
Description
This command dumps the hardware-specific Layer 3 statistics.
Parameters
- clear
Clears the hardware information of the filter.
eth-ring
Syntax
eth-ring
Context
tools>perform
Platforms
Supported on all 7210 SAS platforms as described in this document, including platforms configured in the access-uplink operating mode.
Description
Commands in this context configure tools to control Ethernet rings.
clear
Syntax
clear ring-index
Context
tools>perform>eth-ring
Platforms
Supported on all 7210 SAS platforms as described in this document, including platforms configured in the access-uplink operating mode.
Description
This command removes all switching operational commands. It is used for the following operations.
Clears an active local administrative command (for example, the force switch or manual switch commands).
Triggers reversion before the WTR or WTB timer expires in case of revertive operation.
Triggers reversion in case of non-revertive operation.
Parameters
- ring-index
Specifies the ring index of the Ethernet ring.
force
Syntax
force ring-index path {a | b}
Context
tools>perform>eth-ring
Platforms
Supported on all 7210 SAS platforms as described in this document, including platforms configured in the access-uplink operating mode.
Description
This command forces the specified path into a blocked state.
Parameters
- ring-index
Specifies the ring index of the Ethernet ring.
- path {a | b}
Specifies the path of the Ethernet ring.
manual
Syntax
manual ring-index path {a | b}
Context
tools>perform>eth-ring
Platforms
Supported on all 7210 SAS platforms as described in this document, including platforms configured in the access-uplink operating mode.
Description
This command sets the specified Ethernet ring path into a blocked state.
Parameters
- ring-index
Specifies the ring index of the Ethernet ring.
- path {a | b}
Specifies the path of the Ethernet ring.
lag
Syntax
lag
Context
tools>perform
Platforms
Supported on all 7210 SAS platforms as described in this document
Description
This command configures tools to control LAG.
clear-force
Syntax
clear-force lag-id lag-id [sub-group sub-group-id]
clear-force all-mc
clear-force peer-mc ip-address
Context
tools>perform>lag
Platforms
Supported on all 7210 SAS platforms as described in this document, including platforms configured in the access-uplink operating mode.
Description
This command clears a forced status.
Parameters
- lag-id lag-id
Specifies an existing LAG ID.
- all-mc
Clears all multi-chassis LAG information.
force
Syntax
force lag-id lag-id [sub-group sub-group-id] {active | standby}
force all-mc {active | standby}
force peer-mc peer-ip-address {active | standby}
Context
tools>perform>lag
Platforms
Supported on all 7210 SAS platforms as described in this document, including platforms configured in the access-uplink operating mode.
Description
This command forces an active or standby status.
Parameters
- active
Forces all drives on the active CPM.
- all-mc
Clears all multi-chassis LAG information.
- peer-mc
Clears multi-chassis LAG peer information.
- standby
Forces all drives on the standby CPM.
- lag-id lag-id
Specifies an existing LAG ID.
log
Syntax
log
Context
tools>perform
Platforms
Supported on all 7210 SAS platforms as described in this document, including platforms configured in the access-uplink operating mode.
Description
This command is logs events.
test-event
Syntax
test-event
Context
tools>perform>log
Platforms
Supported on all 7210 SAS platforms as described in this document, including platforms configured in the access-uplink operating mode.
Description
This command causes a test event to be generated. The test event is LOGGER event #2011 and maps to the tmnxEventSNMP trap in the TIMETRA-LOG-MIB.
redundancy
Syntax
redundancy
Context
tools>perform
Platforms
7210 SAS-R6 and 7210 SAS-R12
Description
Commands in this context configure redundancy parameters.
issu-post-process
Syntax
issu-post-process
Context
tools>perform>redundancy
Platforms
7210 SAS-R6 and 7210 SAS-R12
Description
This command forces the MPLS module to exit maintenance mode, and therefore resume signaling new LSP paths, before major or minor ISSU is completed.
When the system starts major or minor ISSU procedures, MPLS is automatically put into maintenance mode such that existing LSP paths continue to operate while the node does not issue new LSP paths or a Make-Before-Break (MBB) path for existing LSPs. It also rejects requests for new LSP paths or MBB paths of existing LSPs coming from RSVP neighbors.
The MPLS module automatically exits maintenance mode when the major or minor ISSU is completed. As such this command must only be used if the user encounters MPLS issues during the ISSU process.
interface
Syntax
interface [ip-int-name | ip-address]
Context
tools>dump>router>ldp
Platforms
Supported on all 7210 SAS platforms as described in this document
Description
This command displays information for an LDP interface.
Parameters
- ip-int-name
Specifies the interface name.
- ip-address
Specifies the IP address.
ldp
Syntax
ldp
Context
tools>dump>router
Platforms
Supported on all 7210 SAS platforms as described in this document
Description
This command enables dump tools for LDP.
peer
Syntax
peer ip-address
Context
tools>dump>router>ldp
Platforms
Supported on all 7210 SAS platforms as described in this document
Description
This command displays information for an LDP peer.
Parameters
- ip-address
Specifies the IP address.
fec
Syntax
fec p2mp-id id root ip-address [detail]
fec prefix [ip-prefix/mask]
fec vc-type {ethernet | vlan} vc-id vc-id
Context
tools>dump>router>ldp
Platforms
Supported on all 7210 SAS platforms as described in this document
Description
This command displays information for an LDP FEC.
Parameters
- p2mp-id id
Specifies the LDP active P2MP identifier bindings to dump. This parameter is supported only on the 7210 SAS-Mxp, 7210 SAS-R6, 7210 SAS-R12, 7210 SAS-Sx/S 1/10GE (standalone and standalone-VC), and 7210 SAS-T.
- root ip-address
Specifies the root IP address to dump.
- detail
Dumps detailed LDP active P2MP identifier bindings information or detailed root IP address information.
- ip-prefix/mask
Specifies the IP prefix and host bits.
- vc-type
Specifies the VC type signaled for the spoke or mesh binding to the far end of an SDP. The VC type is a 15 bit-quantity containing a value which represents the type of VC. The actual signaling of the VC type depends on the signaling parameter defined for the SDP. If signaling is disabled, the vc-type command can still be used to define the Dot1q value expected by the far-end provider equipment. A change of the binding’s VC type causes the binding to signal the new VC type to the far end when signaling is enabled.
VC types are derived according to IETF draft-martini-l2circuit-trans-mpls.
Ethernet — The VC type value for Ethernet is 0x0005.
VLAN — The VC type value for an Ethernet VLAN is 0x0004.
- vc-id
Specifies the virtual circuit identifier.
memory-usage
Syntax
memory-usage
Context
tools>dump>router>ldp
Platforms
Supported on all 7210 SAS platforms as described in this document
Description
This command displays memory usage information for LDP.
session
Syntax
session [ip-address |:label space] [connection | peer | adjacency]
Context
tools>dump>router>ldp
Platforms
Supported on all 7210 SAS platforms as described in this document
Description
This command displays information for an LDP session.
Parameters
- ip-address
Specifies the IP address of the LDP peer.
- label-space
Specifies the label space identifier that the router is advertising on the interface.
- connection
Displays connection information.
- peer
Displays peer information.
- adjacency
Displays hello adjacency information.
sockets
Syntax
sockets
Context
tools>dump>router>ldp
Platforms
Supported on all 7210 SAS platforms as described in this document
Description
This command displays information for all sockets being used by the LDP protocol.
timers
Syntax
timers
Context
tools>dump>router>ldp
Platforms
Supported on all 7210 SAS platforms as described in this document
Description
This command displays timer information for LDP.
mpls
Syntax
mpls
Context
tools>dump>router
Platforms
Supported on all 7210 SAS platforms as described in this document
Description
Commands in this context display MPLS information.
ftn
Syntax
ftn
Context
tools>dump>router>mpls
Platforms
Supported on all 7210 SAS platforms as described in this document
Description
This command displays FEC-to-NHLFE (FTN) dump information for MPLS. (NHLFE is the acronym for Next Hop Label Forwarding Entry.)
ilm
Syntax
ilm
Context
tools>dump>router>mpls
Platforms
Supported on all 7210 SAS platforms as described in this document
Description
This command displays incoming label map (ILM) information for MPLS.
lspinfo
Syntax
lspinfo [lsp-name] [detail]
Context
tools>dump>router>mpls
Platforms
Supported on all 7210 SAS platforms as described in this document
Description
This command displays label switched path (LSP) information for MPLS.
Parameters
- lsp-name
Specifies the name that identifies the LSP. The LSP name can be up to 32 characters and must be unique.
- detail
Displays detailed information about the LSP.
cspf
Syntax
cspf to ip-addr [from ip-addr] [strict-srlg] [srlg-group grp-id...(up to 8 max)] [bandwidth bandwidth] [include-bitmap bitmap] [exclude-bitmap bitmap] [hop-limit limit] [exclude-address excl-addr [excl-addr...(upto 8 max)]] [use-te-metric] [exclude-node excl-node-id [excl-node-id...(upto 8 max)]] [skip-interface interface-name]
Context
tools>perform>router>mpls
Platforms
Supported on all 7210 SAS platforms as described in this document
Description
This command computes a CSPF path with specified user constraints.
Parameters
- to ip-addr
Specifies the destination IP address.
- from ip-addr
Specifies the originating IP address.
- srlg-group grp-id
Specifies the group ID.
- bandwidth bandwidth
Specifies the amount of bandwidth in mega-bits per second (Mbps) to be reserved.
- include-bitmap bitmap
Specifies to include a bit-map that lists admin groups that should be included during setup.
- exclude-bitmap bitmap
Specifies to exclude a bit-map that lists admin groups that should be included during setup.
- hop-limit limit
Specifies the total number of hops a detour LSP can take before merging back onto the main LSP path.
- exclude-address ip-addr
Specifies an IP address to exclude from the operation.
- use-te-metric
Specifies whether the TE metric is used for the purpose of the LSP path computation by CSPF.
- skip-interface interface-name
Specifies a local interface name, instead of the interface address, to be excluded from the CSPF computation.
force-switch-path
Syntax
force-switch-path lsp lsp-name path path-name
no force-switch-path lsp lsp-name
Context
tools>perform>router>mpls
Platforms
Supported on all 7210 SAS platforms as described in this document
Description
This command configures a forced path switch.
switch-path
Syntax
switch-path lsp lsp-name path path-name
Context
tools>perform>router>mpls
Platforms
Supported on all 7210 SAS platforms as described in this document
Description
This command moves from a standby (or an active secondary) to another standby of the same priority. If a new standby path with a higher priority or a primary path comes up after the tools perform command is executed, the path re-evaluation command runs and the path is moved to the path specified by the outcome of the re-evaluation.
Parameters
- lsp-name
Specifies an existing LSP name to move.
- path-name
Specifies the path name to which to move the specified LSP.
trap-suppress
Syntax
trap-suppress [number-of-traps] [time-interval]
Context
tools>perform>router>mpls
Platforms
Supported on all 7210 SAS platforms as described in this document
Description
This command modifies thresholds for trap suppression.
Parameters
- number-of-traps
Specify the number of traps in multiples of 100. An error messages is generated if an invalid value is entered.
- time-interval
Specifies the timer interval in seconds.
tp-tunnel
Syntax
tp-tunnel
Context
tools>perform>router>mpls
Platforms
Supported on all 7210 SAS platforms as described in this document
Description
Commands in this context perform linear protection operations on an MPLS-TP LSP.
clear
Syntax
clear {lsp-name | id tunnel-id}
Context
tools>perform>router>mpls>tp-tunnel
Platforms
Supported on all 7210 SAS platforms as described in this document
Description
This command clears all the MPLS-TP linear protection operational commands for the specified LSP that are currently active.
Parameters
- lsp-name
Specifies the name of the MPLS-TP LSP.
- id tunnel-id
Specifies the tunnel number of the MPLS-TP LSP
force
Syntax
force {lsp-name | id tunnel-id}
Context
tools>perform>router>mpls>tp-tunnel
Platforms
Supported on all 7210 SAS platforms as described in this document
Description
This command performs a force switchover of the MPLS-TP LSP from the active path to the protect path.
Parameters
- lsp-name
Specifies the name of the MPLS-TP LSP.
- id tunnel-id
Specifies the tunnel number of the MPLS-TP LSP
manual
Syntax
manual {lsp-name | id tunnel-id}
Context
tools>perform>router>mpls>tp-tunnel
Platforms
Supported on all 7210 SAS platforms as described in this document
Description
This command performs a manual switchover of the MPLS-TP LSP from the active path to the protect path.
Parameters
- lsp-name
Specifies the name of the MPLS-TP LSP.
- id tunnel-id
Specifies the tunnel number of the MPLS-TP LSP
lockout
Syntax
lockout {lsp-name | id tunnel-id}
Context
tools>perform>router>mpls>tp-tunnel
Platforms
Supported on all 7210 SAS platforms as described in this document
Description
This command performs a lockout of protection for an MPLS-TP LSP. This prevents a switchover to the protect path.
Parameters
- lsp-name
Specifies the name of the MPLS-TP LSP.
- id tunnel-id
Specifies the tunnel number of the MPLS-TP LSP
memory-usage
Syntax
memory-usage
Context
tools>dump>router>mpls
Platforms
Supported on all 7210 SAS platforms as described in this document
Description
This command displays memory usage information for MPLS.
te-lspinfo
Syntax
te-lspinfo [endpoint ip-address] [sender ip-address] [lspid lsp-id] [detail]
te-lspinfo [endpoint ip-address] [sender ip-address] [lspid lsp-id] [detail]
Context
tools>dump>router>mpls
Platforms
Supported on all 7210 SAS platforms as described in this document
Description
This command displays TE LSP information for MPLS.
ospf
Syntax
ospf [ospf-instance]
Context
tools>dump>router
Platforms
Supported on all 7210 SAS platforms as described in this document
Description
Commands in this context display tools information for OSPF.
The number of OSPF instances supported on different 7210 platforms varies. Consult a Nokia representative for information about supported scaling limits.
Parameters
- ospf-instance
Specifies the OSPF instance.
abr
Syntax
abr [detail]
Context
tools>dump>router>ospf
Platforms
Supported on all 7210 SAS platforms as described in this document
Description
This command displays area border router (ABR) information for OSPF.
Parameters
- detail
Displays detailed information about the ABR.
asbr
Syntax
asbr [detail]
Context
tools>dump>router>ospf
Platforms
Supported on all 7210 SAS platforms as described in this document
Description
This command displays autonomous system border router (ASBR) information for OSPF.
Parameters
- detail
Displays detailed information about the ASBR.
bad-packet
Syntax
bad-packet [interface-name]
Context
tools>dump>router>ospf
Platforms
Supported on all 7210 SAS platforms as described in this document
Description
This command displays information about bad packets for OSPF.
Parameters
- interface-name
Displays only the bad packets identified by this interface name.
leaked-routes
Syntax
leaked-routes [summary | detail}
Context
tools>dump>router>ospf
Platforms
Supported on all 7210 SAS platforms as described in this document
Description
This command displays information about leaked routes for OSPF.
Default
summary
Parameters
- summary
Displays a summary of information about leaked routes for OSPF.
- detail
Displays detailed information about leaked routes for OSPF.
memory-usage
Syntax
memory-usage [detail]
Context
tools>dump>router>ospf
Platforms
Supported on all 7210 SAS platforms as described in this document
Description
This command displays memory usage information for OSPF.
Parameters
- detail
Displays detailed information about memory usage for OSPF.
request-list
Syntax
request-list [neighbor ip-address] [detail]
request-list virtual-neighbor ip-address area-id area-id [detail]
Context
tools>dump>router>ospf
Platforms
Supported on all 7210 SAS platforms as described in this document
Description
This command displays request list information for OSPF.
Parameters
- neighbor ip-address
Specifies the IP address for the neighbor.
- detail
Displays detailed information about the neighbor.
- virtual-neighbor ip-address
Specifies the IP address of the virtual neighbor.
- area-id area-id
Specifies the OSPF area ID expressed in dotted decimal notation or as a 32-bit decimal integer.
retransmission-list
Syntax
retransmission-list [neighbor ip-address] [detail]
retransmission-list virtual-neighbor ip-address area-id area-id [detail]
Context
tools>dump>router>ospf
Platforms
Supported on all 7210 SAS platforms as described in this document
Description
This command displays dump retransmission list information for OSPF.
Parameters
- neighbor ip-address
Specifies the IP address for the neighbor.
- detail
Displays detailed information about the neighbor.
- virtual-neighbor ip-address
Specifies the IP address of the virtual neighbor.
- area-id area-id
Specifies the OSPF area ID expressed in dotted-decimal notation or as a 32-bit decimal integer.
route-summary
Syntax
route-summary
Context
tools>dump>router>ospf
Platforms
Supported on all 7210 SAS platforms as described in this document
Description
This command displays dump route summary information for OSPF.
route-table
Syntax
route-table ip-prefix/mask [type] [detail]
Context
tools>dump>router>ospf
Platforms
Supported on all 7210 SAS platforms as described in this document
Description
This command displays dump information about routes learned through OSPF.
Parameters
- type
Specifies the type of route table information to display.
- detail
Displays detailed information about learned routes.
ospf3
Syntax
ospf3
Context
tools>dump>router
Platforms
Supported on all 7210 SAS platforms as described in this document
Description
Commands in this context display tools information for OSPF3.
refresh-lsas
Syntax
refresh-lsas [lsa-type] [area-id]
Context
tools>perform>router>ospf
tools>perform>router>ospf3
Platforms
Supported on all 7210 SAS platforms as described in this document
Description
This command refreshes LSAs for OSPF.
Parameters
- lsa-type
Specifies the LSA type using allow keywords.
- area-id
Specifies the OSPF area ID expressed in dotted-decimal notation or as a 32-bit decimal integer.
run-manual-spf
Syntax
run-manual-spf externals-only
Context
tools>perform>router>ospf
tools>perform>router>ospf3
Platforms
Supported on all 7210 SAS platforms as described in this document
Description
This command runs the Shortest Path First (SPF) algorithm.
Parameters
- externals-only
Specifies the route preference for OSPF external routes.
rsvp
Syntax
rsvp
Context
tools>dump>router
Platforms
Supported on all 7210 SAS platforms as described in this document
Description
Commands in this context display RSVP information.
psb
Syntax
psb [endpoint endpoint-address] [sender sender-address] [tunnelid tunnel-id] [lspid lsp-id]
Context
tools>dump>router>rsvp
Platforms
Supported on all 7210 SAS platforms as described in this document
Description
This command displays path state block (PSB) information for RSVP.
When a PATH message arrives at an LSR, the LSR stores the label request in the local PSB for the LSP. If a label range is specified, the label allocation process must assign a label from that range.
The PSB contains the IP address of the previous hop, the session, the sender, and the TSPEC. This information is used to route the corresponding RESV message back to LSR 1.
Parameters
- endpoint endpoint-address
Specifies the IP address of the last hop.
- sender sender-address
Specifies the IP address of the sender.
- tunnelid tunnel-id
Specifies the SDP ID.
- lspid lsp-id
Specifies the label switched path that is signaled for this entry.
Output
Sample outputA:Dut-A# config>router>mpls# tools dump router rsvp psb detail
-----------------------------------------------------------------------
PSB:
P2P: Session (To: 10.20.1.4 - 61441 - 10.20.1.1), Sender (10.20.1.1 -
2) PHop 255.255.255.255
PSB CurrState: BACKUPS_CONNECTED PrevState: BACKUPS_INIT Flags: 0x0
LocalLabel 0 OutLabel 131070
Incoming IfIndex: Interface: Local API(-1)
Refresh interval 0, Send Path refresh in 3 secs, Path Refresh timeout
0 secs
PrevHop: Ctype 1 Addr 255.255.255.255, LIH 0
DnStream Nbr: Addr-> 10.20.1.3 IfIndex ip-10.10.2.1(3)
UpStream Neighbor is NULLP
Session Attribute:
Session Name: bypass-node10.20.1.2
HoldPri: 0 SetupPri: 7 Flags: 0x2
Ctype: 7, IncludeGroup: 0x0 IncludeAllGroup: 0x0 ExcludeGroup: 0x0
ClassType: Absent
TSpec: Flags 0x8000 QOSC 0, PDR (infinity), PBS 0.000 bps, CDR (0.000
bps) MTU: 0
CSPF Hop List: ->
(1) UnnumIfId 3 RtrId 10.20.1.1 EgrAdmGrp 0x0 (Strict)
(2) UnnumIfId 2 RtrId 10.20.1.3 EgrAdmGrp 0x0 (Strict)
(3) UnnumIfId 5 RtrId 10.20.1.4 EgrAdmGrp 0x0 (Strict)
PSB RRO : ->
(1) * Flags : 0x0 : U
(1) * UnInf : 10.20.1.1, 3
PSB SENT RRO : ->
(1) * Flags : 0x0 : U
(1) * UnInf : 10.20.1.1, 3
PSB FILTERSPEC RRO : ->
(1) * Flags : 0x0 : U
(1) * UnInf : 10.20.1.3, 2
(2) * Flags : 0x1 : Global
(2) * Label : 131070
(3) * Flags : 0x0 : U
(3) * UnInf : 10.20.1.4, 5
(4) * Flags : 0x1 : Global
(4) * Label : 131070
PSB ERO : ->
(1) Unnumbered RouterId 10.20.1.1, LinkId 3, Strict
(2) Unnumbered RouterId 10.20.1.3, LinkId 2, Strict
(3) Unnumbered RouterId 10.20.1.4, LinkId 5, Strict
PSB SENT ERO : ->
(1) Unnumbered RouterId 10.20.1.3, LinkId 2, Strict
(2) Unnumbered RouterId 10.20.1.4, LinkId 5, Strict
SendTempl: Sender:10.20.1.1_2
AdSpec Present - Flags: 0x0
AdSpec General
- Service Break bit : 0x0
- IS Hop Count : 0x0
- Path Bandwidth Estimate : 0x0
- Minimum Path latency : 0x0
- Composed path MTU : 0
Num Paths Received :0
Num Paths Transmitted:5
Num Resvs Received :8
Num Resvs Transmitted:0
Num Summmary Paths Received :0
Num Summmary Paths Transmitted:0
Num Summmary Resvs Received :0
Num Summmary Resvs Transmitted:0
Created at 91359 (26 secs back)
-----------------------------------------------------------------------
-----------------------------------------------------------------------
PSB:
P2P: Session (To: 10.20.1.6 - 1 - 10.20.1.1), Sender (10.20.1.1 -
30208) PHop 0.0.0.0
PSB CurrState: PRIMARYS_CONNECTED PrevState: PRIMARYS_INIT Flags: 0x8
LocalLabel 0 OutLabel 131071
Incoming IfIndex: Interface: Local API(-1)
Refresh interval 5, Send Path refresh in 4 secs, Path Refresh timeout
0 secs
PrevHop: Ctype 1 Addr 0.0.0.0, LIH 0
DnStream Nbr: Addr-> 10.20.1.2 IfIndex ip-10.10.1.1(2)
UpStream Neighbor is NULLP
Session Attribute:
Session Name: 1::1
HoldPri: 0 SetupPri: 7 Flags: 0x17
Ctype: 7, IncludeGroup: 0x0 IncludeAllGroup: 0x0 ExcludeGroup: 0x0
ClassType: Absent
TSpec: Flags 0x8000 QOSC 1, PDR (infinity), PBS 0.000 bps, CDR (0.000
bps) MTU: 0
CSPF Hop List: ->
(1) UnnumIfId 2 RtrId 10.20.1.1 EgrAdmGrp 0x0 (Strict)
(2) UnnumIfId 2 RtrId 10.20.1.2 EgrAdmGrp 0x0 (Strict)
(3) UnnumIfId 2 RtrId 10.20.1.4 EgrAdmGrp 0x0 (Strict)
(4) UnnumIfId 2 RtrId 10.20.1.6 EgrAdmGrp 0x0 (Strict)
PSB RRO : ->
(1) * Flags : 0x9 : U LP_AVAIL NODE
(1) * UnInf : 10.20.1.1, 2
PSB SENT RRO : ->
(1) * Flags : 0x0 : U
(1) * UnInf : 10.20.1.1, 2
PSB FILTERSPEC RRO : ->
(1) * Flags : 0x9 : U LP_AVAIL NODE
(1) * UnInf : 10.20.1.2, 2
(2) * Flags : 0x1 : Global
(2) * Label : 131071
(3) * Flags : 0x1 : U LP_AVAIL
(3) * UnInf : 10.20.1.4, 2
(4) * Flags : 0x1 : Global
(4) * Label : 131071
(5) * Flags : 0x0 : U
(5) * UnInf : 10.20.1.6, 2
(6) * Flags : 0x1 : Global
(6) * Label : 131071
PSB ERO : ->
(1) Unnumbered RouterId 10.20.1.2, LinkId 2, Strict
(2) Unnumbered RouterId 10.20.1.4, LinkId 2, Strict
(3) Unnumbered RouterId 10.20.1.6, LinkId 2, Strict
PSB SENT ERO : ->
(1) Unnumbered RouterId 10.20.1.2, LinkId 2, Strict
(2) Unnumbered RouterId 10.20.1.4, LinkId 2, Strict
(3) Unnumbered RouterId 10.20.1.6, LinkId 2, Strict
SendTempl: Sender:10.20.1.1_30208
AdSpec not present
FRR: Flags 0x2 HopLimit 16 SetupPri 7 HoldPri 0 IncludeAny 0x0
ExcludeAny 0x0 IncludeAll 0x0
PLR: Flag (0x166) State PLRS_BYPASS_UP AvoidNodeId 10.20.1.2 inIntf -1
inLabel 0
PLR: FRRRequestCount: 1 CSPFFailures: 0 ProtectionType: NodeProtect
Num Paths Received :0
Num Paths Transmitted:5
Num Resvs Received :5
Num Resvs Transmitted:0
Num Summmary Paths Received :0
Num Summmary Paths Transmitted:0
Num Summmary Resvs Received :0
Num Summmary Resvs Transmitted:0
Created at 91359 (28 secs back)
-----------------------------------------------------------------------
Total PSB Count : 2
A:Dut-A# config>router>mpls#
rsb
Syntax
rsb [endpoint endpoint-address] [sender sender-address] [tunnelid tunnel-id] [lspid lsp-id]
Context
tools>dump>router>rsvp
Platforms
Supported on all 7210 SAS platforms as described in this document
Description
This command displays RSVP Reservation State Block (RSB) information.
Parameters
- endpoint endpoint-address
Specifies the IP address of the last hop.
- sender sender-address
Specifies the IP address of the sender.
- tunnelid tunnel-id
Specifies the SDP ID.
- lspid lsp-id
Specifies the label switched path that is signaled for this entry.
Output
Sample outputA:Dut-A# config>router>mpls# tools dump router rsvp rsb detail
-----------------------------------------------------------------------
RSB:
EndPt 10.20.1.4 Tid 61441 XTid 10.20.1.1 Sndr 10.20.1.1 LspId 2
ifIndex 3 NHop 20.20.1.3
Style FF, refresh in 0 secs
RSVP NextHop 20.20.1.3, LIH 3 (TLV: RtrId 10.20.1.3 IntfId 2)
CT Shared Reservation Info:
No Reservation:
FlowSpec :Flags 0x8000 QOSC 1, PDR (infinity), PBS 0.000 bps, CDR
(0.000 bps)
CBS 0, EBS 0, RSpecR 0, RSpecS 0 MTU 1500 MPU 20
FwdFlowspec :Flags 0x0 QOSC 0, PDR (0.000 bps), PBS 0.000 bps, CDR
(0.000 bps)
CBS 0, EBS 0, RSpecR 0, RSpecS 0 MPU 0
FilterSpec:
Timeout in : 26 secs, LocLabel: 0 Sender: 10.20.1.1 lspId: 2 OutIfId:
0
RRO :
(1) * Flags : 0x0 : U
(1) * UnInf : 10.20.1.3, 2
(2) * Flags : 0x1 : Global
(2) * Label : 131070
(3) * Flags : 0x0 : U
(3) * UnInf : 10.20.1.4, 5
(4) * Flags : 0x1 : Global
(4) * Label : 131070
-----------------------------------------------------------------------
-----------------------------------------------------------------------
RSB:
EndPt 10.20.1.6 Tid 1 XTid 10.20.1.1 Sndr 0.0.0.0 LspId 0 ifIndex
2 NHop 20.20.1.2
Style SE, refresh in 0 secs
RSVP NextHop 20.20.1.2, LIH 2 (TLV: RtrId 10.20.1.2 IntfId 2)
CT Shared Reservation Info:
No Reservation:
FlowSpec :Flags 0x8000 QOSC 1, PDR (infinity), PBS 0.000 bps, CDR
(0.000 bps)
CBS 0, EBS 0, RSpecR 0, RSpecS 0 MTU 1496 MPU 20
FwdFlowspec :Flags 0x0 QOSC 0, PDR (0.000 bps), PBS 0.000 bps, CDR
(0.000 bps)
CBS 0, EBS 0, RSpecR 0, RSpecS 0 MPU 0
FilterSpec:
Timeout in : 21 secs, LocLabel: 0 Sender: 10.20.1.1 lspId: 30208
OutIfId: 0
RRO :
(1) * Flags : 0x9 : U LP_AVAIL NODE
(1) * UnInf : 10.20.1.2, 2
(2) * Flags : 0x1 : Global
(2) * Label : 131071
(3) * Flags : 0x1 : U LP_AVAIL
(3) * UnInf : 10.20.1.4, 2
(4) * Flags : 0x1 : Global
(4) * Label : 131071
(5) * Flags : 0x0 : U
(5) * UnInf : 10.20.1.6, 2
(6) * Flags : 0x1 : Global
(6) * Label : 131071
-----------------------------------------------------------------------
Total RSB Count : 2
A:Dut-A# config>router>mpls#
tcsb
Syntax
tcsb [endpoint endpoint-address] [sender sender-address] [tunnelid tunnel-id] [lspid lsp-id]
Context
tools>dump>router>rsvp
Platforms
Supported on all 7210 SAS platforms as described in this document
Description
This command displays RSVP traffic control state block (TCSB) information.
Parameters
- endpoint endpoint-address
Specifies the IP address of the egress node for the tunnel supporting this session.
- sender sender-address
Specifies the IP address of the sender node for the tunnel supporting this session. It is derived from the source address of the associated MPLS LSP definition.
- tunnelid tunnel-id
Specifies the IP address of the ingress node of the tunnel supporting this RSVP session.
- lspid lsp-id
Specifies the label switched path that is signaled for this entry.
static-route
Syntax
static-route ldp-sync-status
Context
tools>dump>router
Platforms
Supported on all 7210 SAS platforms as described in this document
Description
This command displays the synchronization status of LDP interfaces that static route keeps track of.
Dump service commands
service
Syntax
service
Context
tools>dump
Platforms
Supported on all 7210 SAS platforms as described in this document
Description
This command configures tools to display service dump information.
base-stats
Syntax
base-stats [clear]
Context
tools>dump>service
Platforms
Supported on all 7210 SAS platforms as described in this document, including platforms configured in the access-uplink operating mode.
Description
This command displays internal service statistics.
Parameters
- clear
Clears stats after reading.
dpipe
Syntax
dpipe service-id
Context
tools>dump>service
Platforms
Supported on all 7210 SAS platforms as described in this document, including platforms configured in the access-uplink operating mode.
Description
This command displays debug information for a specified service.
Parameters
- service-id
Specifies the service ID.
dtls
Syntax
dtls service-id
Context
tools>dump>service
Platforms
Supported on all 7210 SAS platforms as described in this document, including platforms configured in the access-uplink operating mode.
Description
This command displays TLS service statistics.
Parameters
- service-id
Specifies the service ID.
iom-stats
Syntax
iom-stats [clear]
Context
tools>dump>service
Platforms
Supported on all 7210 SAS platforms as described in this document
Description
This command displays IOM message statistics.
Parameters
- clear
Clears the statistics after reading.
l2pt-diags
Syntax
l2pt-diags
l2pt-diags clear
l2pt-diags detail
Context
tools>dump>service
Platforms
Supported on all 7210 SAS platforms as described in this document, including platforms configured in the access-uplink operating mode.
Description
This command displays L2pt diagnostics.
Parameters
- clear
Clears the diagnostics after reading.
- detail
Displays detailed information.
Output
Sample outputA:ALA-48>tools>dump>service# l2pt-diags
[ l2pt/bpdu error diagnostics ]
Error Name | Occurence | Event log
-----------------+-------------+-----------------------------
[ l2pt/bpdu forwarding diagnostics ]
Rx Frames | Tx Frames | Frame Type
------------+-------------+----------------------------------
A:ALA-48>tools>dump>service#
A:ALA-48>tools>dump>service# l2pt-diags detail
[ l2pt/bpdu error diagnostics ]
Error Name | Occurence | Event log
-----------------+-------------+-----------------------------
[ l2pt/bpdu forwarding diagnostics ]
Rx Frames | Tx Frames | Frame Type
------------+-------------+----------------------------------
[ l2pt/bpdu config diagnostics ]
WARNING - service 700 has l2pt termination enabled on all access points :
consider translating further down the chain or turning it off.
WARNING - service 800 has l2pt termination enabled on all access points :
consider translating further down the chain or turning it off.
WARNING - service 9000 has l2pt termination enabled on all access points :
consider translating further down the chain or turning it off.
WARNING - service 32806 has l2pt termination enabled on all access points :
consider translating further down the chain or turning it off.
WARNING - service 90001 has l2pt termination enabled on all access points :
consider translating further down the chain or turning it off.
A:ALA-48>tools>dump>service#
vpls-fdb-stats
Syntax
vpls-fdb-stats [clear]
Context
tools>dump>service
Platforms
Supported on all 7210 SAS platforms as described in this document, including platforms configured in the access-uplink operating mode.
Description
This command displays VPLS FDB statistics.
Parameters
- clear
Clears the statistics after reading.
vpls-mfib-stats
Syntax
vpls-mfib-stats [clear]
Context
tools>dump>service
Platforms
Supported on all 7210 SAS platforms as described in this document, including platforms configured in the access-uplink operating mode.
Description
This command displays VPLS MFIB statistics.
Parameters
- clear
Clears statistics after reading.
Performance commands
perform
Syntax
perform
Context
tools
Platforms
Supported on all 7210 SAS platforms as described in this document
Description
Commands in this context enable tools to perform specific tasks.
cron
Syntax
cron
Context
tools>perform>system
Platforms
Supported on all 7210 SAS platforms as described in this document, including platforms configured in the access-uplink operating mode.
Description
Commands in this context perform CRON (scheduling) control operations.
tod
Syntax
tod
Context
tools>perform>system>cron
Platforms
Supported on all 7210 SAS platforms as described in this document, including platforms configured in the access-uplink operating mode.
Description
This command enables the context for tools for controlling time-of-day actions.
re-evaluate
Syntax
re-evaluate
Context
tools>perform>system>cron>tod
Platforms
Supported on all 7210 SAS platforms as described in this document, including platforms configured in the access-uplink operating mode.
Description
Commands in this context re-evaluate the time-of-day state.
customer
Syntax
customer customer-id [site customer-site-name]
Context
tools>perform>system>cron>tod>re-eval
Platforms
Supported on all 7210 SAS platforms as described in this document, including platforms configured in the access-uplink operating mode.
Description
This command reevaluates the time-of-day state of a multi-service site.
Parameters
- customer-id
Specifies an existing customer ID.
- site customer-site-name
Specifies an existing customer site name.
filter
Syntax
filter ip-filter [filter-id]
filter ipv6-filter [filter-id]
filter mac-filter [filter-id]
Context
tools>perform>system>cron>tod>re-eval
Platforms
Supported on all 7210 SAS platforms as described in this document, including platforms configured in the access-uplink operating mode.
Description
This command reevaluates the time-of-day state of a filter entry.
Parameters
- filter-type
Specifies the filter type.
- filter-id
Specifies an existing filter ID.
service
Syntax
service id service-id [sap sap-id]
Context
tools>perform>system>cron>tod>re-eval
Platforms
Supported on all 7210 SAS platforms as described in this document, including platforms configured in the access-uplink operating mode.
Description
This command reevaluates the time-of-day state of a SAP.
Parameters
- service-id
Specifies the an existing service ID.
- sap sap-id
Specifies the physical port identifier portion of the SAP definition. See Common CLI command descriptions for CLI command syntax.
tod-suite
Syntax
tod-suite tod-suite-name
Context
tools>perform>system>cron>tod>re-eval
Platforms
Supported on all 7210 SAS platforms as described in this document, including platforms configured in the access-uplink operating mode.
Description
This command reevaluates the time-of-day state for the objects referring to a ToD suite.
Parameters
- tod-suite-name
Specifies an existing ToD name.
system
Syntax
system
Context
tools>perform
Platforms
Supported on all 7210 SAS platforms as described in this document
Description
This command is a tool for controlling the system.
script-control
Syntax
script-control
Context
tools>perform>system
Platforms
Supported on all 7210 SAS platforms as described in this document, including platforms configured in the access-uplink operating mode.
Description
This command performs script-control operations.
script-policy
Syntax
script-policy
Context
tools>perform>system>script-control
Platforms
Supported on all 7210 SAS platforms as described in this document, including platforms configured in the access-uplink operating mode.
Description
This command performs script-policy operations.
stop
Syntax
stop [script-policy-name] [owner script-policy-owner] [all]
Context
tools>perform>system>script-control>script-policy
Platforms
Supported on all 7210 SAS platforms as described in this document, including platforms configured in the access-uplink operating mode.
Description
This command stops the execution of scripts.
Parameters
- script-policy-name
Specifies to only stop scripts with the specified.
- owner script-policy-owner
Specifies to only stop scripts that are associated with script-policies with the specified owner.
- all
Specifies to stop all running scripts.
ldp-sync-exit
Syntax
[no] ldp-sync-exit
Context
tools>perform>router>isis
tools>perform>router>ospf
tools>perform>router>ospf3
Platforms
Supported on all 7210 SAS platforms as described in this document
Description
This command restores the actual cost of an interface at any time. When this command is executed, IGP immediately advertises the actual value of the link cost for all interfaces which have the IGP-LDP synchronization enabled if the currently advertised cost is different.
run-manual-spf
Syntax
run-manual-spf
Context
tools>perform>router>isis
tools>perform>router>ospf
tools>perform>router>ospf3
Platforms
Supported on all 7210 SAS platforms as described in this document
Description
This command runs the Shortest Path First (SPF) algorithm or OSPF or IS-IS.
isis
Syntax
isis
Context
tools>perform>router
Platforms
Supported on all 7210 SAS platforms as described in this document
Description
Commands in this context configure tools to perform specific IS-IS tasks.
mpls
Syntax
mpls
Context
tools>perform>router
Platforms
Supported on all 7210 SAS platforms as described in this document
Description
Commands in this context perform specific MPLS tasks.
cspf
Syntax
cspf to ip-addr [from ip-addr] [bandwidth bandwidth] [include-bitmap bitmap] [exclude-bitmap bitmap] [hop-limit limit] [exclude-address excl-addr [excl-addr...(up to 8 max)]] [use-te-metric] [skip-interface interface-name] [ds-class-type class-type] [cspf-reqtype req-type]
Context
tools>perform>router>mpls
Platforms
Supported on all 7210 SAS platforms as described in this document
Description
This command computes a CSPF path with specified user constraints.
Parameters
- to ip-addr
Specifies the destination IP address.
- from ip-addr
Specifies the originating IP address.
- bandwidth bandwidth
Specifies the amount of bandwidth in mega-bits per second (Mbps) to be reserved.
- include-bitmap bitmap
Specifies to include a bit-map that lists admin groups that should be included during setup.
- exclude-bitmap bitmap
Specifies to exclude a bit-map that lists admin groups that should be included during setup.
- hop-limit limit
Specifies the total number of hops a detour LSP can take before merging back onto the main LSP path.
- exclude-address ip-addr
Specifies an IP address to exclude from the operation.
- use-te-metric
Specifies whether the TE metric would be used for the purpose of the LSP path computation by CSPF.
- skip-interface interface-name
Specifies a local interface name, instead of the interface address, to be excluded from the CSPF computation.
resignal
Syntax
resignal lsp lsp-name path path-name delay minutes
resignal {p2mp-lsp p2mp-lsp-name p2mp-instance p2mp-instance-name | p2mp-delay p2mp-minutes}
Context
tools>perform>router>mpls
Platforms
Supported on all 7210 SAS platforms as described in this document
Description
This command resignals a specific LSP path.
Parameters
- lsp lsp-name
Specifies a unique name, up to 64 characters, that identifies the LSP.
- path path-name
Specifies the name for the LSP path up, to 32 characters.
- delay minutes
Specifies the resignal delay in minutes.
- p2mp-lsp p2mp-lsp-name
Specifies an existing point-to-multipoint LSP name, up to 64 characters. This parameter is supported only on the 7210 SAS-Mxp, 7210 SAS-R6, 7210 SAS-R12, 7210 SAS-Sx/S 1/10GE (standalone and standalone-VC), and 7210 SAS-T.
- p2mp-instance p2mp-instance-name
Specifies a name, up to 32 characters, that identifies the P2MP LSP instance. This parameter is supported only on the 7210 SAS-Mxp, 7210 SAS-R6, 7210 SAS-R12, 7210 SAS-Sx/S 1/10GE (standalone and standalone-VC), and 7210 SAS-T.
- p2mp-delay p2mp-minutes
Specifies the delay time, in minutes. This parameter is supported only on the 7210 SAS-Mxp, 7210 SAS-R6, 7210 SAS-R12, 7210 SAS-Sx/S 1/10GE (standalone and standalone-VC), and 7210 SAS-T.
trap-suppress
Syntax
trap-suppress [number-of-traps] [time-interval]
Context
tools>perform>router>mpls
Platforms
Supported on all 7210 SAS platforms as described in this document
Description
This command modifies thresholds for trap suppression.
Parameters
- number-of-traps
Specifies the number of traps in multiples of 100. An error messages is generated if an invalid value is entered.
- time-interval
Specifies the timer interval, in seconds.
ospf
Syntax
ospf
Context
tools>perform>router
Platforms
Supported on all 7210 SAS platforms as described in this document
Description
Commands in this context perform specific OSPF tasks.
ldp-sync-exit
Syntax
[no] ldp-sync-exit
Context
tools>perform>router>isis
tools>perform>router>ospf
Platforms
Supported on all 7210 SAS platforms as described in this document
Description
This command restores the actual cost of an interface at any time. When this command is executed, IGP immediately advertises the actual value of the link cost for all interfaces which have the IGP-LDP synchronization enabled if the currently advertised cost is different.
service
Syntax
services
Context
tools>perform
Platforms
Supported on all 7210 SAS platforms as described in this document
Description
Commands in this context configure tools for services.
id
Syntax
id service-id
Context
tools>perform>service
Platforms
Supported on all 7210 SAS platforms as described in this document
Description
Commands in this context configure tools for a specific service.
Parameters
- service-id
Specifies an existing service ID.
endpoint
Syntax
endpoint endpoint-name
Context
tools>perform>service>id
Platforms
Supported on all 7210 SAS platforms as described in this document
Description
Commands in this context configure tools for a specific VLL service endpoint.
Parameters
- endpoint-name
Specifies an existing VLL service endpoint name.
force-switchover
Syntax
force-switchover sdp-id:vc-id
no force-switchover
Context
tools>perform>service>id
Platforms
Supported on all 7210 SAS platforms as described in this document
Description
This command forces a switch of the active spoke SDP for the specified service.
Parameters
- sdp-id:vc-id
Specifies an existing spoke SDP for the service.
Output
Sample outputA:Dut-B# tools perform service id 1 endpoint mcep-t1 force-switchover 221:1
*A:Dut-B# show service id 1 endpoint
===============================================================================
Service 1 endpoints
===============================================================================
Endpoint name : mcep-t1
Description : (Not Specified)
Revert time : 0
Act Hold Delay : 0
Ignore Standby Signaling : false
Suppress Standby Signaling : false
Block On Mesh Fail : true
Multi-Chassis Endpoint : 1
MC Endpoint Peer Addr : 10.1.1.3
Psv Mode Active : No
Tx Active : 221:1(forced)
Tx Active Up Time : 0d 00:00:17
Revert Time Count Down : N/A
Tx Active Change Count : 6
Last Tx Active Change : 02/14/2009 00:17:32
-------------------------------------------------------------------------------
Members
-------------------------------------------------------------------------------
Spoke-sdp: 221:1 Prec:1 Oper Status: Up
Spoke-sdp: 231:1 Prec:2 Oper Status: Up
================================================================================
*A:Dut-B#
eval-pw-template
Syntax
eval-pw-template
Context
tools>perform>service
Platforms
Supported on all 7210 SAS platforms as described in this document
Description
This command reevaluates the pseudowire template policy.
Parameters
- policy-id
Specifies the pseudowire template policy.
eval-expired-fec
Syntax
eval-expired-fec spoke-sdp-fec-id
eval-expired-fec all
Context
tools>perform>service>pw-routing
Platforms
Supported on all 7210 SAS platforms as described in this document
Description
This command resets the retry counter and retry timer for the specified spoke SDP and attempts to reestablish the spoke SDP.
spoke-sdp-fec-release
Syntax
spoke-sdp-fec-release global-id[:prefix[:ac-id]]
Context
tools>perform>service
Platforms
Supported on all 7210 SAS platforms as described in this document
Description
This command clears the MS-PW bindings associated with a particular SAII or TAII on an S-PE.
Parameters
- global-id
Specifies the global ID of either the SAII or TAII of the MS-PW to be released.
- prefix
Specifies the prefix of either the SAII or TAII of the MS-PW to be released.
- ac-id
Specifies the AC-ID of either the SAII or TAII of the MS-PW to be released.