Aggregated forwarding statistics in subscriber management
The aggregated number of forwarding bytes and packets per direction in the subscriber management environment is supported on the following levels:
outer VLAN
subscriber interface
group interface
In addition to forwarding bytes and packets, the outer VLAN statistics also include the number of subscribers hosts active on that VLAN.
Aggregated statistics collection is supported for the following scenarios:
all subscriber types such as IPoE, PPPoE, LAC/LNS, static, ARP, RS, data-triggered
all SAP types such as LAG, PW-SAP, MSAP, static SAPs
wholesaler and retailer models where the statistics are collected on retailer interfaces
subscribers on direct faceplate ports (breakouts or not), satellite ports, LAGs or PW-ports (fixed or FPE-based)
Statistics are aggregated for combined IPv4 and IPv6 traffic and are based on the subscriber queue and policer statistics. SAP queue statistics are excluded from the count.
When policers are deployed on egress, traffic flowing through them is also traversing a queue or a queue group to which the policer is associated. Policers are always associated with a queue or a queue group. To avoid double counting, statistics must be gathered only from a single entity in the chain (a policer or the next queue), but not both. The following is a list of supported egress deployments with policers that produce accurate aggregate statistics collection with no double counting:
policers attached to the default queue-group
policers attached to a specific queue-group
policers attached to the subscriber (local) queues
In this case, only policer statistics are included in aggregated statistics while the post-policer queue statistics are ignored. This means that if traffic is sent directly to this queue without first going through a policer (for example, traffic mapped through an FC directly to a queue), the traffic is omitted from the aggregated statistics.
HQoS-managed policers attached to the queue group (default or a specific group)
Traffic traversing HQoS-managed policers is accounted for in HQoS, while traffic traversing non-HQoS-managed policers is not included in HQoS-managed calculations. The queue groups must configure the no queues-hqos- manageable command to avoid double counting.
The no queues-hqos-manageable command prevents HQoS from using the queue group statistics in its calculation, and therefore, avoids double counting.
Egress statistics in relation to QoS deployment models shows an example of how egress statistics are used.

In Egress statistics in relation to QoS deployment models , the right side of the diagram represents traffic streams and their mapping to policers and queues according to the configuration statement shown on the left side. The four green lines represent traffic streams that are counted properly, and the two red lines represent the two streams that are counted incorrectly (they are either double counted, or not counted at all). The colored boxes numbered 1 through 6 represent a traffic stream with relevant classification fields. For example, the traffic stream in box 1 has the destination IP address set to 192.0.2.10 and DSCP value set to AF21.
The dark blue traffic stream (box 1) is classified by IP criteria (dst-ip 192.0.2.10 in entry 10), which has a higher evaluation priority than the classification using DSCP (DSCP=AF21). Traffic is matched directly to policer 1 and a default queue group after that, and not to queue 1 as DSCP=AF21 would suggest. Drops on the queue-group are reflected in forwarded statistics for policer 1.
The green traffic stream (box 2) is not classified by IP criteria (dst-ip 192.0.2.40 is outside any configured entry in the IP criteria). Instead, this traffic is classified using DSCP=BE which is mapped to FC ‛BE’ and then to policer 1. In terms of statistics, this case is identical to the previous case (1).
The grey traffic stream (box 3) is not classified by IP criteria (dst-ip 192.0.2.60 is outside any configured entry in the ip-criteria). Instead, this traffic is classified using DSCP=AF12 which is mapped to FC ‛l1’ and then to policer 1 followed by a local queue 1. In this case, only policer statistics are counted toward aggregated statistics. This is expected for accurate accounting (no double accounting).
The orange (box 4) traffic stream is not accounted for in the aggregated statistics. Classification is performed based on DSCP=AF21 which is mapped to FC ‛h1’ and then to queue 1. For the purpose of aggregated statistics collection, counters on queue 1 in this example are not collected because this queue is an explicitly configured post-policer queue (both policer 1 and 2 are fed into this queue by explicit configuration). This excludes queue counters from being counted in the aggregated statistics. While this is the wanted behavior when traffic is passed through a policer first, that is not the case here.
The brown (box 5) traffic steam is classified by IP criteria (entry 20). Traffic is mapped to policer 2 and then to local queue 1. Similar to case 3, aggregated statistics are properly counted in this example. Drops on the queue 1 are reflected in forwarded statistics for policer 2.
The light blue (box 6) traffic stream is classified by IP criteria (entry 30). Traffic is mapped to the policer 3 and the local post-policer queue which is derived from FC mapping (DSCP=EF to FC ‛ef’ to queue 2). This case is similar to dynamic policers. Aggregated statistics are not counted properly, because the mapping between the policer and the post-policer local queue is not explicit using the configuration but instead it is implicitly derived using FC. As a result, double counting occurs.
Statistics retention
The SR OS node preserves statistics from a subscriber even when the subscriber is disconnected, and the subscriber’s policers or queues are released. This prevents statistics fluctuation in relation to the subscriber’s presence and ensures that a statistic counter remains stable. After being counted on a VLAN, subscriber interface, or a group interface, the octet or packet remains accounted for during the life time of that VLAN, subscriber interface, or group interface. However, statistics can be manually cleared with the clear>subscr-mgmt>interface-statistics command.
Reporting absolute (or cumulative) counts in aggregated statistics allows smooth measurement of bandwidth per VLAN, subscriber interface, or group interface without dips caused by departing subscribers. The rate measurement can be performed externally by calculating the difference in byte count between two consecutive statistics polls, divided by the collection interval.
Sudden changes in rates can give an indication of a path failure in the network.
Simultaneous statistical monitoring for multiple entities
Statistics monitoring can be simultaneously enabled for all of the following entities:
VLANs
subscriber interfaces
group interfaces
The sum of monitored entities must not exceed 2,000.
Enabling aggregate statistics collection
Aggregate statistics collection is enabled by a configuration flag at a global level. The following shows the CLI configuration.
    configure
        subscriber-mgmt
            svlan-statistics
                [no] shutdown
            subscriber-interface-statistics
                [no] shutdown
            group-interface-statistics
                [no] shutdown
After aggregate statistics collection is enabled, the MIB table is populated automatically with the current VLAN, subscriber interface, or group interface entries, up to the supported limit.
MIBs
Aggregated statistics are provided in the form of a read-only MIB table for the currently active VLANs, subscriber interfaces, and group interfaces.
VLAN MIBs
The keys for the VLAN MIB table are the port ID (which can also be a LAG ID or PW port ID) and the VLAN ID. After the VLAN is instantiated (either statically or through MSAP), an entry is created in the MIB table.
When the VLAN is no longer present in the system, it is automatically removed from the table.
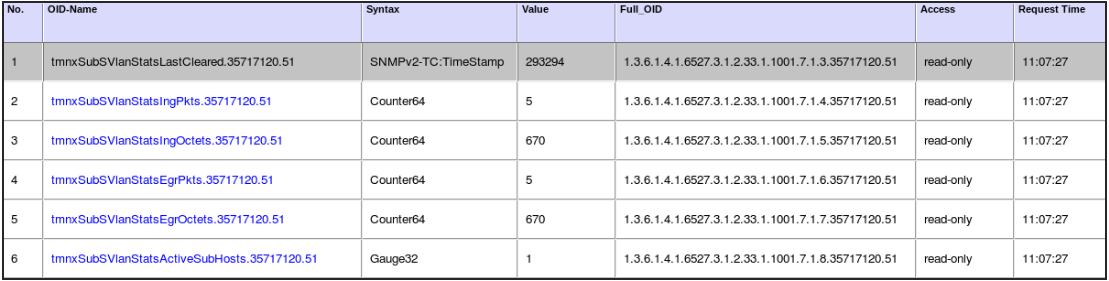
Each VLAN can be queried through SNMP either directly or as an SNMP walk, in which case, all entries in the table are read.
The MIB table name is tmnxSubSvlanStatsTable and has the format shown in tmnxSubSvlanStatsEntry objects with up to 2000 tmnxSubSvlanStatsEntry entries.
| Entry objects | |
|---|---|
Entry Keys Index |
tmnxSubSVlanStatsPort The port ID |
tmnxSubSVlanStatsVlan The VLAN ID |
|
Statistics |
tmnxSubSVlanStatsLastCleared The most recent time when the stats were cleared |
tmnxSubSVlanStatsIngPkts The number of packets forwarded on ingress |
|
Statistics (cont.) |
tmnxSubSVlanStatsIngOctets The number of octets forwarded on ingress |
tmnxSubSVlanStatsEgrPkts The number of packets forwarded on egress |
|
tmnxSubSVlanStatsEgrOctets The number of octets forwarded on egress |
|
tmnxSubSVlanStatsActiveSubHosts The number of subscriber hosts |
Subscriber interface and group interface MIBs
The key for aggregate statistics MIB table are the subscriber interface and group interface name and the router ID.
After the subscriber or group interface is created, it is placed as an entry in the MIB table. After the subscriber or group interface is no longer present in the system (removed or deleted), it is automatically deleted from the table.
Each subscriber or group interface can be directly queried through SNMP or an SNMP walk can be issued to read all the entries in the table.
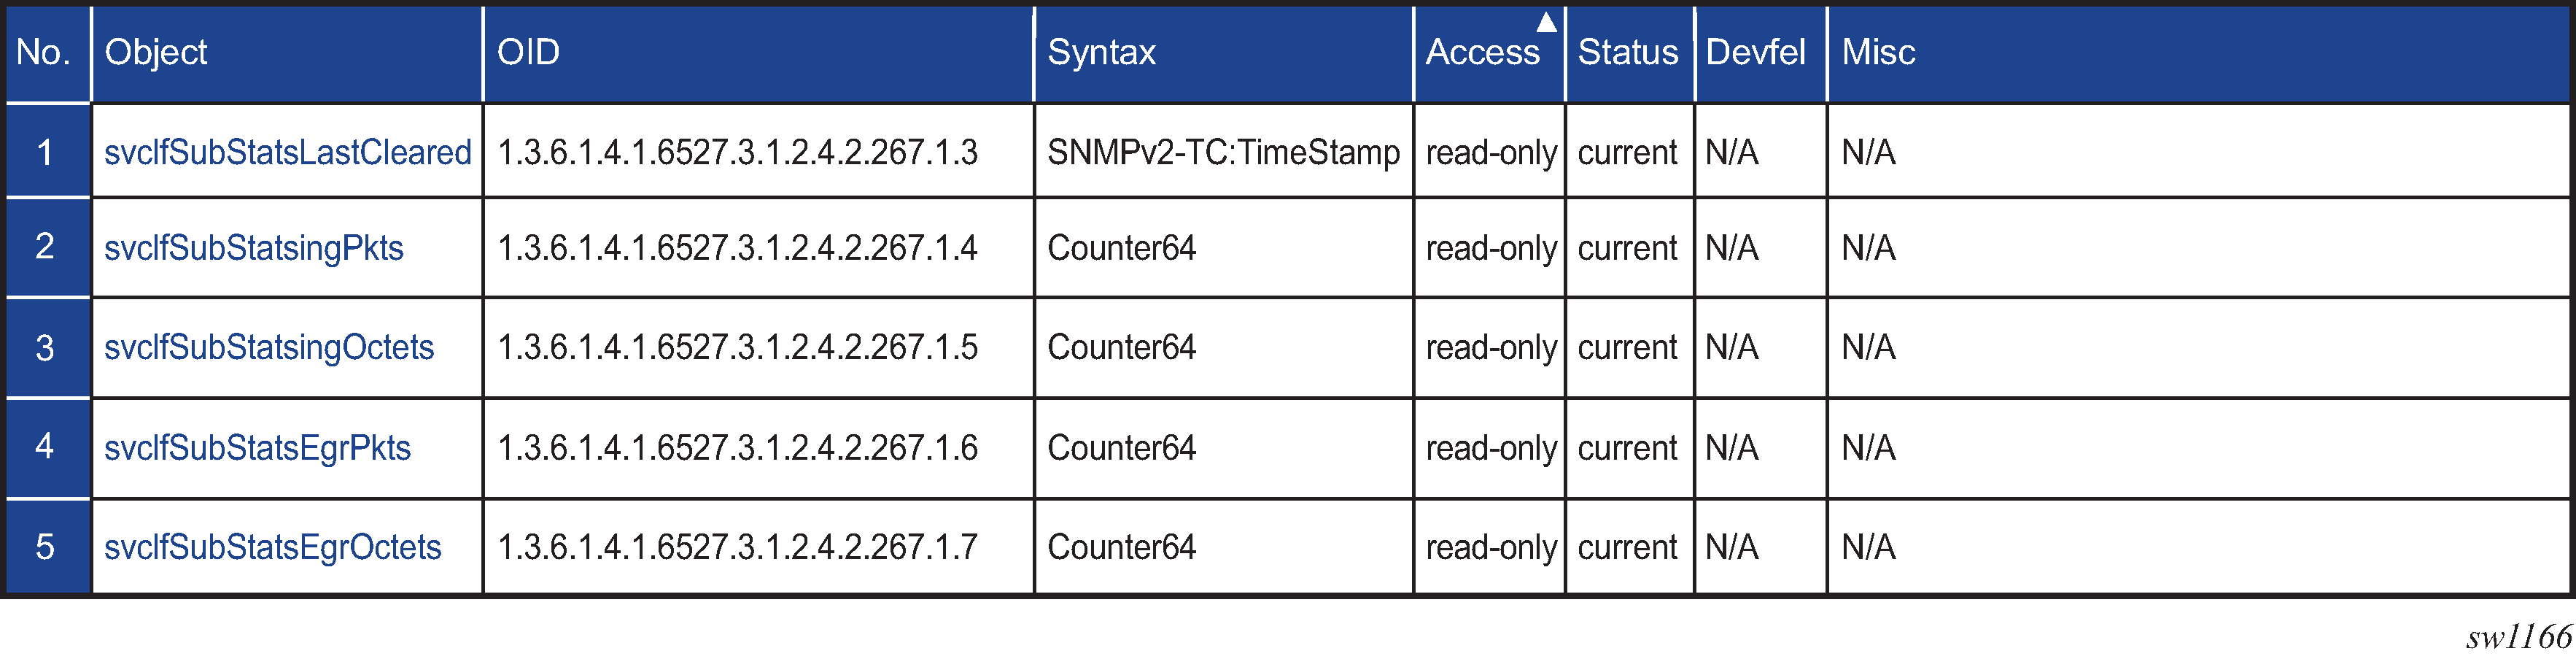
The MIB table name for the aggregated statistics under the subscriber and group interface is svcIfSubStatsTable and is described in svcIfSubStatsTable objects .
| Entry objects | |
|---|---|
Entry Keys Index |
iesIfIndex The subscriber or group interface name |
svcId The service ID |
|
Statistics |
svcIfSubStatsLastCleared The most recent time when the stats were cleared |
svcIfSubStatsIngPkts The number of packets forwarded on ingress |
|
svcIfSubStatsIngOctets The number of octets forwarded on ingress |
|
svcIfSubStatsEgrPkts The number of packets forwarded on egress |
|
svcIfSubStatsEgrOctets The number of octets forwarded on egress |