OAM monitoring and reporting
Several OAM fault and performance tools have been developed to monitor and report information about the network infrastructure and the services that rely on that infrastructure. Most technology-specific tools are categorized under one or more of the following scheduling and reporting functions:
-
Link measurement
This function performs IP delay measurement scheduling with direct reporting to the routing engine. This function influences the local routing sub system.
-
OAM Performance Monitoring (OAM-PM)
This function is an Ethernet, IP, and MPLS performance measurement architecture with scheduling, reporting, and delay streaming options. It is focused on northbound system collection.
-
Service Assurance Agent (SAA)
This function is an Ethernet, IP, and MPLS fault and performance measurement architecture with scheduling and reporting. It is focused on northbound system collection.
configure test-oam twamp twamp-light source-udp-port-pools portTo change a port allocation from one application to another, the port must not be configured under the application that currently owns the source UDP port. A source UDP port that is configured under the link measurement template or OAM-PM test session cannot be reassigned regardless of the administrative state.
-
tuple source IP
-
destination IP
-
source UDP port
-
destination UDP port
When executing tests between the same source IP, destination IP, and destination UDP port, the source UDP must be different. This means using a different configured source UDP port in the reserved range or allowing automatic source UDP port allocation, which is the default. The automatic assignment of the source UDP ensures uniqueness. Nokia recommends using caution when using configured source UDP ports.
Use the following command to view the configured allocation and use of the source UDP port.
show test-oam twamp twamp-light source-udp-port-poolsLink measurement
Network elements use routing protocols to exchange information about local links, which can influence routing decisions. These interface attributes are typically static in nature. By using tools specifically designed to measure IP performance, dynamic unidirectional delay can be included in the advertised link attributes.
The following figure shows directly-connected IP interfaces and the link measurement interaction with routing.
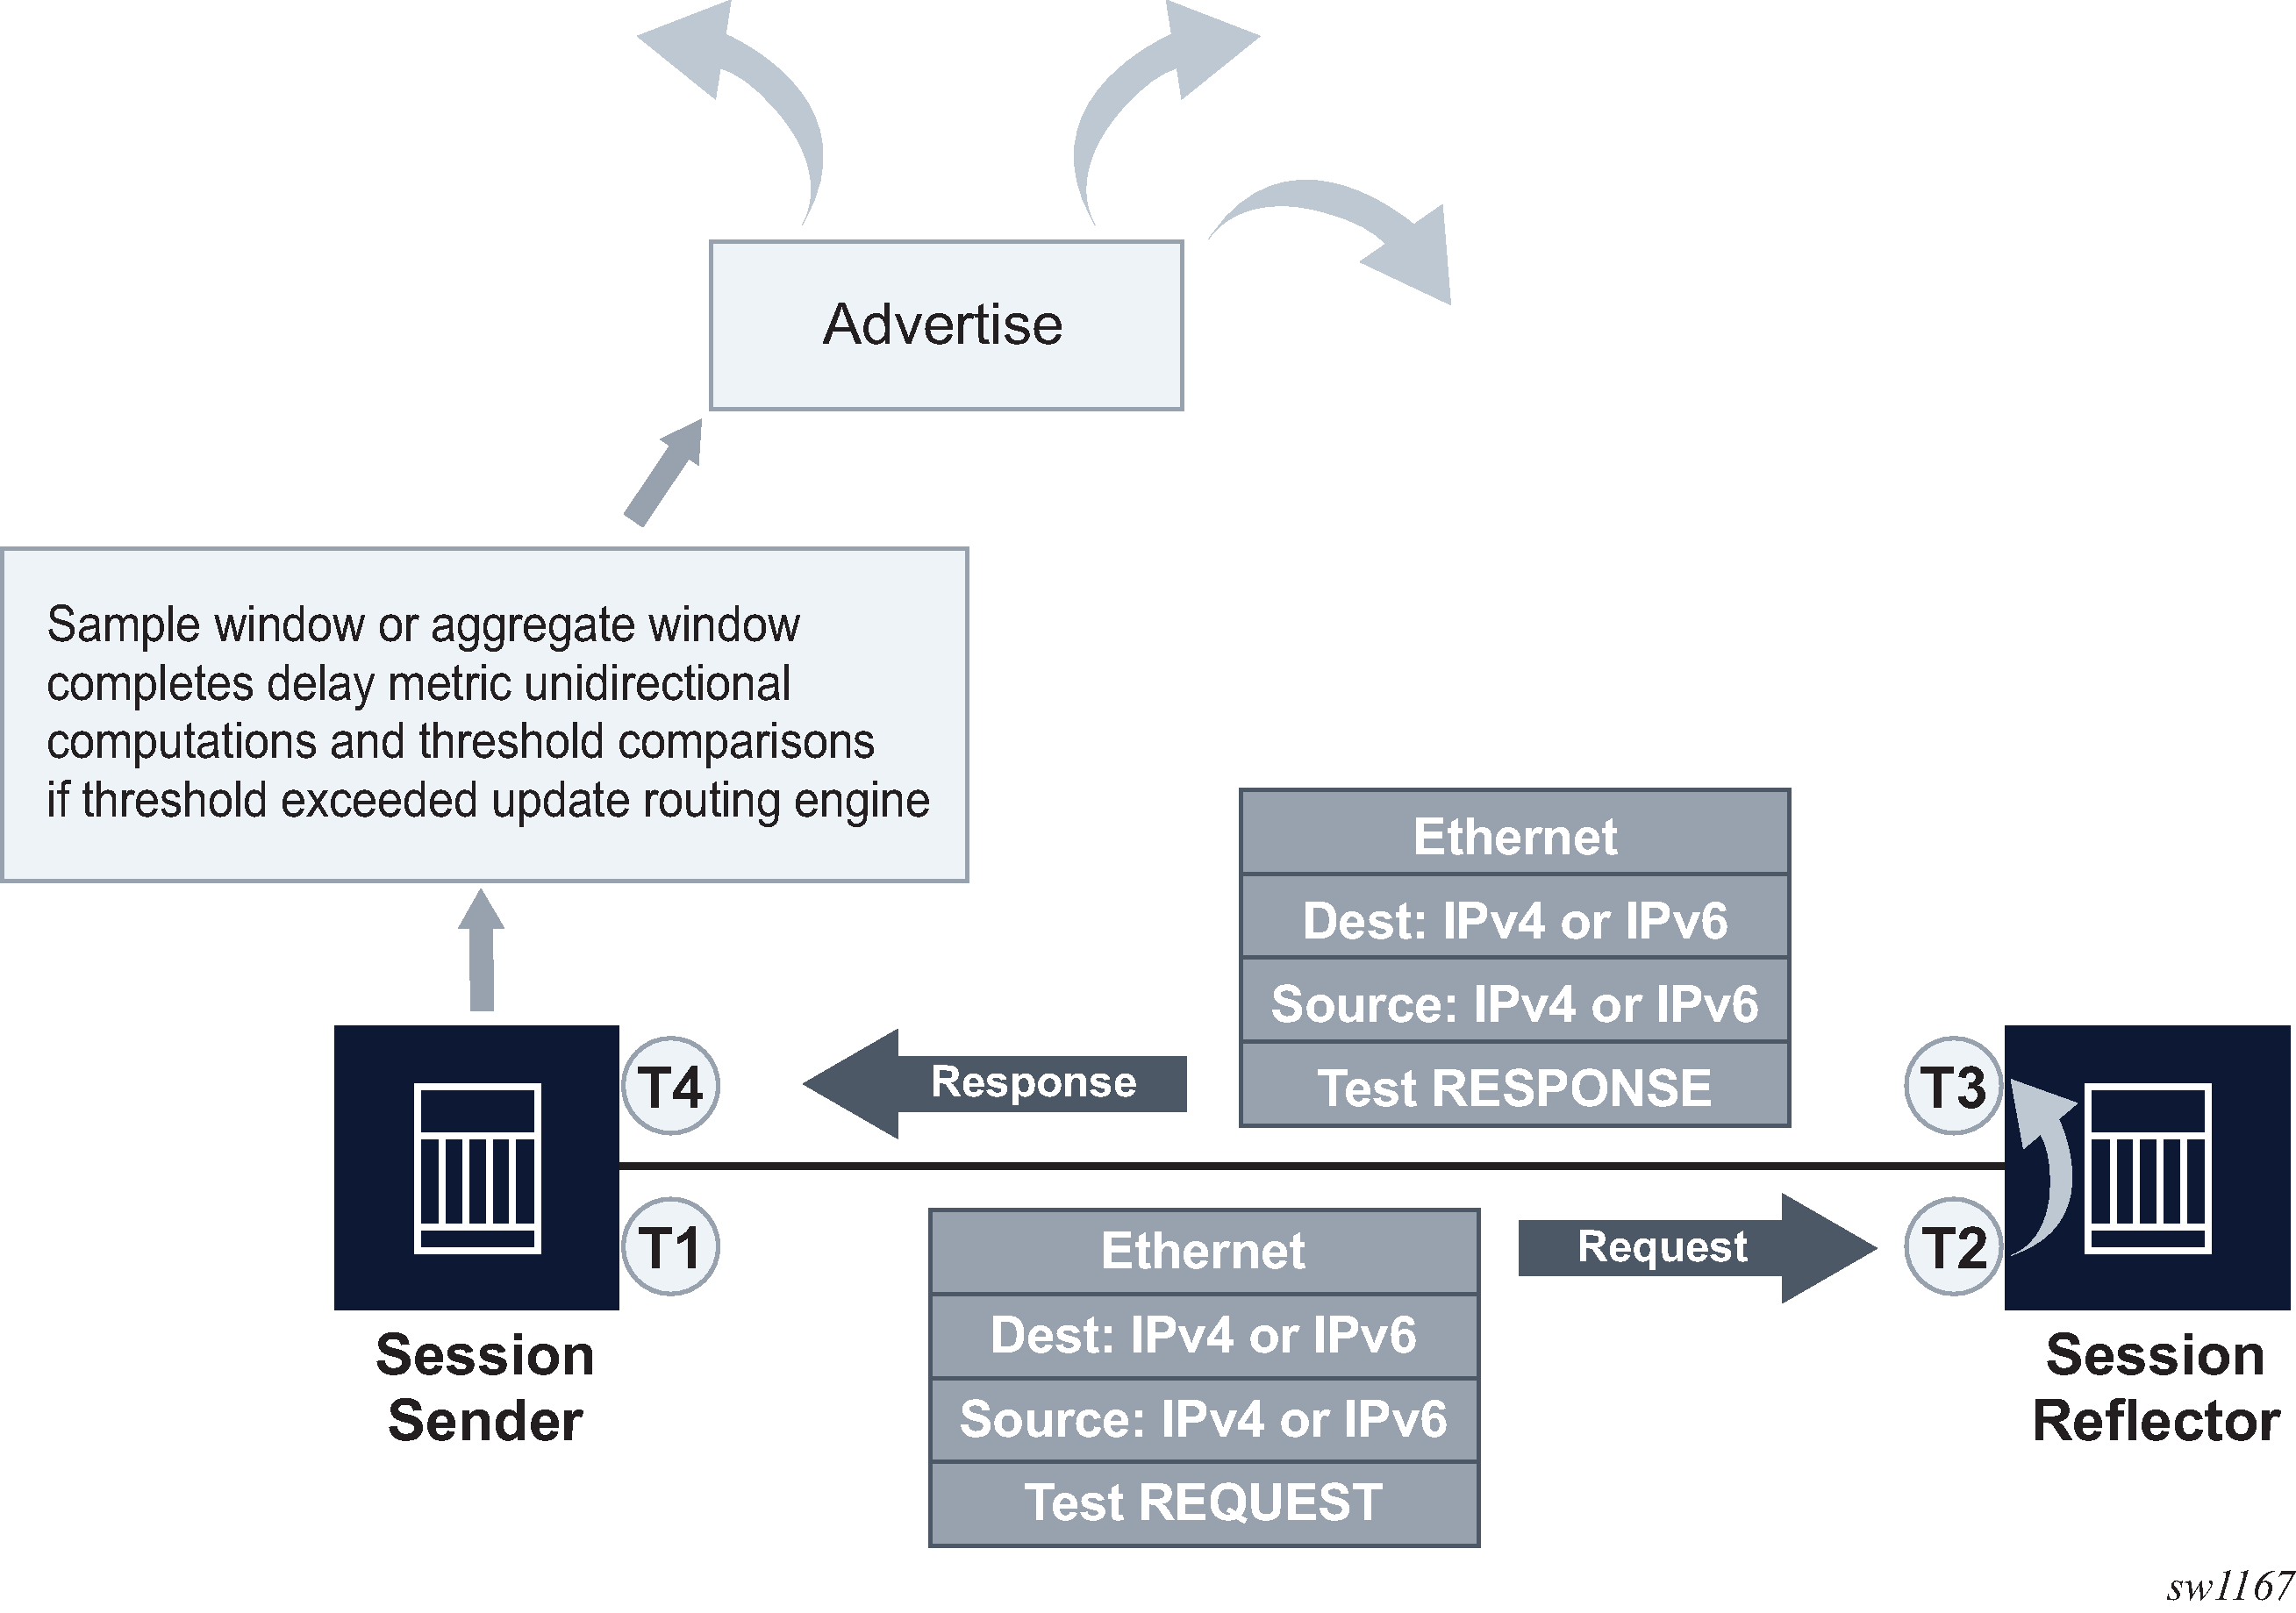
This process can also operate in a reporting disabled mode using the configure test-oam link-measurement measurement-template reporting command. In this mode, all processes continue to operate, including threshold comparisons. In the reporting disabled mode, the routing engine is not made aware of the threshold event.
The paths relating to the threshold event, Delay Measure Last Reported (state test-oam link-measurement router interface last-reported-delay), Timestamp (state test-oam link-measurement router interface report-timestamp), and Triggered By (state test-oam link-measurement router interface triggered-by) all support on change notification.
The combination allows the function to support the following notifications for threshold events.
-
Inform the routing engine only.
-
Inform the routing engine and telemetry subscribers.
-
Inform only telemetry subscribers.
-
Inform no external functions and maintain results in memory until aged out.
Link measurement template
Common test parameters are included under the link-measurement>measurement-template template-name context. After the measurement template has been created, a base router interface can reference the measurement template using the config>router>interface>if-attribute>delay>dynamic>measurement-template template-name command. When the association between the interface and the template is established, the interface executes a process to determine the operational state of the test and detect any defect conditions that may prevent proper test execution. Assuming no underlying conditions are present, the IP interface delay measurements are collected in measurement windows compared to configured thresholds, and, when necessary, reported to the routing engine for further processing.
The measurement-template context contains the configuration parameters that define the test criteria used by the interface test. Conceptually, the test criteria are divided into the following groups:
General configuration
General configuration parameters influence reporting probe frequency, the delay metric type to monitor, and retention of the delay measurement last reported.
The notification process uses the reporting command and threshold configurations. By default, reporting is enabled and the routing engine is informed of threshold events. At least one threshold must be configured to report to the routing engine. Disabling reporting allows the function to execute but prevents the reporting of threshold events to the routing engine. If this value is toggled and previously recorded, the reported value is cleared and the process returns to the initial reporting phase.
The probe frequency, configured using the interval command, defines the transmission rate of the test packet.
The delay command configures the delay metric (minimum, maximum, or average) that is used for comparison against any configured thresholds. This metric is the same for both types of measurement windows, the sample-window and aggregate-sample-window.
The unidirectional-measurement specifies the method used to compute the unidirectional delay. If the clock synchronization between nodal clocks used by the OAM timestamp function is not synchronized to near exact accuracy, the derived option must be used. Specifying this option calculates the unidirectional measurement using the roundtrip delay divided by two computation. If synchronization can meet near exact accuracy, the actual option can be used. Specifying this option calculates the forward delay using the forward direction timestamps, T2-T1 computation.
When the operational state of the link measurement test transitions to down, the OAM function instructs the routing engine to clear the last reported delay value at the expiration of the last-reported-delay-hold. A previously reported delay is considered valid for the duration of this period and is cleared if the timer reaches zero. If the operational state returns to up before the timer expires, no action is taken to clear the previous value. The counter is reset to the configured value, waiting for the next operational down event.
The operation state for the interface delay test is determined by administrative actions and system events. The administrative events that determine the operational state are:
-
administratively disabling the measurement template associated with the interface
-
administratively disabling the active IP protocol that is being used to generate the test packet under the config>router>interface>if-attribute>delay>dynamic-delay context
The resource issue system events that drive the operational state are:
-
unavailability of the UDP port
-
internal errors
The aging timer does not start a count to zero for failure conditions that do not affect the interface delay test operational state. The delay measurement last reported is maintained when conditions external to the interface delay test, such as fault conditions on the port, IP interface, routing changes, and so on, occur. If the last-reported-delay-timer is set to zero, previously reported delay values from that test are cleared when the operational state changes to down without any additional time.
Collection and reporting
The collection and reporting parameters define the length of the sample-window and aggregate-sample-window and the thresholds that trigger reporting. Two measurement windows are provided to support use cases that require a reporting hierarchy. Both measurement windows include the same configuration options. The threshold values determine when the measurement window is able to update the reported delay value.
The measurement windows use the multiplier command to determine the length of time that the measurement window remains open. The sample window length is multiples of the interval. This window stores the results of individual test probes for a total length of the interval multiplied by the multiplier value. The aggregate sample window multiplier length is the number of sample windows. This window stores the number of results passed from individual sample windows. In the aggregate sample window, the minimum, maximum, and average calculations are based on the results received from the sample window. For example, if the delay metric of interest is the average, the aggregate sample is a collection of averages passed from the sample window. The reporting in the aggregate sample window is as follows.
The minimum is the minimum value for all the averages received.
The maximum is the maximum value from all the averages received.
The average is the average of all the averages received.
The comparison to thresholds and reporting decisions occurs at the end of the measurement window if it completes without termination and is deemed integral based on the window-integrity command configuration. Integrity is a percentage-based calculation that determines the number of samples that must be present in the measurement window for that window to be considered integral. If the number of samples in the window equals or exceeds the number of required samples, the result produced is treated as representative and follows normal post-measurement window processing. However, if the number of samples in the window does not achieve integrity, the result is not considered representative and is only recorded for historical purposes, but is otherwise ignored and not processed. By default, integrity checking is disabled and all results from a measurement window are treated as integral and compared to the configured thresholds.
There are two types of thresholds:
a microsecond increase or decrease, configured using the absolute command
a percentage increase or decrease, configured using the relative command
Thresholding compares the measurement window result to the delay measurement last reported at the end of the successful (completed) measurement window. Reporting is on a per-threshold, per-measurement window basis. If multiple thresholds are reached for a completed measurement window, only one threshold triggers an update to the routing engine. The reporting trigger is recorded with a structure of <Window‟Threshold”threshold>. For example, SampleThrehsoldAbsolute indicates that the absolute threshold in the sample window triggered the report. The report is accompanied by a timestamp and last reported value. When a sample window triggers a new delay measurement, the current aggregate sample window is restarted, preempting any possible reporting from the aggregate sample window. This allows both measurement window types to use the delay measurement last reported as the new benchmark.
Configuration of the measurement windows depends on the specific solution requirements. The two measurement windows collect information regardless of configured thresholds. Both types of measurement windows support their own threshold and integrity configuration. By default, thresholds for both measurement windows are disabled; that is, neither window can report any values to the routing engine.
Protocol
The protocol parameters influence the format of the test packet, processing, QoS handling, IPv6 discovery, and which influences the return path.
TWAMP Light, also called Simple Two-way Activation Monitoring Protocol (STAMP), is the test packet used to gather IP link measurement delay. The link measurement request source is the session-sender.
TWAMP Light requires the explicit configuration of a reflector on the peer. For SR OS, TWAMP Light reflectors are configured in the config>router>twamp-light> reflector context. The reflector is referred to as the session-reflector, the responder to the request.
The session-sender and the session-reflector must agree on the UDP port used to identify TWAMP Light test packets. The SR OS configuration of the session-sender (configured using the dest-udp-port command) and session-reflector (configured using the udp-port command) must match.
The TWAMP Light test packet was first introduced to support the Network Time Protocol (NTP) encoding of the timestamp in the packet. Updates since the initial standardization of TWAMP Light supports the use of the truncated Precision Time Protocol (PTP) timestamp format. A bit in the TWAMP Light test packet header is repurposed to indicate the timestamp format encoded by the session-sender and the session-reflector. This change leads to some interoperability considerations. The timestamp format should be consistent with the session-sender and session-reflector behavior. The link measurement session-sender can be configured to encode NTP (default) or PTP and set the ‟z-bit” in the Error Estimate field accordingly. This bit indicates the timestamp format carried in the packet. If the session-reflector sets the ‟z-bit” in the Error Estimate field to indicate the timestamp format of the reply, the link measurement session-sender can perform the necessary conversion (format and epoch) to produce the correct results. However, if the session-reflector only reflects the original ‟z-bit” it received from the session-sender and uses a different timestamp format in the packet, the delay calculations are not reliable because of the misinterpretation of the returned timestamp format. SR OS session-reflectors running Release 21.5 and earlier always reflect the ‟z-bit” received from the session-sender. Regardless of the ‟z-bit”, these session-reflectors always encode an NTP timestamp format in the packet. When these session-reflectors receive a TWAMP Light test packet with the PTP timestamp format, there is a mismatch between the actual timestamp format and the timestamp it has encoded. There is no mechanism for the session-reflector to detect this mismatch and report the correct delay. To ensure accurate delay measurements, any session-sender sending TWAMP Light test packets to an SR OS TWAMP Light reflector that is running Release 21.5 and earlier, must use a timestamp format of NTP. Release 21.7 session-reflectors reply in kind for the timestamp format and properly set the timestamp format bit to match the timestamp encoded by the session-reflector.
IPv6 packets arriving with a UDP checksum of zero are discarded. However, recent work in the IETF is suggesting that selected protocols may register on the local router to accept and process IPv6 packets with a UDP checksum of zero. To provide interoperability, the allow-ipv6-udp-checksum-zero command allows the session-sender and the session-reflector to process IPv6 TWAMP Light test packets that arrive with a UDP checksum of zero. This is specific to the link measurement template session-sender and session-reflector and only for the specific UDP ports for TWAMP Light test packets.
-
Enabling the functions using admin-enable, set to disabled by default.
-
Configuring the discovery-interval value. This is the initial timer used by the discovery process to discover the peer. This interval is used for the duration of the discovery-timer.
-
Implementing the discovery phase. If the timer expires or the peer is discovered before the expiration of the discovery-timer, the process reverts back to the update-interval.
-
Implementing the update-interval. This is an optional maintenance component of the peer address that runs at a slower rate. This option is not required and can be disable in environments where the peer address is unlikely to change. If the peer is not discovered during the discovery-timer and the update-interval is disabled the peer fails to be discovered. Disable and then enable the IPv6 protocol under configure router interface delay dynamic twamp-light ipv6 can restart the discovery process.
By default, the TWAMP light reflection and the base TWAMP Light session-reflectors use routing to return the response packet to the session-sender. There are instances when it may be beneficial to be selective about the IP interface used to return the packet. For example, when multiple tests are executed on different interfaces between the same pair of nodes, and using non-directly connected interface addresses, and ECMP exists between the two nodes and the unidirectional-measurement actual is used. In this case, the return-path link command can be configured under the measurement-template twamp-light context. This includes the return path TLV and link sub TLV in the test packet. This configuration instructs the session reflector to send the response out the same IP interface on which it was received. The destination IP address for the response packet must be installed in the forwarding table and reachable from that interface. If the routing engine determines that the prefix is not reachable from that interface the response packet is dropped at the reflector.
Modifying measurement template configuration
SR OS supports the configuration modification of active measurement templates. That is, administratively disabling a measurement template that IP interfaces are actively referencing is not required. Modifying existing parameters causes interface delay tests that were referencing the modified template to terminate the current sample and aggregate measurement windows, and to start new measurement windows using the updated template parameters. The previous historical results are maintained, but the State field of the measurement window coinciding with the change indicates ‟Terminated”. Changing the description or the last-reported-delay-hold configuration does not cause a termination of the current sample and aggregate measurement windows.
A measurement template cannot be removed if interfaces are referencing that template.
Displaying link measurements
The following show commands are available to display the link measurement templates:
The show>test-oam>link-measurement measurement-template reports the measurement templates and the number of total and active interface references.
The show>test-oam>link-measurement measurement-template-using command reports the measurement template, associated router interfaces and the protocols.
The show>test-oam>link-measurement measurement-template template-name command reports the specific measurement template and the associated configuration parameters, with the number of active interfaces and total references to this templates.
Interface assignment
The test criteria-specific link measurement configuration is under the link measurement template. Because the delay test is executed from the base router interface, a component of this configuration is required in the config>router>interface>if-attribute> delay context.
IP addressing
To enable dynamic measurements for the interface, the user must configure a link measurement template and enable the test protocol using the ipv4 or ipv6 command. The link measurement template does not include interface-specific requirements, such as the IP protocol encapsulating the test packet or IP source and destination addressing. It is possible to enable the IPv4 or IPv6 protocol under the dynamic>twamp-light context without including any source or destination information.
When the IPv4 protocol is enabled with no addressing configured, the source address is automatically assigned to the primary IPv4 address of the IP interface. The destination address is automatically assigned if the primary IPv4 address has a prefix length of 30 or 31. In other cases, such as shorter prefix lengths or unnumbered interfaces, the destination address cannot be resolved and must be configured manually. The source and destination commands take precedence over the auto-assigned addressing; the IPv4 addresses must be unicast.
IPv4 auto-assigned addressing is not updated for operationally up interface delay tests when the IP addressing associated with that interface is changed. Nokia suggest the following options to update the auto-assigned addressing.
-
Administratively disable and enable the protocol used for the interface delay test.
-
Disable and enable the IP interface under which the IP address has changed.
When the IPv6 protocol is enabled without any source address, the system uses the link-local address associated with the interface as the source. If there is no destination address configuration, the destination discovery process is initiated if the associated measurement-template assigned to this interface has configure test-oam link-measurement measurement-template twamp-light ipv6-destination-discovery enabled.
The source and destination can be globally routable unicast addresses of the link identifying the directly-connected peers or the link local addresses connecting the peers. The link local address must follow the format fe80::/64 as described in RFC 4291, IP Version 6 Addressing Architecture.
TWAMP Light test packets consult the routing table to determine how to reach the destination. The test should be configured to use local IP interface source and directly connected IP peer interface destination addressing to ensure the packet egresses and returns over the same IP interface. The destination must be reachable from the IP interface where the interface delay test is configured. Using indirect IP addressing, such as unnumbered interfaces, does not guarantee that the measurement is reporting the delay for the expected interface.
Only one protocol, IPv4 or IPv6, can be enabled for an interface delay test at any time.
Interfaces defined as loopback do not support interface delay tests and are an invalid interface type. The configuration exists under these interfaces, but a detectable transmission error prevents the sending of packets.
The system interface does not support interface delay tests and the configuration is hidden.
Test initialization
When the link measurement template is assigned to an IP interface, the audit process determines the operational state of the test. The interface delay test transitions to operationally up if the following conditions are met:
The associated measurement template is administratively enabled.
There is an administratively enable test protocol, configured using the ipv4 or ipv6 command.
The system resources are available to start the test.
Further validation determines if there are any underlying conditions that are considered detectable transmission errors, which are listed in Detectable transmission errors .
| Detectable Tx error | Description | Prevents transmission |
|---|---|---|
None |
No detectable errors |
No |
interfaceDown |
The link measurement test is configured on an IP interface with an operationally down state |
Yes |
UnexpectedError |
Router resources not available |
No |
noRoute |
The routing lookup has failed to resolve the destination as reachable from the interface where the test is configured. The packet is transmitted out of the interface resolved by the routing engine. |
No |
sourceIpNotLocal |
The source IP address configured for the test is not local to the system |
No |
invalidDestIp |
The destination IP address is not valid. This may occur because of a configuration error or an attempt to use auto assignment in conditions that are not supported. |
Yes |
invalidInterfaceType |
The link measurement test is configured under an interface that does not support these test types (such as loopback interfaces) |
Yes |
sameSourceIpDestIp |
A configuration error that indicates the source and destination IP addresses are the same |
Yes |
When all audit conditions successfully pass, the delay collection begins. When no thresholds are configured, the test collects delay information as history, but without at least one configured threshold value, reporting updates to the routing engine are disabled. If at least one threshold is configured, the interface enters the first report phase. Because no previous delay value has been reported, the first measurement window with a configured threshold that completes with integrity triggers the delay measurement report. After this benchmark is set, all subsequent thresholds use the delay measurement last reported as the comparison.
History and results
Active interface delay tests retain 50 sample windows and 20 aggregate sample windows in history. The current measurement windows and historical results are not maintained across CPM switchovers. The delay measurement last reported is maintained after a CPM switchover to retain the baseline. The interface does not enter the first reporting phase following a CPM switchover.
Several states exist to indicate the state of the measurement window:
- InProgress
- The measurement window is open and collecting results.
- Completed
- This state indicates natural completion of the delay test.
- Terminated
- A configuration change to the measurement template being referenced, or an administrative action or system event caused the operational state to change to down, consequently preempting and causing an abnormal termination.
- SwReported
- The sample window has triggered a delay measurement last report.
- AswReported
- The aggregate sample window has triggered a delay measurement last report.
Static versus dynamic
SR OS supports the configuration of static and dynamic delay measurement, and provides a configuration parameter to determine precedence. The dynamic delay measurements use the link measurement templates and interface delay test packets to gather results. The static delay is a configured value. Both static delay and dynamic delay can be configured under the same interface. Both are reported to the routing engine based on their own rules. The routing engine must be informed on how to interpret this condition and which metric to advertise. The delay selection, configured using the delay-selection command, provides four options to customize the handling. The configuration options allow for only one to be considered (using the static or dynamic options) or which is to be preferred should both exist (using the static-preferred or dynamic-preferred options). There may be an amount of time between the interface initialization and the reporting of a valid dynamic delay value. This case may require some deployments to configure a static delay value to fill the time gap while waiting for the link measurement first report. In this case, preferring dynamic allows the routing engine to advertise the static value until the dynamic delay report is made.
Displaying interface delay tests
The user can use show commands to display the link measurement templates.
The show test-oam link-measurement interface interface-name [detail | aggregate | sample debug-counters] command reports the interface-specific delay test information, such as operational data, reporting information, the historical results for sample and aggregate sample windows, and a count of unexpected conditions for response packets.
The show test-oam link-measurement interfaces command reports a list of all interfaces that are configured with link-measurement. The report includes all the basic operational summaries such as the interface name, operational state, protocol, errors, reporting, delay metric of interest, last delay, and the timestamp of the last delay.
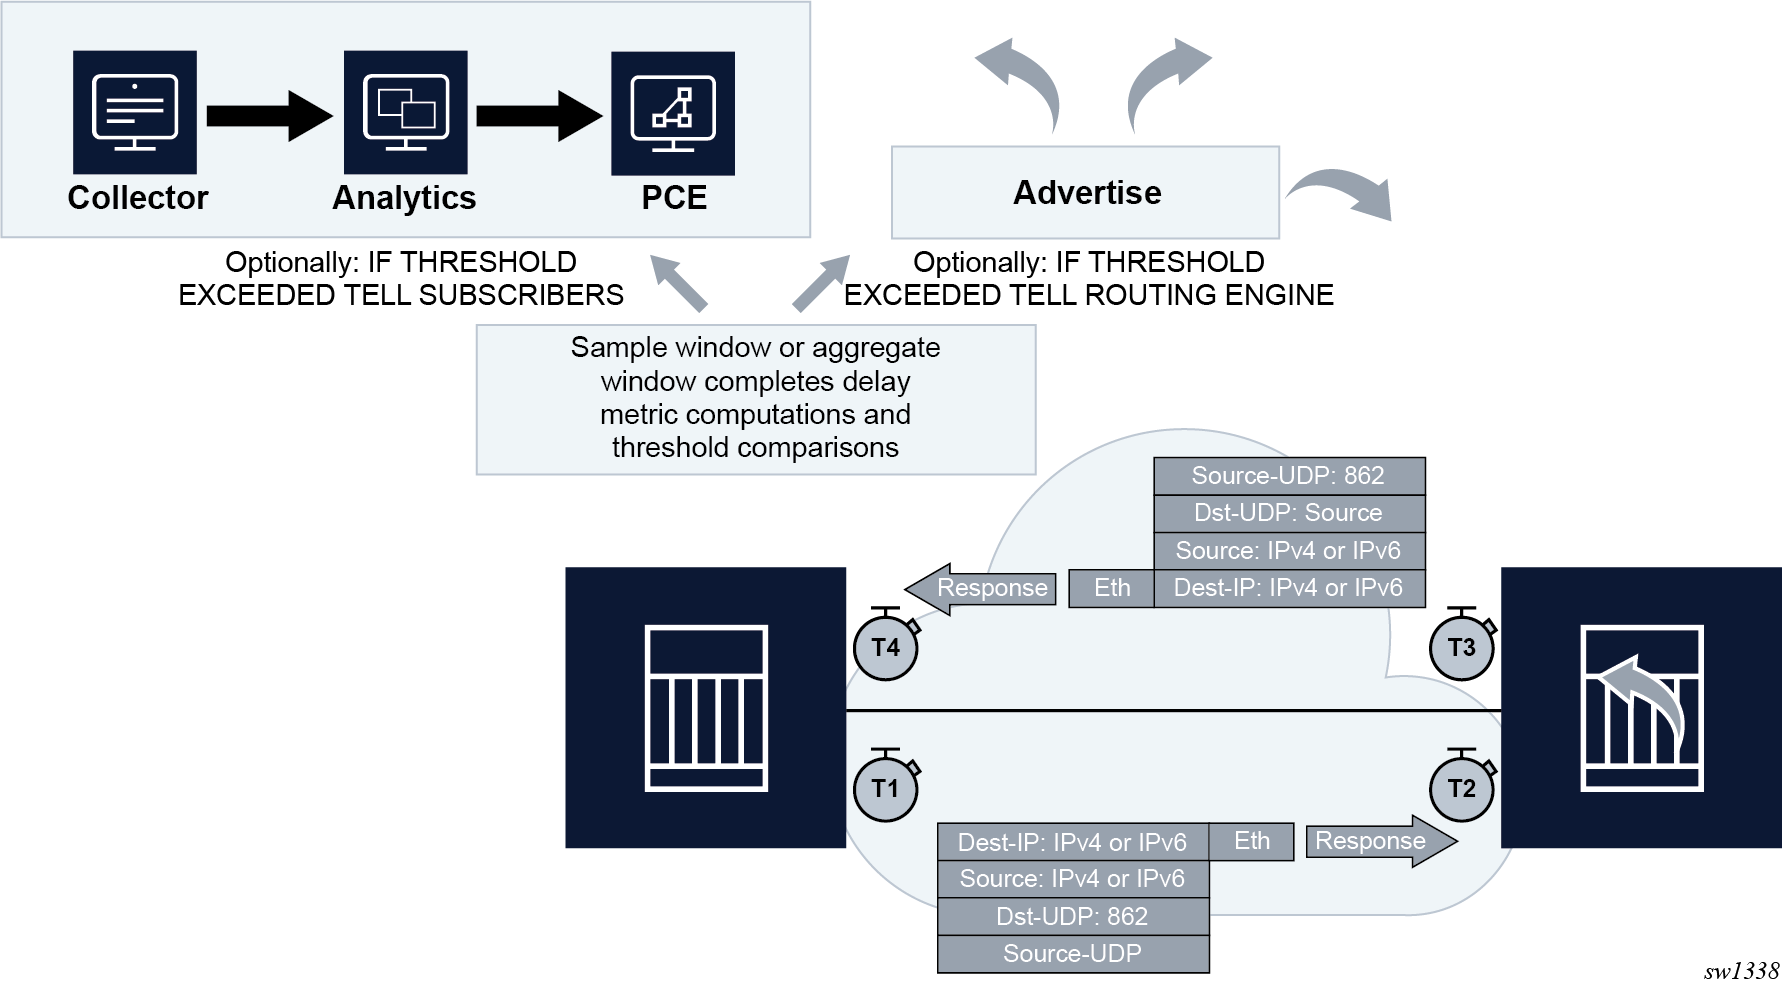
OAM performance monitoring
OAM Performance Monitoring (OAM-PM) provides an architecture for gathering and computing Key Performance Indicators (KPIs) using standard protocols and a robust collection model. The architecture comprises the following foundational components:
Session
This is the overall collection of different tests, test parameters, measurement intervals, and mappings to configured storage models. It is the overall container that defines the attributes of the session.
Standard PM packets
These are the protocols defined by various standards bodies, which contain the necessary fields to collect statistical data for the performance attribute they represent. OAM-PM leverages single-ended protocols. Single-ended protocols typically follow a message response model: message sent by a launch point, response updated, and reflected by a responder.
Measurement Intervals (MI)
These are time-based non-overlapping windows that capture all results that are received in that window of time
Data structures
These are the unique counters and measurement results that represent the specific protocol
Bin group
These are ranges in microseconds that count the results that fit into the range
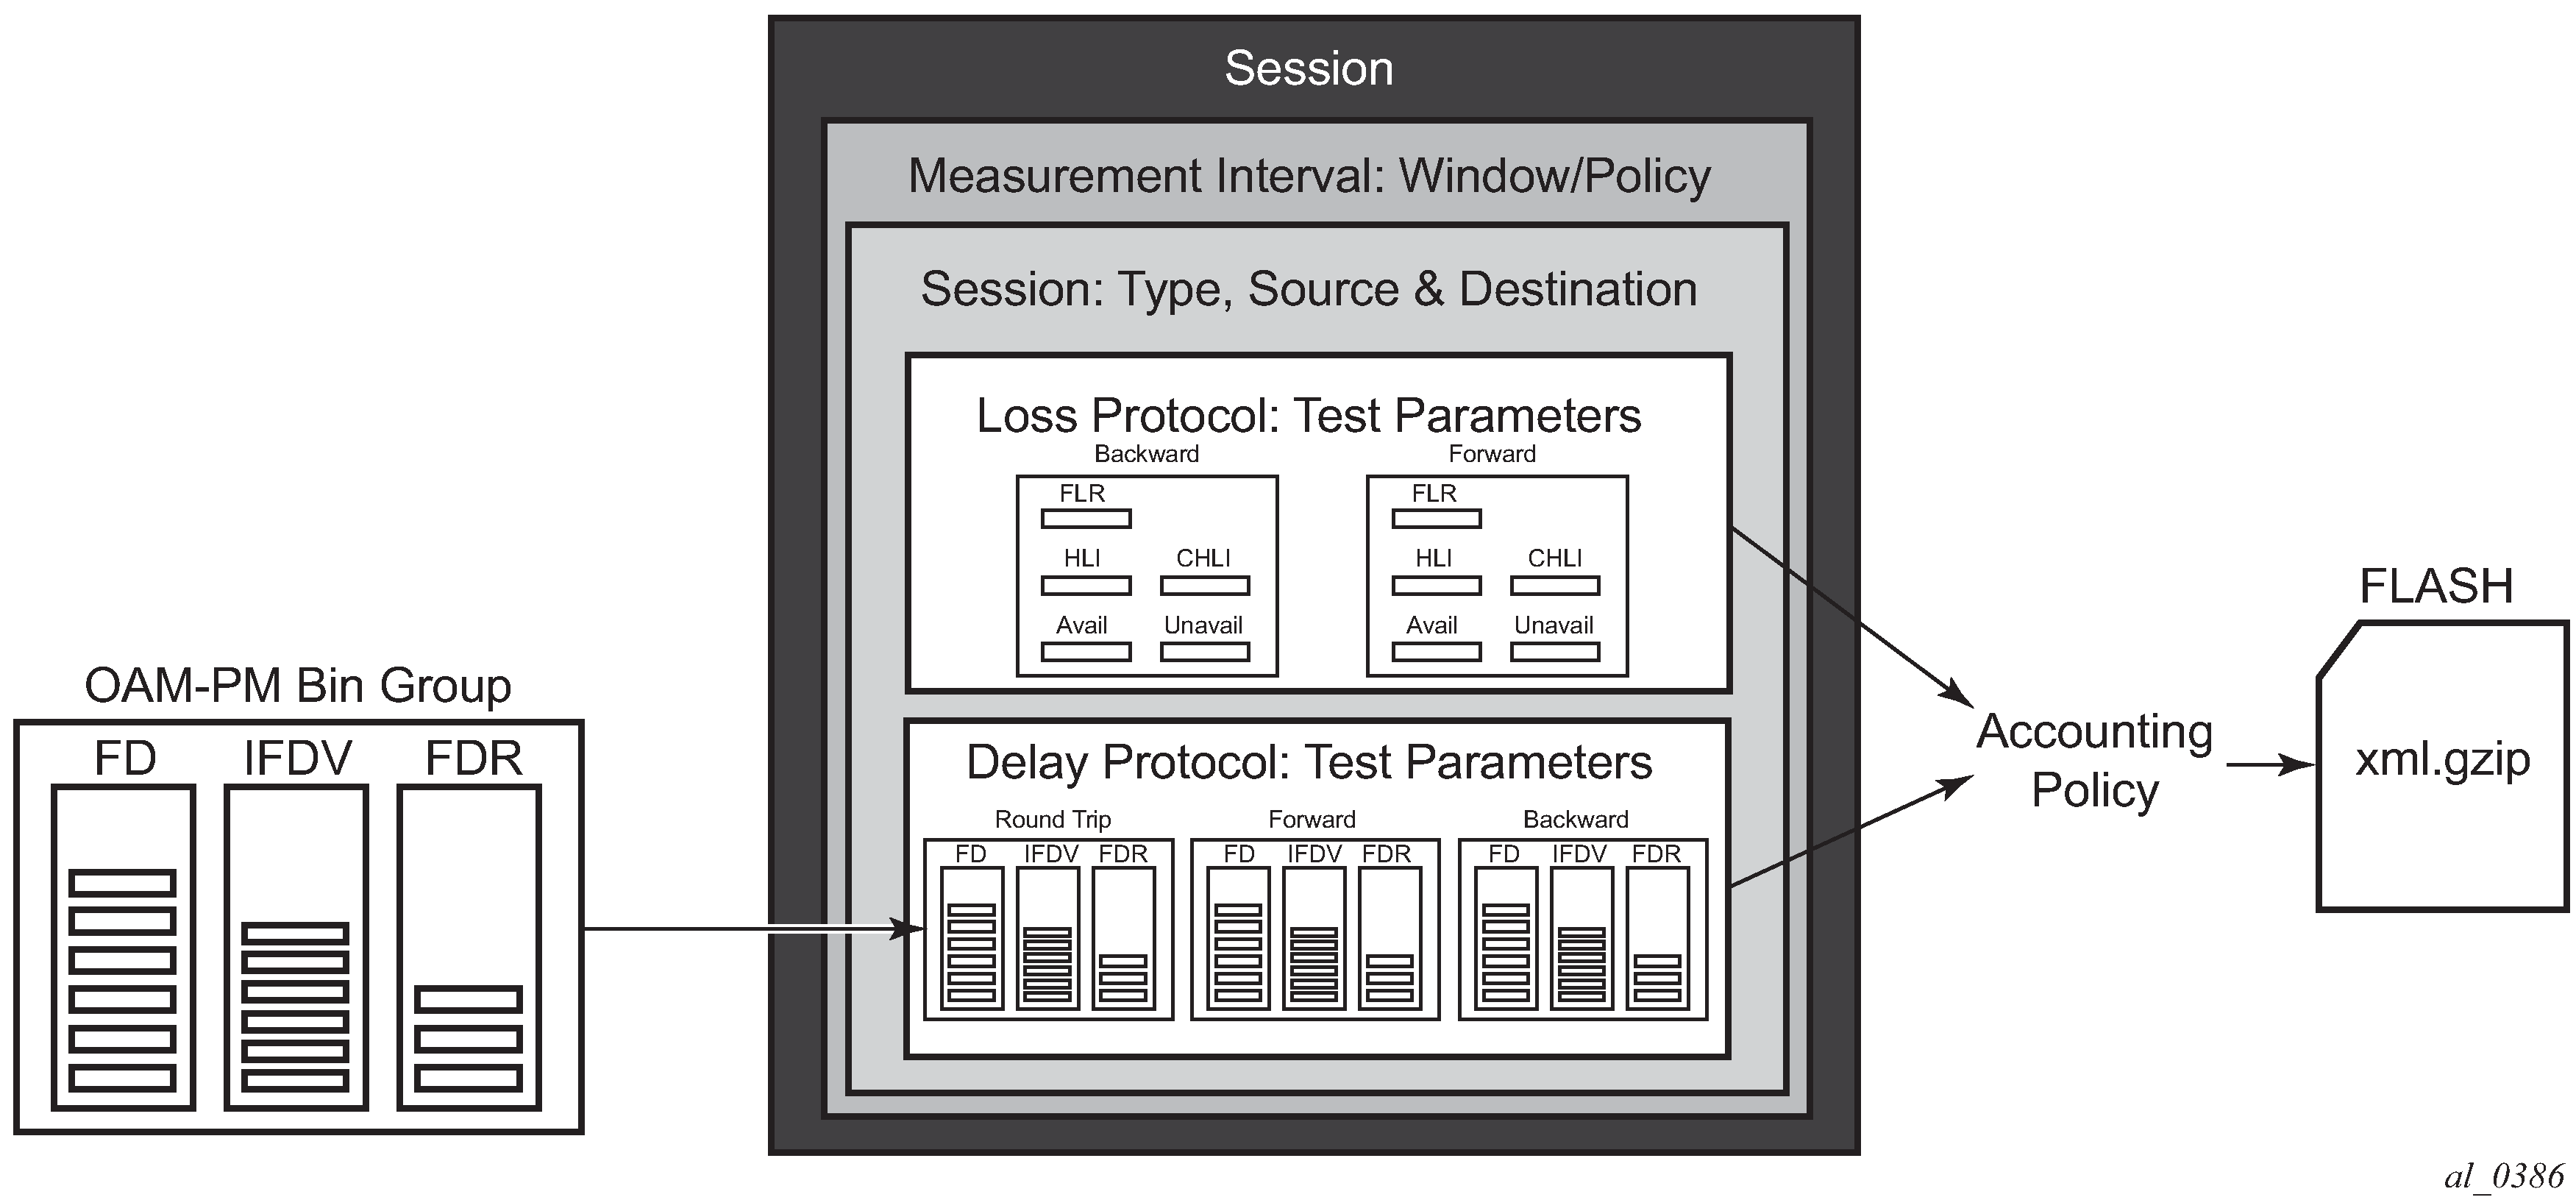
OAM-PM architecture hierarchy shows the hierarchy of the architecture. This figure is only meant to show the relationship between the components. It is not meant to depict all details of the required parameters.
OAM-PM configurations are not dynamic environments. All aspects of the architecture must be carefully considered before configuring the various architectural components, making external references to other related components, or activating the OAM-PM architecture. No modifications are allowed to any components that are active or have any active sub-components. Any function being referenced by an active OAM-PM function or test cannot be modified or shut down. For example, to change any configuration element of a session, all active tests must be in a shutdown state. To change any bin group configuration (described later in this section), all sessions that reference the bin group must have every test shut down. The description parameter is the only exception to this rule.
Session source and destination configuration parameters are not validated by the test that uses that information. When the test is activated with a no shutdown command, the test engine attempts to send the test packets even if the session source and destination information does not accurately represent the entity that must exist to successfully transmit packets. If the entity does not exist, the transmit count for the test is zero.
OAM-PM is not a hitless operation. If a high availability event occurs that causes the backup CPM or CPIOM to become the active CPM or CPIOM, or when ISSU functions are performed, the test data is not correctly reported. There is no synchronization of state between the active and the backup control modules. All OAM-PM statistics stored in volatile memory are lost. When the reload or high availability event is completed and all services are operational, the OAM-PM functions commence.
It is possible that during times of network convergence, high CPU utilizations, or contention for resources, OAM-PM may not be able to detect changes to an egress connection or allocate the necessary resources to perform its tasks.
Session
The session is the overall collection of test information fields, including the test parameters, measurement intervals, and mapping to configured storage models. The container defines the attributes of the session. The fields are as follows:
session type
The impetus of the test, which is either proactive (default) or on-demand. Individual test timing parameters are influenced by this setting. A proactive session starts immediately following the execution of a no shutdown command for the test. A proactive test continues to execute until a manual shutdown stops the individual test. All previous memory allocated to the test session is cleared when the new memory is allocated during the no shutdown. Any results not collected from volatile memory is permanently lost. On-demand tests also start immediately following the no shutdown command. However, the operator can override the no test-duration default and configure a fixed amount of time that the test executes, up to 24 hours (86 400 seconds).
If an on-demand test is configured with a test duration, it is important to shut down tests when they are completed. In the event of a high availability event causing the backup CPM or CPIOM to become the active CPM or CPIOM, all on-demand tests that have a test duration statement restart and run for the configured amount of time regardless of their progress on the previously active CPM or CPIOM.
test family
The main branch of testing that addresses a specific technology. The available tests for the session are based on the test family. The destination, source, and priority are common to all tests under the session and are defined separately from the individual test parameters.
test parameters
The parameters included in individual tests, as well as the associated parameters including start and stop times and the ability to activate and deactivate the individual test.
measurement interval
The assignment of collection windows to the session with the appropriate configuration parameters and accounting policy for that specific session.
The session can be viewed as the single container that brings all aspects of individual tests and the various OAM-PM components together. If any aspects of the session are incomplete, the individual test cannot be activated with a no shutdown command, and an ‟Invalid Ethernet session parameters” error occurs.
Standard PM packets
A number of standards bodies define performance monitoring packets that can be sent from a source, processed, and responded to by a reflector. The protocols available to carry out the measurements are based on the test family type configured for the session.
Ethernet PM delay measurements are carried out using the Two-Way Delay Measurement Protocol version 1 (DMMv1) defined in Y.1731 by ITU-T. This allows for the collection of Frame Delay (FD), InterFrame Delay Variation (IFDV), Frame Delay Range (FDR), and Mean Frame Delay (MFD) measurements for round-trip, forward, and backward directions.
DMMv1 adds the following to the original DMM definition:
the Flag Field (1 bit – LSB) is defined as the Type (Proactive=1 | On-Demand=0)
the TestID TLV (32 bits) is carried in the Optional TLV portion of the PDU
DMMv1 and DMM are backwards compatible and the interaction is defined in Y.1731 ITU-T-2011 Section 11 ‟OAM PDU validation and versioning.”
Ethernet PM loss measurements are carried out using Synthetic Loss Measurement (SLM), which is defined in Y.1731 by the ITU-T. This allows for the calculation of Frame Loss Ratio (FLR) and availability.
A session can be configured with one or more tests. Depending on the session test type family, one or more test configurations may need to be included in the session to gather both delay and loss performance information. Each test that is configured shares the common session parameters and the common measurement intervals. However, each test can be configured with unique per-test parameters. Using Ethernet as an example, both DMM and SLM would be required to capture both delay and loss performance data.
Each test must be configured with a TestID as part of the test parameters, which uniquely identifies the test within the specific protocol. A TestID must be unique within the same test protocol. Using Ethernet as an example, DMM and SLM tests within the same session can use the same TestID because they are different protocols. However, if a TestID is applied to a test protocol (like DMM or SLM) in any session, it cannot be used for the same protocol in any other session. When a TestID is carried in the protocol, as it is with DMM and SLM, this value does not have global significance. When a responding entity must index for the purpose of maintaining sequence numbers, as in the case of SLM, the TestID, source MAC, and destination MAC are used to maintain the uniqueness of the responder. This means that the TestID has only local, and not global, significance.
Measurement intervals
A measurement interval is a window of time that compartmentalizes the gathered measurements for an individual test that has occurred during that time. Allocation of measurement intervals, which equates to system memory, is based on the metrics being collected. This means that when both delay and loss metrics are being collected, they allocate their own set of measurement intervals. If the operator is executing multiple delay and loss tests under a single session, multiple measurement intervals are allocated, with one interval allocated per criteria per test.
Measurement intervals can be 15 minutes (15-min), one hour (1-hour), and 1 day (1-day) in duration. The boundary-type defines the start of the measurement interval and can be aligned to the local time-of-day clock, with or without an optional offset. The boundary-type can be aligned using the test-aligned option, which means that the start of the measurement interval coincides with the activation of the test. By default, the start boundary is clock-aligned without an offset. When this configuration is deployed, the measurement interval starts at zero, in relation to the length.
When a boundary is clock-aligned and an offset is configured, the specified amount of time is applied to the measurement interval. Offsets are configured on a per-measurement interval basis and only applicable to clock-aligned measurement intervals. Only offsets less than the measurement interval duration are allowed. Measurement interval start times lists examples of the start times of each measurement interval.
| Offset | 15-min | 1-hour | 1-day |
|---|---|---|---|
0 (default) |
00, 15, 30, 45 |
00 (top of the hour) |
midnight |
10 minutes |
10, 25, 40, 55 |
10 min after the hour |
10 min after midnight |
30 minutes |
rejected |
30 min after the hour |
30 min after midnight |
60 minutes |
rejected |
rejected |
01:00 AM |
Although test-aligned approaches may seem beneficial for simplicity, there are some drawbacks that need to be considered. The goal of the time-based and well-defined collection windows allows for the comparison of measurements across common windows of time throughout the network and for relating different tests or sessions. It is suggested that proactive sessions use the default clock-aligned boundary type. On-demand sessions may use test-aligned boundaries. On-demand tests are typically used for troubleshooting or short term monitoring that does not require alignment or comparison to other PM data.
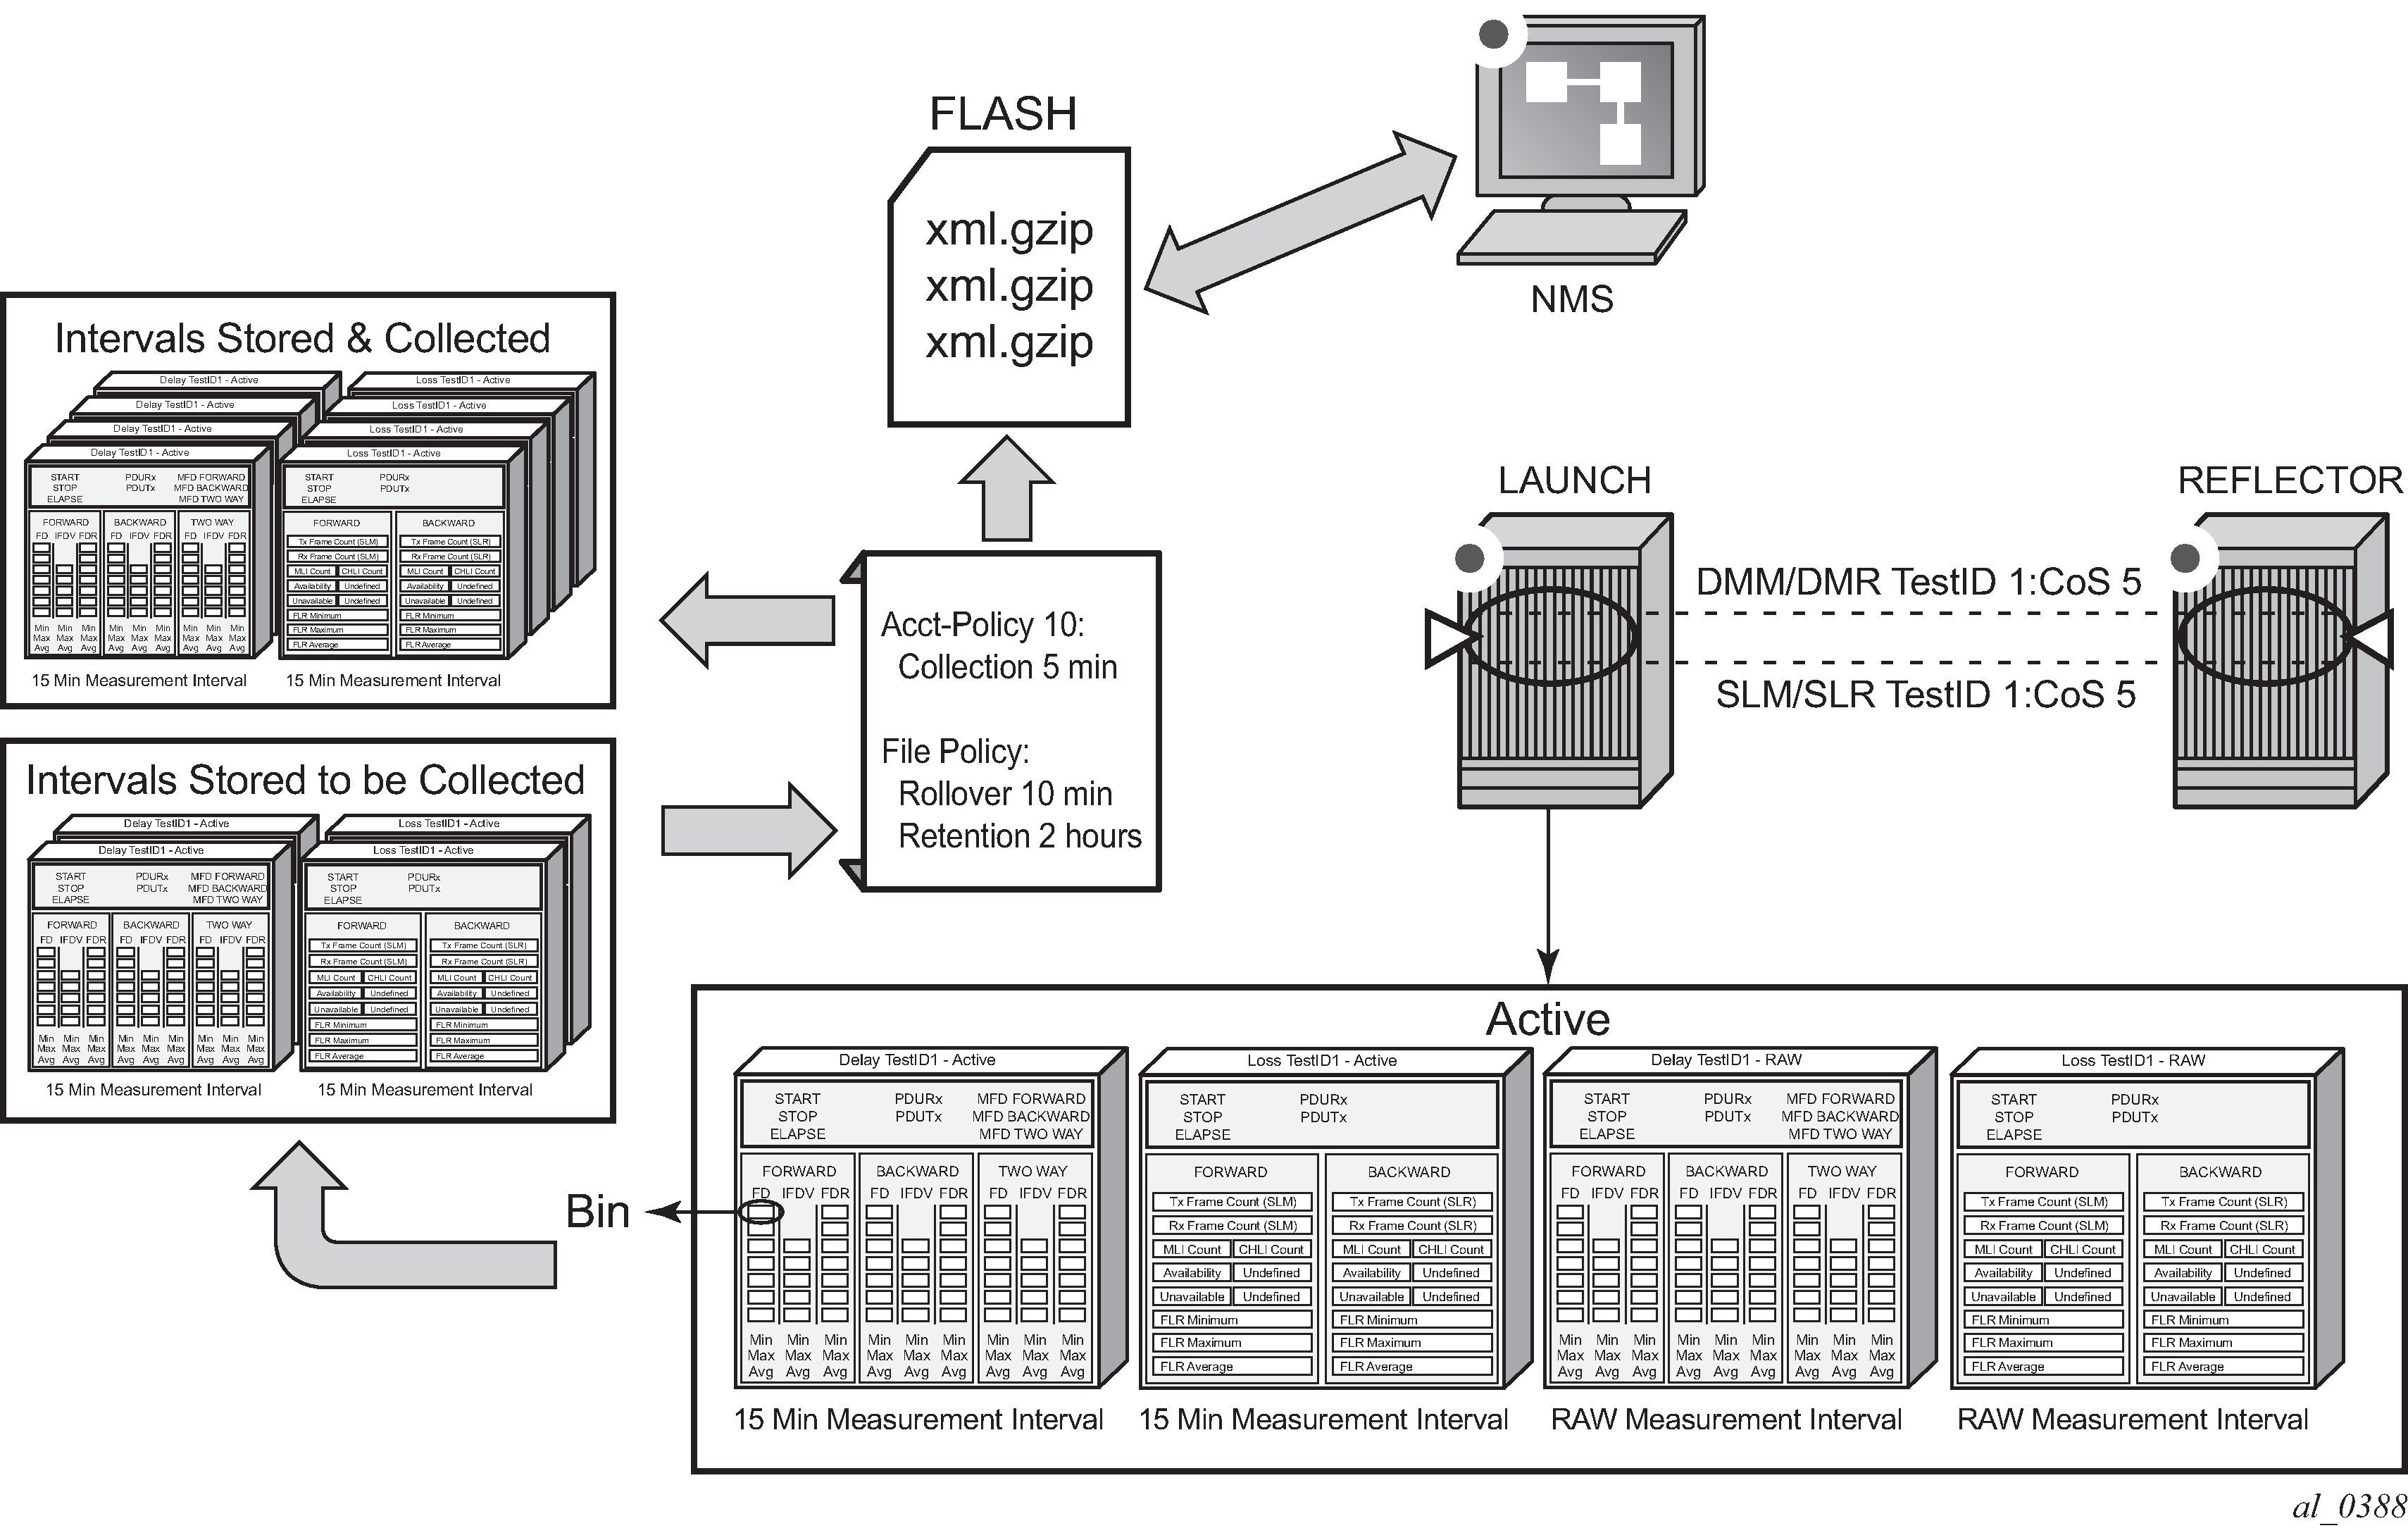
The statistical data collected and the computed results from each measurement interval are maintained in volatile system memory by default. The number of intervals stored is configurable per measurement interval. Different measurement intervals have different defaults and ranges. The interval-stored parameter defines the number of completed individual test runs to store in volatile memory. There is an additional allocation to account for the active measurement interval.
To look at the statistical information for the individual tests and a specific measurement interval stored in volatile memory, the show oam-pm statistics … interval-number command can be used. If there is an active test, it can be viewed by using the interval number 1. In this case, the first completed record would be interval number 2, and previously completed records would increment up to the maximum intervals stored value plus one.
As new tests for the measurement interval are completed, the older entries are renumbered to maintain their relative position to the current test. If the retained test data for a measurement interval consumes the final entry, any subsequent entries cause the removal of the oldest data.
There are drawbacks to this storage model. Any high availability function that causes an active CPM or CPIOM switch flushes the results that are in volatile memory. Another consideration is the large amount of system memory consumed using this type of model. Considering the risks and resource consumption this model incurs, an alternate method of storage is supported. An accounting policy can be applied to each measurement interval to write the completed data in system memory to non-volatile flash memory in an XML format. The amount of system memory consumed by historically completed test data must be balanced with an appropriate accounting policy.
Nokia recommends that only necessary data be stored in non-volatile memory to avoid unacceptable risk and unnecessary resource consumption. It is further suggested that a large overlap between the data written to flash memory and stored in volatile memory is unnecessary.
The statistical information in system memory is also available through SNMP. If this method is chosen, a balance must be struck between the intervals retained and the times at which the SNMP queries collect the data. Determining the collection times through SNMP must be done with caution. If a file is completed while another file is being retrieved through SNMP, the indexing changes to maintain the relative position to the current run. Correct spacing of the collection is key to ensuring data integrity.
OAM-PM XML keywords and MIB reference describes the keywords and MIB references contained in the OAM-PM XML file.
| XML file keyword | Description | TIMETRA-OAM-PM-MIB object |
|---|---|---|
|
oampm |
— |
None - header only |
|
Keywords shared by all OAM-PM protocols |
||
|
sna |
OAM-PM session name |
tmnxOamPmCfgSessName |
|
mi |
Measurement Interval record |
None - header only |
|
dur |
Measurement Interval duration (minutes) |
tmnxOamPmCfgMeasIntvlDuration (enumerated) |
|
ivl |
measurement interval number |
tmnxOamPmStsIntvlNum |
|
sta |
Start timestamp |
tmnxOamPmStsBaseStartTime |
|
ela |
Elapsed time in seconds |
tmnxOamPmStsBaseElapsedTime |
|
ftx |
Frames sent |
tmnxOamPmStsBaseTestFramesTx |
|
frx |
Frames received |
tmnxOamPmStsBaseTestFramesRx |
|
sus |
Suspect flag |
tmnxOamPmStsBaseSuspect |
|
dmm |
Delay Record |
None - header only |
|
mdr |
minimum frame delay, round-trip |
tmnxOamPmStsDelayDmm2wyMin |
|
xdr |
maximum frame delay, round-trip |
tmnxOamPmStsDelayDmm2wyMax |
|
adr |
average frame delay, round-trip |
tmnxOamPmStsDelayDmm2wyAvg |
|
mdf |
minimum frame delay, forward |
tmnxOamPmStsDelayDmmFwdMin |
|
xdf |
maximum frame delay, forward |
tmnxOamPmStsDelayDmmFwdMax |
|
adf |
average frame delay, forward |
tmnxOamPmStsDelayDmmFwdAvg |
|
mdb |
minimum frame delay, backward |
tmnxOamPmStsDelayDmmBwdMin |
|
xdb |
maximum frame delay, backward |
tmnxOamPmStsDelayDmmBwdMax |
|
adb |
average frame delay, backward |
tmnxOamPmStsDelayDmmBwdAvg |
|
mvr |
minimum inter-frame delay variation, round-trip |
tmnxOamPmStsDelayDmm2wyMin |
|
xvr |
maximum inter-frame delay variation, round-trip |
tmnxOamPmStsDelayDmm2wyMax |
|
avr |
average inter-frame delay variation, round-trip |
tmnxOamPmStsDelayDmm2wyAvg |
|
mvf |
minimum inter-frame delay variation, forward |
tmnxOamPmStsDelayDmmFwdMin |
|
xvf |
maximum inter-frame delay variation, forward |
tmnxOamPmStsDelayDmmFwdMax |
|
avf |
average inter-frame delay variation, forward |
tmnxOamPmStsDelayDmmFwdAvg |
|
mvb |
minimum inter-frame delay variation, backward |
tmnxOamPmStsDelayDmmBwdMin |
|
xvb |
maximum inter-frame delay variation, backward |
tmnxOamPmStsDelayDmmBwdMax |
|
avb |
average inter-frame delay variation, backward |
tmnxOamPmStsDelayDmmBwdAvg |
|
mrr |
minimum frame delay range, round-trip |
tmnxOamPmStsDelayDmm2wyMin |
|
xrr |
maximum frame delay range, round-trip |
tmnxOamPmStsDelayDmm2wyMax |
|
arr |
average frame delay range, round-trip |
tmnxOamPmStsDelayDmm2wyAvg |
|
mrf |
minimum frame delay range, forward |
tmnxOamPmStsDelayDmmFwdMin |
|
xrf |
maximum frame delay range, forward |
tmnxOamPmStsDelayDmmFwdMax |
|
arf |
average frame delay range, forward |
tmnxOamPmStsDelayDmmFwdAvg |
|
mrb |
minimum frame delay range, backward |
tmnxOamPmStsDelayDmmBwdMin |
|
xrb |
maximum frame delay range, backward |
tmnxOamPmStsDelayDmmBwdMax |
|
arb |
average frame delay range, backward |
tmnxOamPmStsDelayDmmBwdAvg |
|
fdr |
frame delay bin record, round-trip |
None - header only |
|
fdf |
frame delay bin record, forward |
None - header only |
|
fdb |
frame delay bin record, backward |
None - header only |
|
fvr |
inter-frame delay variation bin record, round-trip |
None - header only |
|
fvf |
inter-frame delay variation bin record, forward |
None - header only |
|
fvb |
inter-frame delay variation bin record, backward |
None - header only |
|
frr |
frame delay range bin record, round-trip |
None - header only |
|
frf |
frame delay range bin record, forward |
None - header only |
|
frb |
frame delay range bin record, backward |
None - header only |
|
lbo |
Configured lower bound of the bin |
tmnxOamPmCfgBinLowerBound |
|
cnt |
Number of measurements within the configured delay range. Note that the session_name, interval_duration, interval_number, {fd, fdr, ifdv}, bin_number, and {forward, backward, round-trip} indexes are all provided by the surrounding XML context. |
tmnxOamPmStsDelayDmmBinFwdCount tmnxOamPmStsDelayDmmBinBwdCount tmnxOamPmStsDelayDmmBin2wyCount |
|
slm |
Synthetic Loss Measurement Record |
None - header only |
|
txf |
Transmitted frames in the forward direction |
tmnxOamPmStsLossSlmTxFwd |
|
rxf |
Received frames in the forward direction |
tmnxOamPmStsLossSlmRxFwd |
|
txb |
Transmitted frames in the backward direction |
tmnxOamPmStsLossSlmTxBwd |
|
rxb |
Received frames in the backward direction |
tmnxOamPmStsLossSlmRxBwd |
|
avf |
Available count in the forward direction |
tmnxOamPmStsLossSlmAvailIndFwd |
|
avb |
Available count in the backward direction |
tmnxOamPmStsLossSlmAvailIndBwd |
|
uvf |
Unavailable count in the forward direction |
tmnxOamPmStsLossSlmUnavlIndFwd |
|
uvb |
Unavailable count in the backward direction |
tmnxOamPmStsLossSlmUnavlIndBwd |
|
uaf |
Undetermined available count in the forward direction |
tmnxOamPmStsLossSlmUndtAvlFwd |
|
uab |
Undetermined available count in the backward direction |
tmnxOamPmStsLossSlmUndtAvlBwd |
|
uuf |
Undetermined unavailable count in the forward direction |
tmnxOamPmStsLossSlmUndtUnavlFwd |
|
uub |
Undetermined unavailable count in the backward direction |
tmnxOamPmStsLossSlmUndtUnavlBwd |
|
hlf |
Count of HLIs in the forward direction |
tmnxOamPmStsLossSlmHliFwd |
|
hlb |
Count of HLIs in the backward direction |
tmnxOamPmStsLossSlmHliBwd |
|
chf |
Count of CHLIs in the forward direction |
tmnxOamPmStsLossSlmChliFwd |
|
chb |
Count of CHLIs in the backward direction |
tmnxOamPmStsLossSlmChliBwd |
|
mff |
minimum FLR in the forward direction |
tmnxOamPmStsLossSlmMinFlrFwd |
|
xff |
maximum FLR in the forward direction |
tmnxOamPmStsLossSlmMaxFlrFwd |
|
aff |
average FLR in the forward direction |
tmnxOamPmStsLossSlmAvgFlrFwd |
|
mfb |
minimum FLR in the backward direction |
tmnxOamPmStsLossSlmMinFlrBwd |
|
xfb |
maximum FLR in the backward direction |
tmnxOamPmStsLossSlmMaxFlrBwd |
|
afb |
average FLR in the backward direction |
tmnxOamPmStsLossSlmAvgFlrBwd |
|
lmm |
Frame loss measurement record |
None - header only |
|
txf |
Transmitted frames in the forward direction |
tmnxOamPmStsLossLmmTxFwd |
|
rxf |
Received frames in the forward direction |
tmnxOamPmStsLossLmmRxFwd |
|
txb |
Transmitted frames in the backward direction |
tmnxOamPmStsLossLmmTxBwd |
|
rxb |
Received frames in the backward direction |
tmnxOamPmStsLossLmmRxBwd |
|
mff |
minimum FLR in the forward direction |
tmnxOamPmStsLossLmmMinFlrFwd |
|
xff |
maximum FLR in the forward direction |
tmnxOamPmStsLossLmmMaxFlrFwd |
|
aff |
average FLR in the forward direction |
tmnxOamPmStsLossLmmAvgFlrFwd |
|
mfb |
minimum FLR in the backward direction |
tmnxOamPmStsLossLmmMinFlrBwd |
|
xfb |
maximum FLR in the backward direction |
tmnxOamPmStsLossLmmMaxFlrBwd |
|
afb |
average FLR in the backward direction |
tmnxOamPmStsLossLmmAvgFlrBwd |
|
ave |
lmm availability enabled/disabled |
No TIMETRA-OAM-PM-MIB entry |
|
avf |
available count in the forward direction |
tmnxOamPmStsLossLmmAvailIndFwd |
|
avb |
available count in the backward direction |
tmnxOamPmStsLossLmmAvailIndBwd |
|
uvf |
unavailable count in the forward direction |
tmnxOamPmStsLossLmmUnavlIndFwd |
|
uvb |
unavailable count in the backward direction |
tmnxOamPmStsLossLmmUnavlIndBwd |
|
uaf |
undetermined available count in the forward direction |
tmnxOamPmStsLossLmmUndtAvlFwd |
|
uab |
undetermined available count in the backward direction |
tmnxOamPmStsLossLmmUndtAvlBwd |
|
uuf |
undetermined unavailable count in the forward direction |
tmnxOamPmStsLossLmmUndtUnavlFwd |
|
uub |
undetermined unavailable count in the backward direction |
tmnxOamPmStsLossLmmUndtUnavlBwd |
|
hlf |
count of HLIs in the forward direction |
tmnxOamPmStsLossLmmHliFwd |
|
hlb |
count of HLIs in the backward direction |
tmnxOamPmStsLossLmmHliBwd |
|
chf |
count of CHLIs in the forward direction |
tmnxOamPmStsLossLmmChliFwd |
|
chb |
count of CHLIs in the backward direction |
tmnxOamPmStsLossLmmChliBwd |
|
udf |
undetermined delta-t in the forward direction |
tmnxOamPmStsLossLmmUndetDelTsFwd |
|
udb |
undetermined delta-t in the backward direction |
tmnxOamPmStsLossLmmUndetDelTsBwd |
|
TLD |
TWAMP Light Delay Record |
None - header only |
|
mdr |
minimum frame delay, round-trip |
tmnxOamPmStsDelayTwl2wyMin |
|
xdr |
maximum frame delay, round-trip |
tmnxOamPmStsDelayTwl2wyMax |
|
adr |
average frame delay, round-trip |
tmnxOamPmStsDelayTwl2wyAvg |
|
mdf |
minimum frame delay, forward |
tmnxOamPmStsDelayTwlFwdMin |
|
xdf |
maximum frame delay, forward |
tmnxOamPmStsDelayTwlFwdMax |
|
adf |
average frame delay, forward |
tmnxOamPmStsDelayTwlFwdAvg |
|
mdb |
minimum frame delay, backward |
tmnxOamPmStsDelayTwlBwdMin |
|
xdb |
maximum frame delay, backward |
tmnxOamPmStsDelayTwlBwdMax |
|
adb |
average frame delay, backward |
tmnxOamPmStsDelayTwlBwdAvg |
|
mvr |
minimum inter-frame delay variation, round-trip |
tmnxOamPmStsDelayTwl2wyMin |
|
xvr |
maximum inter-frame delay variation, round-trip |
tmnxOamPmStsDelayTwl2wyMax |
|
avr |
average inter-frame delay variation, round-trip |
tmnxOamPmStsDelayTwl2wyAvg |
|
mvf |
minimum inter-frame delay variation, forward |
tmnxOamPmStsDelayTwlFwdMin |
|
xvf |
maximum inter-frame delay variation, forward |
tmnxOamPmStsDelayTwlFwdMax |
|
avf |
average inter-frame delay variation, forward |
tmnxOamPmStsDelayTwlFwdAvg |
|
mvb |
minimum inter-frame delay variation, backward |
tmnxOamPmStsDelayTwlBwdMin |
|
xvb |
maximum inter-frame delay variation, backward |
tmnxOamPmStsDelayTwlBwdMax |
|
avb |
average inter-frame delay variation, backward |
tmnxOamPmStsDelayTwlBwdAvg |
|
mrr |
minimum frame delay range, round-trip |
tmnxOamPmStsDelayTwl2wyMin |
|
xrr |
maximum frame delay range, round-trip |
tmnxOamPmStsDelayTwl2wyMax |
|
arr |
average frame delay range, round-trip |
tmnxOamPmStsDelayTwl2wyAvg |
|
mrf |
minimum frame delay range, forward |
tmnxOamPmStsDelayTwlFwdMin |
|
xrf |
maximum frame delay range, forward |
tmnxOamPmStsDelayTwlFwdMax |
|
arf |
average frame delay range, forward |
tmnxOamPmStsDelayTwlFwdAvg |
|
mrb |
minimum frame delay range, backward |
tmnxOamPmStsDelayTwlBwdMin |
|
xrb |
maximum frame delay range, backward |
tmnxOamPmStsDelayTwlBwdMax |
|
arb |
average frame delay range, backward |
tmnxOamPmStsDelayTwlBwdAvg |
|
fdr |
frame delay bin record, round-trip |
None - header only |
|
fdf |
frame delay bin record, forward |
None - header only |
|
fdb |
frame delay bin record, backward |
None - header only |
|
fvr |
inter-frame delay variation bin record, round-trip |
None - header only |
|
fvf |
inter-frame delay variation bin record, forward |
None - header only |
|
fvb |
inter-frame delay variation bin record, backward |
None - header only |
|
frr |
frame delay range bin record, round-trip |
None - header only |
|
frf |
frame delay range bin record, forward |
None - header only |
|
frb |
frame delay range bin record, backward |
None - header only |
|
lbo |
Configured lower bound of the bin |
tmnxOamPmCfgBinLowerBound |
|
cnt |
Number of measurements within the configured delay range. Note that the session_name, interval_duration, interval_number, {fd, fdr, ifdv}, bin_number, and {forward, backward, round-trip} indexes are all provided by the surrounding XML context. |
tmnxOamPmStsDelayTwlBinFwdCount tmnxOamPmStsDelayTwlBinBwdCount tmnxOamPmStsDelayTwlBin2wyCount |
|
TLL |
TWAMP Light Loss Record |
None - header only |
|
txf |
Transmitted frames in the forward direction |
tmnxOamPmStsLossTwlTxFwd |
|
rxf |
Received frames in the forward direction |
tmnxOamPmStsLossTwlRxFwd |
|
txb |
Transmitted frames in the backward direction |
tmnxOamPmStsLossTwlTxBwd |
|
rxb |
Received frames in the backward direction |
tmnxOamPmStsLossTwlRxBwd |
|
avf |
Available count in the forward direction |
tmnxOamPmStsLossTwlAvailIndFwd |
|
avb |
Available count in the backward direction |
tmnxOamPmStsLossTwlAvailIndBwd |
|
uvf |
Unavailable count in the forward direction |
tmnxOamPmStsLossTwlUnavlIndFwd |
|
uvb |
Unavailable count in the backward direction |
tmnxOamPmStsLossTwlUnavlIndBwd |
|
uaf |
Undetermined available count in the forward direction |
tmnxOamPmStsLossTwlUndtAvlFwd |
|
uab |
Undetermined available count in the backward direction |
tmnxOamPmStsLossTwlUndtAvlBwd |
|
uuf |
Undetermined unavailable count in the forward direction |
tmnxOamPmStsLossTwlUndtUnavlFwd |
|
uub |
Undetermined unavailable count in the backward direction |
tmnxOamPmStsLossTwlUndtUnavlBwd |
|
hlf |
Count of HLIs in the forward direction |
tmnxOamPmStsLossTwlHliFwd |
|
hlb |
Count of HLIs in the backward direction |
tmnxOamPmStsLossTwlHliBwd |
|
chf |
Count of CHLIs in the forward direction |
tmnxOamPmStsLossTwlChliFwd |
|
chb |
Count of CHLIs in the backward direction |
tmnxOamPmStsLossTwlChliBwd |
|
mff |
minimum FLR in the forward direction |
tmnxOamPmStsLossTwlMinFlrFwd |
|
xff |
maximum FLR in the forward direction |
tmnxOamPmStsLossTwlMaxFlrFwd |
|
aff |
average FLR in the forward direction |
tmnxOamPmStsLossTwlAvgFlrFwd |
|
mfb |
minimum FLR in the backward direction |
tmnxOamPmStsLossTwlMinFlrBwd |
|
xfb |
maximum FLR in the backward direction |
tmnxOamPmStsLossTwlMaxFlrBwd |
|
afb |
average FLR in the backward direction |
tmnxOamPmStsLossTwlAvgFlrBwd |
|
dm |
MPLS Delay Record |
None - header only |
|
mdr |
minimum frame delay, round-trip |
tmnxOamPmStsDelayMpls2wyMin |
|
xdr |
maximum frame delay, round-trip |
tmnxOamPmStsDelayMpls2wyMax |
|
adr |
average frame delay, round-trip |
tmnxOamPmStsDelayMpls2wyAvg |
|
mdf |
minimum frame delay, forward |
tmnxOamPmStsDelayMplsFwdMin |
|
xdf |
maximum frame delay, forward |
tmnxOamPmStsDelayMplsFwdMax |
|
adf |
average frame delay, forward |
tmnxOamPmStsDelayMplsFwdAvg |
|
mdb |
minimum frame delay, backward |
tmnxOamPmStsDelayMplsBwdMin |
|
xdb |
maximum frame delay, backward |
tmnxOamPmStsDelayMplsBwdMax |
|
adb |
average frame delay, backward |
tmnxOamPmStsDelayMplsBwdAvg |
|
mvr |
minimum inter-frame delay variation, roundtrip |
tmnxOamPmStsDelayMpls2wyMin |
|
xvr |
maximum inter-frame delay variation, roundtrip |
tmnxOamPmStsDelayMpls2wyMax |
|
avr |
average inter-frame delay variation, roundtrip |
tmnxOamPmStsDelayMpls2wyAvg |
|
mvf |
minimum inter-frame delay variation, forward |
tmnxOamPmStsDelayMplsFwdMin |
|
xvf |
maximum inter-frame delay variation, forward |
tmnxOamPmStsDelayMplsFwdMax |
|
avf |
average inter-frame delay variation, forward |
tmnxOamPmStsDelayMplsFwdAvg |
|
mvb |
minimum inter-frame delay variation, backward |
tmnxOamPmStsDelayMplsBwdMin |
|
xvb |
maximum inter-frame delay variation, backward |
tmnxOamPmStsDelayMplsBwdMax |
|
avb |
average inter-frame delay variation, backward |
tmnxOamPmStsDelayMplsBwdAvg |
|
mrr |
minimum frame delay range, round-trip |
tmnxOamPmStsDelayMpls2wyMin |
|
xrr |
maximum frame delay range, round-trip |
tmnxOamPmStsDelayMpls2wyMax |
|
arr |
average frame delay range, round-trip |
tmnxOamPmStsDelayMpls2wyAvg |
|
mrf |
minimum frame delay range, forward |
tmnxOamPmStsDelayMplsFwdMin |
|
xrf |
maximum frame delay range, forward |
tmnxOamPmStsDelayMplsFwdMax |
|
arf |
average frame delay range, forward |
tmnxOamPmStsDelayMplsFwdAvg |
|
mrb |
minimum frame delay range, backward |
tmnxOamPmStsDelayMplsBwdMin |
|
xrb |
maximum frame delay range, backward |
tmnxOamPmStsDelayMplsBwdMax |
|
arb |
average frame delay range, backward |
tmnxOamPmStsDelayMplsBwdAvg |
|
fdr |
frame delay bin record, round-trip |
None - header only |
|
fdf |
frame delay bin record, forward |
None - header only |
|
fdb |
frame delay bin record, backward |
None - header only |
|
fvr |
inter-frame delay variation bin record, roundtrip |
None - header only |
|
fvf |
inter-frame delay variation bin record, forward |
None - header only |
|
fvb |
inter-frame delay variation bin record, backward |
None - header only |
|
frr |
frame delay range bin record, round-trip |
None - header only |
|
frf |
frame delay range bin record, forward |
None - header only |
|
frb |
frame delay range bin record, backward |
None - header only |
|
cnt |
The number of measurements within the configured delay range. Note that the session_name, interval_duration, interval_number, {fd, fdr, ifdv}, bin_number, and {forward, backward, round-trip} indices are all provided by the surrounding XML context. |
tmnxOamPmStsDelayMplsBinFwdCount tmnxOamPmStsDelayMplsBinBwdCount tmnxOamPmStsDelayMplsBin2wyCount |
By default, the 15-min measurement interval stores 33 test runs (32+1) with a configurable range of 1 to 96, and the 1-hour measurement interval stores 9 test runs (8+1) with a configurable range of 1 to 24. The only storage for the 1-day measurement interval is 2 (1+1). This value for the 1-day measurement interval cannot be changed.
All three measurement intervals may be added to a single session if required. Each measurement interval that is included in a session is updated simultaneously for each test that is executing. If a measurement interval length is not required, it should not be configured.
In addition to the three predetermined length measurement intervals, a fourth ‟always on” raw measurement interval is allocated at test creation. Data collection for the raw measurement interval commences immediately following the execution of a no shutdown command. It is a valuable tool for assisting in real-time troubleshooting as it maintains the same performance information and relates to the same bins as the fixed length collection windows. The operator may clear the contents of the raw measurement interval and flush stale statistical data to look at current conditions. This measurement interval has no configuration options, cannot be written to flash memory, and cannot be disabled; it is a single never-ending window.
Memory allocation for the measurement intervals is performed when the test is configured. Volatile memory is not flushed until the test is deleted from the configuration; a high availability event causes the backup CPM or CPIOM to become the newly active CPM or CPIOM, or some other event clears the active CPM or CPIOM system memory. Shutting down a test does not release the allocated memory for the test.
Measurement intervals also include a suspect flag. The suspect flag is used to indicate that data collected in the measurement interval may not be representative. The flag is set to true only under the following conditions:
The time-of-day clock is adjusted by more than 10 seconds.
The test start does not align with the start boundary of the measurement interval. This would be common for the first execution for clock-aligned tests.
The test is stopped before the end of the measurement interval boundary.
The suspect flag is not set when there are times of service disruption, maintenance windows, discontinuity, low packet counts, or other such events. Higher-level systems would be required to interpret and correlate those types of events for measurement intervals that executed during the time that relates to the specific interruption or condition. Because each measurement interval contains a start and stop time, the information is readily available for higher-level systems to discount the specific windows of time.
Data structures and storage
There are two main metrics that are the focus of OAM-PM: delay and loss. The different metrics have two unique storage structures and allocate their own measurement intervals for these structures. This occurs regardless of whether the performance data is gathered with a single packet or multiple packet types.
Unidirectional and round-trip results are stored for each delay metric. The delay metrics are as follows:
- Frame Delay
- the amount of time required to send and receive the packet
- InterFrame Delay Variation
- the difference in the delay metrics between two adjacent packets
- Frame Delay Range
- the difference between the minimum frame delay and the individual packet
- Mean Frame Delay
- the mathematical average for the frame delay over the entire window
FD, IFDV, and FDR statistics are binnable results. FD, IFDV, FDR, and MFD all include minimum, maximum, and average values. Unidirectional and round-trip results are stored for each metric.
Unidirectional frame delay and frame delay range measurements require exceptional time-of-day clock synchronization. If the time-of-day clock does not exhibit extremely tight synchronization, unidirectional measurements is not representative. In one direction, the measurement is artificially increased by the difference in the clocks. In the other direction, the measurement is artificially decreased by the difference in the clocks. This level of clocking accuracy is not available with NTP. To achieve this level of time-of-day clock synchronization, Precision Time Protocol (PTP) 1588v2 should be considered.
Round-trip metrics do not require clock synchronization between peers, because the four timestamps allow for accurate representation of the round-trip delay. The mathematical computation removes remote processing and any difference in time-of-day clocking. Round-trip measurements do require stable local time-of-day clocks.
Any delay metric that is negative is treated as zero and placed in bin 0, the lowest bin, which has a lower boundary of 0 microseconds.
Delay results are mapped to the measurement interval that is active when the result arrives back at the source.
There are no supported log events based on delay metrics.
Loss metrics are only unidirectional and report Frame Loss Ratio (FLR) and availability information. FLR is the computation of loss (lost/sent) over time. Loss measurements during periods of unavailability are not included in the FLR calculation as they are counted against the unavailability metric.
Availability requires relating three different functions. First, the individual probes are marked as available or unavailable based on sequence numbers in the protocol. A number of probes are rolled up into a small measurement window, typically 1 s. FLR is computed over all the probes in a small window. If the resulting percentage is higher than the configured threshold, the small window is marked as unavailable. If the resulting percentage is lower than the threshold, the small window is marked as available. A sliding window is defined as some number of small windows, typically 10. The sliding window is used to determine availability and unavailability events. Switching from one state to the other requires every small window in the sliding window to be the same state and different from the current state.
Availability and unavailability counters are incremented based on the number of small windows that have occurred in all available and unavailable windows.
Availability and unavailability using synthetic loss measurements is meant to capture the loss behavior for the service. It is not meant to capture and report on service outages or communication failures. Communication failures of a bidirectional or unidirectional nature must be captured using some other means of connectivity verification, alarming, or continuity checking. During times of complete or extended failure periods it becomes necessary to timeout individual test probes. It is not possible to determine the direction of the loss because no response packets are being received back on the source. In this case, the statistics calculation engine maintains the previous state, updating the appropriate directional availability or unavailability counter. At the same time, an additional per-direction undetermined counter is updated. This undetermined counter is used to indicate that the availability or unavailability statistics could not be determined for a number of small windows.
During connectivity outages, the higher-level systems can be used to discount the loss measurement interval, which covers the same span as the outage.
Availability and unavailability computations may delay the completion of a measurement interval. The declaration of a state change or the delay to a closing a measurement interval could be equal to the length of the sliding window and the timeout of the last packet. Closing of a measurement interval cannot occur until the sliding window has determined availability or unavailability. If the availability state is changing, and the determination is crossing two measurement intervals, the measurement interval does not complete until the declaration has occurred. Typically, standard bodies indicate the timeout per packet. In the case of Ethernet, DMMv1, and SLM, timeout values are set at 5 s and cannot be configured.
There are no log events based on availability or unavailability state changes.
During times of availability, there can be times of high loss intervals (HLI) or consecutive high loss intervals (CHLI). These are indicators that the service was available but individual small windows or consecutive small windows experienced FLRs exceeding the configured acceptable limit. A HLI is any single small window that exceeds the configured FLR. This could equate to a severely errored second, assuming the small window is one second in length. A CHIL is a consecutive high loss interval that exceeds a consecutive threshold within the sliding window. Only one HLI is counted for a window.
Availability can only be reasonably determined with synthetic packets. This is because the synthetic packet is the packet being counted and provides a uniform packet flow that can be used for the computation. Transmit and receive counter-based approaches cannot reliably be used to determine availability because there is no guarantee that service data is on the wire, or the service data on the wire uniformity could make it difficult to make a declaration valid.
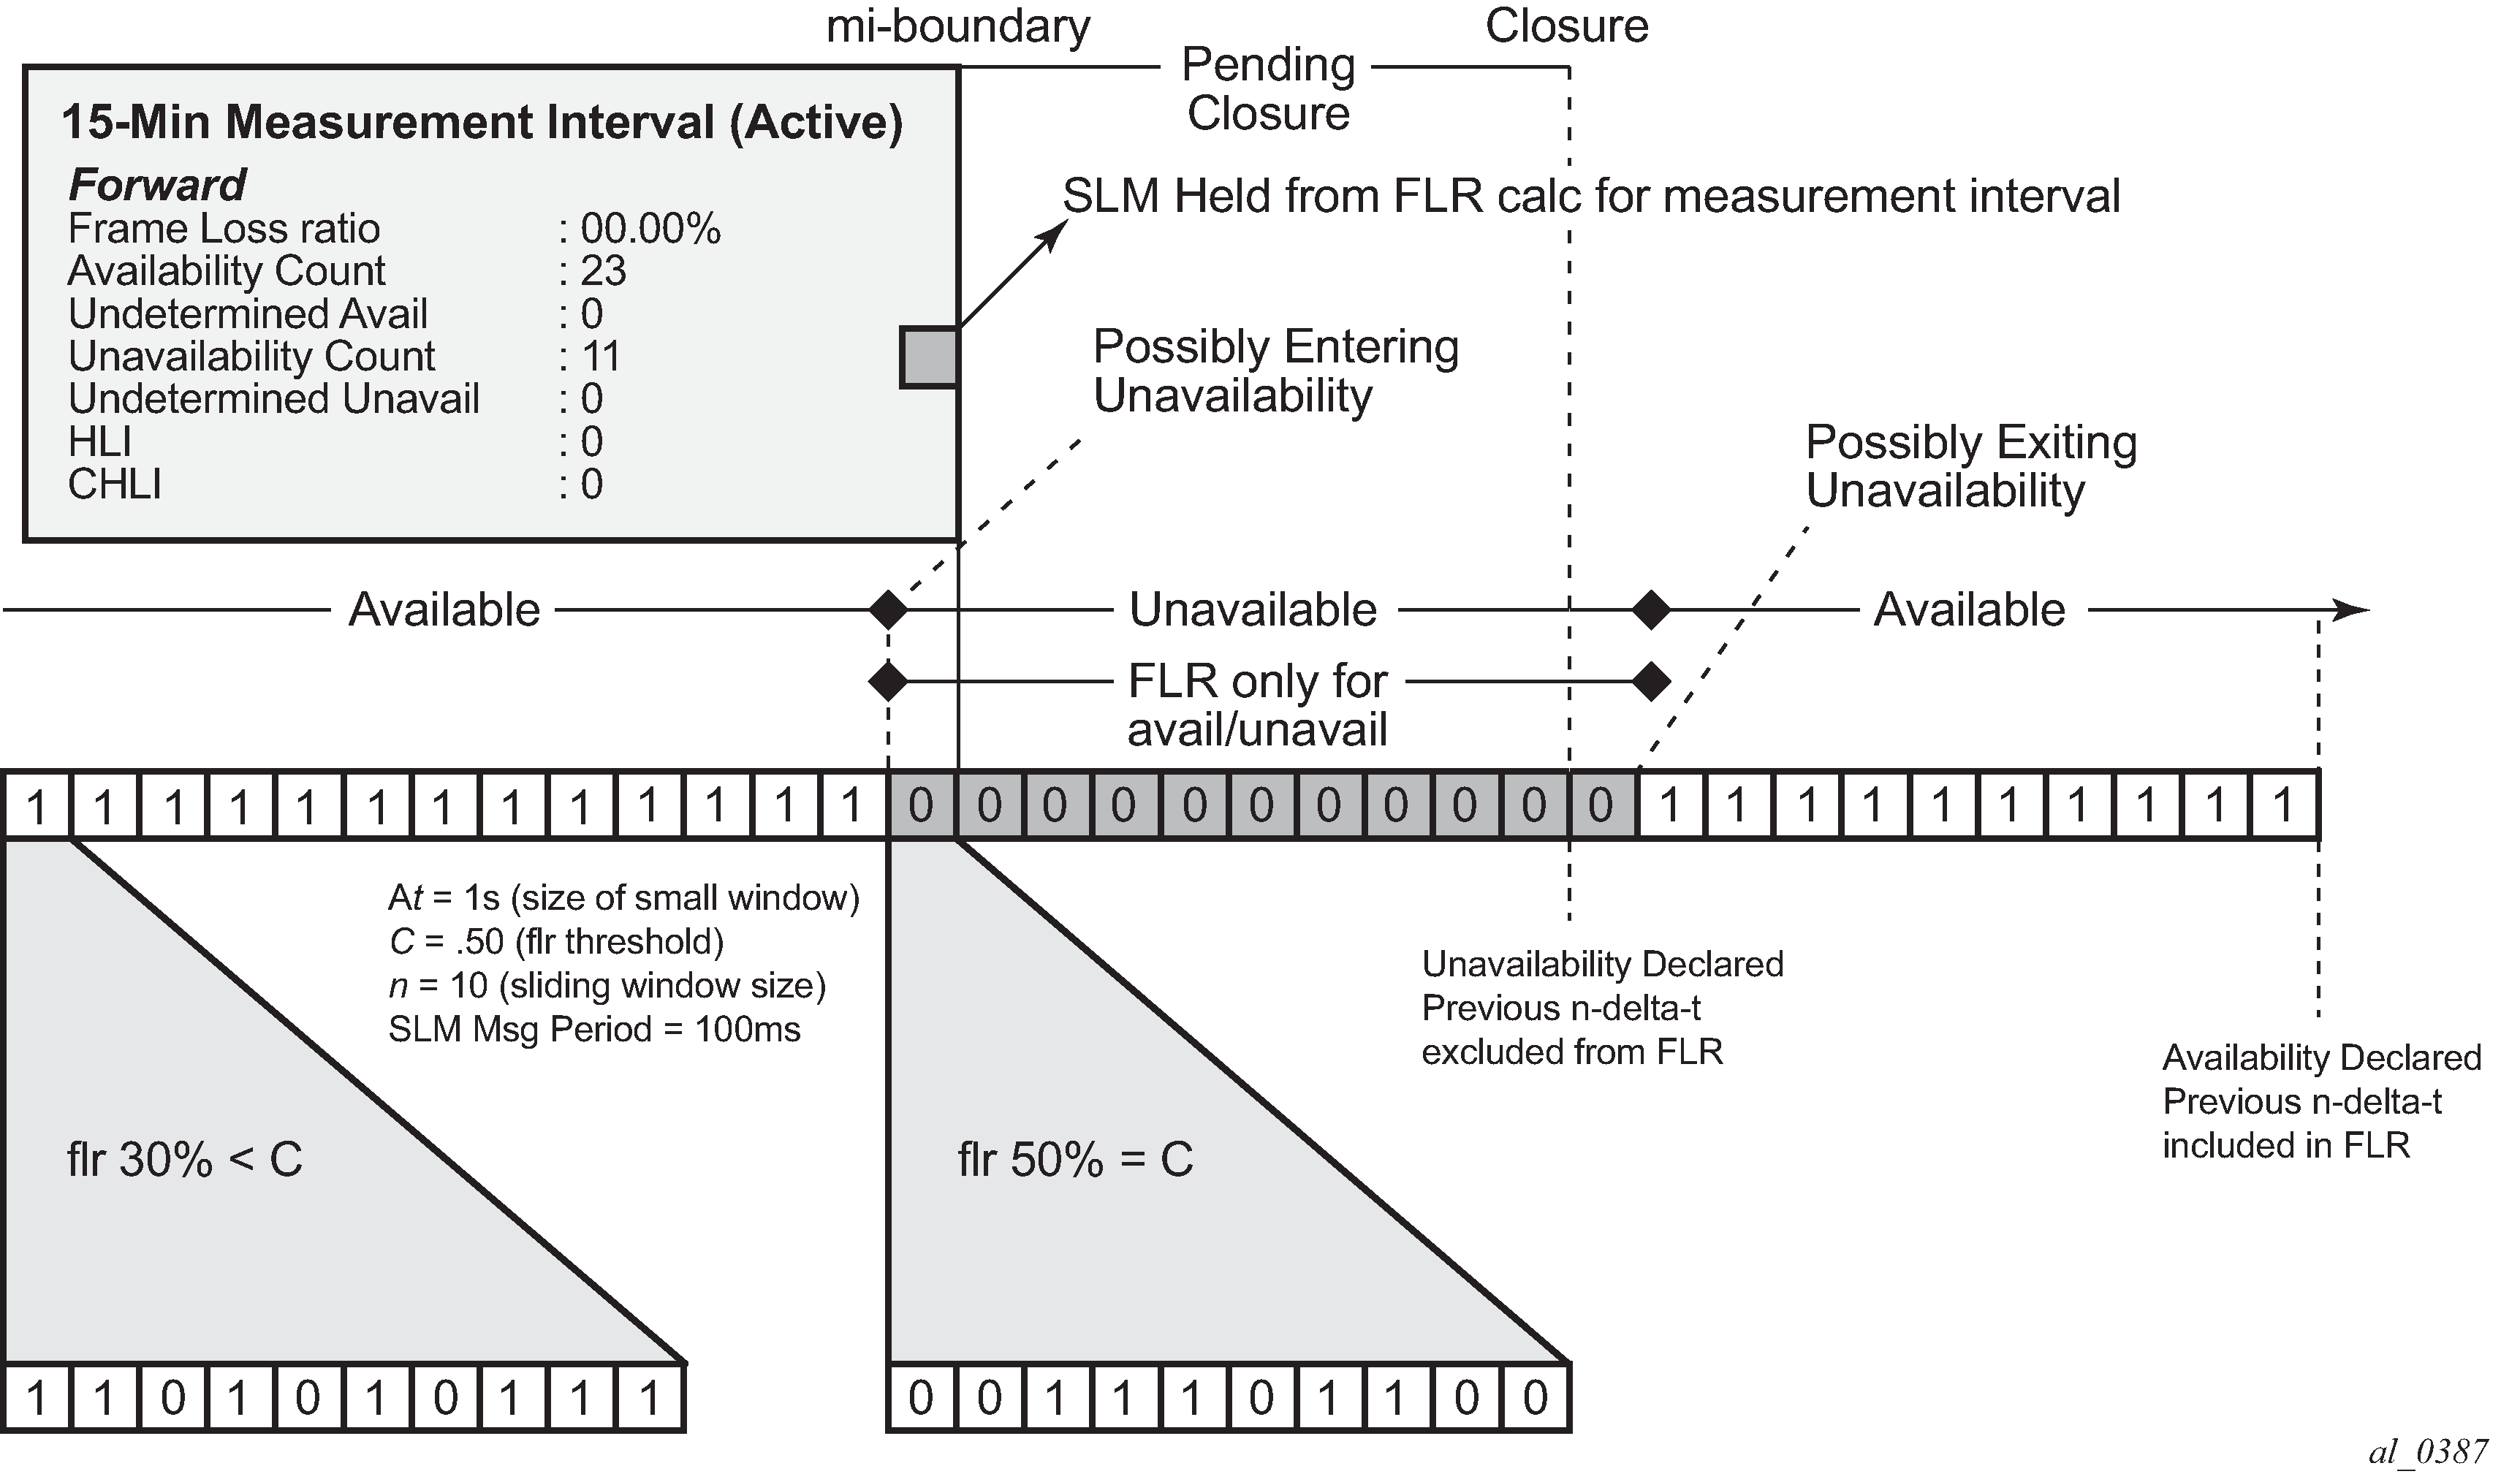
Evaluating and computing loss and availability shows loss in a single direction using synthetic packets, and demonstrates what happens when a possible unavailability event crosses a measurement interval boundary. In the diagram, the first 13 small windows are all marked available (1), which means that the loss probes that fit into each of those small windows did not equal or exceed a frame loss ratio of 50%. The next 11 small windows are marked as unavailable, which means that the loss probes that fit into each of those small windows were equal to or above a frame loss ratio of 50%. After the 10th consecutive small window of unavailability, the state transitions from available to unavailable. The 25th small window is the start of the new available state which is declared following the 10th consecutive available small window.
The frame loss ratio is 00.00%; this is because all the small windows that are marked as unavailable are counted toward unavailability, and are therefore excluded from impacting the FLR. If there were any small windows of unavailability that were outside of an unavailability event, they would be marked as HLI or CHLI and be counted as part of the frame loss ratio.
Bin groups
Bin groups are templates that are referenced by the session. Three types of binnable delay metric types are available: FD, IFDV, and FDR; all of which are available in forward, backward, and round-trip directions. Each of these metrics can have up to ten bin groups configured to group the results. Bin groups are configured by indicating a lower boundary. Bin 0 has a lower boundary that is always zero and is not configurable. The microsecond range of the bins is the difference between the adjacent lower boundaries. For example, bin-type fd bin 1 configured with lower-bound 1000 means that bin 0 captures all frame delay statistics results between 0 and 1 ms. Bin 1 captures all results above 1 ms and below the bin 2 lower boundary. The last bin configured represents the bin that collects all the results at and above that value. Not all ten bins have to be configured.
Each binnable delay metric type requires their own values for the bin groups. Each bin in a type is configurable for one value. It is not possible to configure a bin with different values for round-trip, forward, and backward. Consider the configuration of the boundaries that represent the important statistics for that specific service.
As stated earlier in this section, this is not a dynamic environment. If a bin group is being referenced by any active test, the bin group cannot shut down. To modify the bin group, it must be shut down. If the configuration of a bin group must be changed, and a large number of sessions are referencing the bin group, migrating existing sessions to a new bin group with the new parameters can be considered to reduce the maintenance window. To modify any session parameter, every test in the session must be shut down.
Bin group 1 is the default bin group. Every session requires a bin group to be assigned. By default, bin group 1 is assigned to every OAM-PM session that does not have a bin group explicitly configured. Bin group 1 cannot be modified. The bin group 1 configuration parameters are as follows:
-------------------------------------------------------------------------------
Configured Lower Bounds for Delay Measurement (DMM) Tests, in microseconds
-------------------------------------------------------------------------------
Group Description                    Admin Bin     FD(us)    FDR(us)   IFDV(us)
-------------------------------------------------------------------------------
1     OAM PM default bin group (not*    Up   0          0          0          0
                                             1       5000       5000       5000
                                             2      10000          -          -
-------------------------------------------------------------------------------
Delay results streaming
Service Level Agreements (SLAs) typically require that performance data is collected over five-minute (or longer) measurement intervals. Network optimization tools require average performance values to be computed over shorter periods of time. The OAM-PM streaming function takes advantage of the OAM-PM architecture and test definitions to provide the basis for short window average results streaming.
The delay-template configuration allows users to define the common parameters: metric type, direction, length of the sample window, and integrity value. After the template is defined, it can be assigned to the appropriate technology to support tests for collection, calculation, and reporting. The results of the process are sent using on-change update notifications to subscribers.
The streaming function is supported for Ethernet DMM tests and IP TWAMP-light (delay) tests.
The updates are sent only if a subscription is registered for the on-change values. The keys are common for each individual test: session session-name, metric metric-id, and newest-closed direction. The following values are sent for each completed sample window:
close-time (UTC)
sample-count (number of samples used to compute delay)
suspect (equal to or greater than the window-integrity percentage = no | lower = yes)
delay (compute value over the window in micro-seconds)
No history is maintained on the node for this information. The single statistic is overwritten every time a sample window closes for a test configured to use a delay template. The higher-level systems are responsible for storing and using this data.
Relating the components
Relating OAM-PM components shows the architecture of all of the OAM-PM concepts previously discussed. It shows a more detailed hierarchy than previously shown in the introduction. This shows the relationship between the tests, the measurement intervals, and the storage of the results.
Monitoring
The following configuration examples demonstrate the show and monitoring commands available to check OAM-PM.
Accounting policy configuration
config>log# info
----------------------------------------------
        file-id 1
            description "OAM PM XML file Paramaters"
            location cf2:
            rollover 10 retention 2
        exit
        accounting-policy 1
            description "Default OAM PM Collection Policy for 15-min Bins"
            record complete-pm
            collection-interval 5
            to file 1
            no shutdown
        exit
        log-id 1
        exit
----------------------------------------------
ETH-CFM configuration
config>eth-cfm# info
----------------------------------------------
        domain 12 format none level 2
            association 4 format string name "vpls4-0000001"
                bridge-identifier 4
                exit
                ccm-interval 1
                remote-mepid 30
            exit
        exit
Service configuration
config>service>vpls# info
----------------------------------------------
            description "OAM PM Test Service to v30"
            stp
                shutdown
            exit
            sap 1/1/10:4.* create
                eth-cfm
                    mep 28 domain 12 association 4 direction up
                        ccm-enable
                        mac-address 00:00:00:00:00:28
                        no shutdown
                    exit
                exit
            exit
            sap 1/2/1:4.* create
            exit
            no shutdown
OAM-PM configuration
config>oam-pm#info detail
-----------------------------------------------
        bin-group 2 fd-bin-count 10 fdr-bin-count 2 ifdv-bin-count 10 create
            no description
            bin-type fd
                bin 1
                    lower-bound 1000
                exit
                bin 2
                    lower-bound 2000
                exit
                bin 3
                    lower-bound 3000
                exit
                bin 4
                    lower-bound 4000
                exit
                bin 5
                    lower-bound 5000
                exit
                bin 6
                    lower-bound 6000
                exit
                bin 7
                    lower-bound 7000
                exit
                bin 8
                    lower-bound 8000
                exit
                bin 9
                    lower-bound 10000
                exit
            exit
            bin-type fdr
                bin 1
                    lower-bound 5000
                exit
            exit
            bin-type ifdv
                bin 1
                    lower-bound 100
                exit
                bin 2
                    lower-bound 200
                exit
                bin 3
                    lower-bound 300
                exit
                bin 4
                    lower-bound 400
                exit
                bin 5
                    lower-bound 500
                exit
                bin 6
                    lower-bound 600
                exit
                bin 7
                    lower-bound 700
                exit
                bin 8
                    lower-bound 800
                exit
                bin 9
                    lower-bound 1000
                exit
            exit
            no shutdown
        exit
        session "eth-pm-service-4" test-family Ethernet session-
type proactive create
            bin-group 2
            no description
            meas-interval 15-mins create
                no accounting-policy
                boundary-type clock-aligned
                clock-offset 0
                intervals-stored 32
            exit
            Ethernet
                dest-mac 00:00:00:00:00:30
                priority 0
                source mep 28 domain 12 association 4
                dmm test-id 10004 create
                    data-tlv-size 1000
                    interval 1000
                    no test-duration
                    no shutdown
                exit
                slm test-id 10004 create
                    data-tlv-size 1000
                    flr-threshold 50
                    no test-duration
                    timing frames-per-delta-t 10 consec-delta-t 10 interval 100
                           chli-threshold 4
                    no shutdown
                exit
            exit
        exit
Show and monitor commands
show oam-pm bin-group
-------------------------------------------------------------------------------
Configured Lower Bounds for Delay Measurement (DMM) Tests, in microseconds
-------------------------------------------------------------------------------
Group Description Admin Bin FD(us) FDR(us) IFDV(us)
-------------------------------------------------------------------------------
1 OAM PM default bin group (not* Up 0 0 0 0
1 5000 5000 5000
2 10000 - -
-------------------------------------------------------------------------------
2 Up 0 0 0 0
1 1000 5000 100
2 2000 - 200
3 3000 - 300
4 4000 - 400
5 5000 - 500
6 6000 - 600
7 7000 - 700
8 8000 - 800
9 10000 - 1000
-------------------------------------------------------------------------------
-------------------------------------------------------------------------------
* indicates that the corresponding row element may have been truncated.
show oam-pm bin-group 2
-------------------------------------------------------------------------------
Configured Lower Bounds for Delay Measurement (DMM) Tests, in microseconds
-------------------------------------------------------------------------------
Group Description Admin Bin FD(us) FDR(us) IFDV(us)
-------------------------------------------------------------------------------
2 Up 0 0 0 0
1 1000 5000 100
2 2000 - 200
3 3000 - 300
4 4000 - 400
5 5000 - 500
6 6000 - 600
7 7000 - 700
8 8000 - 800
9 10000 - 1000
-------------------------------------------------------------------------------
show oam-pm bin-group-using
=========================================================================
OAM Performance Monitoring Bin Group Configuration for Sessions
=========================================================================
Bin Group Admin Session Session State
-------------------------------------------------------------------------
2 Up eth-pm-service-4 Act
-------------------------------------------------------------------------
=========================================================================
show oam-pm bin-group-using bin-group 2
=========================================================================
OAM Performance Monitoring Bin Group Configuration for Sessions
=========================================================================
Bin Group Admin Session Session State
-------------------------------------------------------------------------
2 Up eth-pm-service-4 Act
-------------------------------------------------------------------------
=========================================================================
show oam-pm sessions test-family Ethernet
============================================================================
OAM Performance Monitoring Session Summary for the Ethernet Test Family
============================================================================
Session State Bin Group Sess Type Test Types
----------------------------------------------------------------------------
eth-pm-service-4 Act 2 proactive DMM SLM
============================================================================
show oam-pm session "eth-pm-service-4" all
-------------------------------------------------------------------------------
Basic Session Configuration
-------------------------------------------------------------------------------
Session Name : eth-pm-service-4
Description : (Not Specified)
Test Family : Ethernet Session Type : proactive
Bin Group : 2
-------------------------------------------------------------------------------
-------------------------------------------------------------------------------
Ethernet Configuration
-------------------------------------------------------------------------------
Source MEP : 28 Priority : 0
Source Domain : 12 Dest MAC Address : 00:00:00:00:00:30
Source Assoc'n : 4
-------------------------------------------------------------------------------
-------------------------------------------------------------------------------
DMM Test Configuration and Status
-------------------------------------------------------------------------------
Test ID : 10004 Admin State : Up
Oper State : Up Data TLV Size : 1000 octets
On-Demand Duration: Not Applicable On-Demand Remaining: Not Applicable
Interval : 1000 ms
-------------------------------------------------------------------------------
-------------------------------------------------------------------------------
SLM Test Configuration and Status
-------------------------------------------------------------------------------
Test ID : 10004 Admin State : Up
Oper State : Up Data TLV Size : 1000 octets
On-Demand Duration: Not Applicable On-Demand Remaining: Not Applicable
Interval : 100 ms
CHLI Threshold : 4 HLIs Frames Per Delta-T : 10 SLM frames
Consec Delta-Ts : 10 FLR Threshold : 50%
-------------------------------------------------------------------------------
-------------------------------------------------------------------------------
15-mins Measurement Interval Configuration
-------------------------------------------------------------------------------
Duration : 15-mins Intervals Stored : 32
Boundary Type : clock-aligned Clock Offset : 0 seconds
Accounting Policy : none
-------------------------------------------------------------------------------
-------------------------------------------------------------------------------
Configured Lower Bounds for Delay Measurement (DMM) Tests, in microseconds
-------------------------------------------------------------------------------
Group Description Admin Bin FD(us) FDR(us) IFDV(us)
-------------------------------------------------------------------------------
2 Up 0 0 0 0
1 1000 5000 100
2 2000 - 200
3 3000 - 300
4 4000 - 400
5 5000 - 500
6 6000 - 600
7 7000 - 700
8 8000 - 800
9 10000 - 1000
-------------------------------------------------------------------------------
show oam-pm statistics session "eth-pm-service-4" dmm meas-interval 15-
mins interval-number 2 all
------------------------------------------------------------------------------
Start (UTC) : 2014/02/01 10:00:00 Status : completed
Elapsed (seconds) : 900 Suspect : no
Frames Sent : 900 Frames Received : 900
------------------------------------------------------------------------------
----------------------------------------------------------------------
Bin Type Direction Minimum (us) Maximum (us) Average (us)
----------------------------------------------------------------------
FD Forward 0 8330 712
FD Backward 143 11710 2605
FD Round Trip 1118 14902 3111
FDR Forward 0 8330 712
FDR Backward 143 11710 2605
FDR Round Trip 0 13784 1990
IFDV Forward 0 8330 431
IFDV Backward 1 10436 800
IFDV Round Trip 2 13542 1051
----------------------------------------------------------------------
---------------------------------------------------------------
Frame Delay (FD) Bin Counts
---------------------------------------------------------------
Bin Lower Bound Forward Backward Round Trip
---------------------------------------------------------------
0 0 us 624 53 0
1 1000 us 229 266 135
2 2000 us 29 290 367
3 3000 us 4 195 246
4 4000 us 7 71 94
5 5000 us 5 12 28
6 6000 us 1 7 17
7 7000 us 0 1 5
8 8000 us 1 4 3
9 10000 us 0 1 5
---------------------------------------------------------------
---------------------------------------------------------------
Frame Delay Range (FDR) Bin Counts
---------------------------------------------------------------
Bin Lower Bound Forward Backward Round Trip
---------------------------------------------------------------
0 0 us 893 875 873
1 5000 us 7 25 27
---------------------------------------------------------------
---------------------------------------------------------------
Inter-Frame Delay Variation (IFDV) Bin Counts
---------------------------------------------------------------
Bin Lower Bound Forward Backward Round Trip
---------------------------------------------------------------
0 0 us 411 162 96
1 100 us 113 115 108
2 200 us 67 84 67
3 300 us 56 67 65
4 400 us 36 46 53
5 500 us 25 59 54
6 600 us 25 27 38
7 700 us 29 34 22
8 800 us 41 47 72
9 1000 us 97 259 325
---------------------------------------------------------------
show oam-pm statistics session "eth-pm-service-4" slm meas-interval 15-
mins interval-number 2
------------------------------------------------------------------------------
Start (UTC) : 2014/02/01 10:00:00 Status : completed
Elapsed (seconds) : 900 Suspect : no
Frames Sent : 9000 Frames Received : 9000
------------------------------------------------------------------------------
------------------------------------------------------
Frames Sent Frames Received
------------------------------------------------------
Forward 9000 9000
Backward 9000 9000
------------------------------------------------------
-------------------------------------------
Frame Loss Ratios
-------------------------------------------
Minimum Maximum Average
-------------------------------------------
Forward 0.000% 0.000% 0.000%
Backward 0.000% 0.000% 0.000%
-------------------------------------------
-------------------------------------------------------------------------------
Availability Counters (Und = Undetermined)
-------------------------------------------------------------------------------
Available Und-Avail Unavailable Und-Unavail HLI CHLI
-------------------------------------------------------------------------------
Forward 900 0 0 0 0 0
Backward 900 0 0 0 0 0
-------------------------------------------------------------------------------
show oam-pm statistics session "eth-pm-service-4" dmm meas-interval raw
------------------------------------------------------------------------------
Start (UTC) : 2014/02/01 09:43:58 Status : in-progress
Elapsed (seconds) : 2011 Suspect : yes
Frames Sent : 2011 Frames Received : 2011
------------------------------------------------------------------------------
----------------------------------------------------------------------
Bin Type Direction Minimum (us) Maximum (us) Average (us)
----------------------------------------------------------------------
FD Forward 0 11670 632
FD Backward 0 11710 2354
FD Round Trip 1118 14902 2704
FDR Forward 0 11670 611
FDR Backward 0 11710 2353
FDR Round Trip 0 13784 1543
IFDV Forward 0 10027 410
IFDV Backward 0 10436 784
IFDV Round Trip 0 13542 1070
----------------------------------------------------------------------
---------------------------------------------------------------
Frame Delay (FD) Bin Counts
---------------------------------------------------------------
Bin Lower Bound Forward Backward Round Trip
---------------------------------------------------------------
0 0 us 1465 252 0
1 1000 us 454 628 657
2 2000 us 62 593 713
3 3000 us 8 375 402
4 4000 us 11 114 153
5 5000 us 7 26 41
6 6000 us 2 10 20
7 7000 us 0 2 8
8 8000 us 1 10 11
9 10000 us 1 1 6
---------------------------------------------------------------
---------------------------------------------------------------
Frame Delay Range (FDR) Bin Counts
---------------------------------------------------------------
Bin Lower Bound Forward Backward Round Trip
---------------------------------------------------------------
0 0 us 2001 1963 1971
1 5000 us 11 49 41
---------------------------------------------------------------
---------------------------------------------------------------
Inter-Frame Delay Variation (IFDV) Bin Counts
---------------------------------------------------------------
Bin Lower Bound Forward Backward Round Trip
---------------------------------------------------------------
0 0 us 954 429 197
1 100 us 196 246 197
2 200 us 138 168 145
3 300 us 115 172 154
4 400 us 89 96 136
5 500 us 63 91 108
6 600 us 64 53 89
7 700 us 61 55 63
8 800 us 112 82 151
9 1000 us 219 619 771
---------------------------------------------------------------
show oam-pm statistics session "eth-pm-service-4" slm meas-interval raw
------------------------------------------------------------------------------
Start (UTC) : 2014/02/01 09:44:03 Status : in-progress
Elapsed (seconds) : 2047 Suspect : yes
Frames Sent : 20470 Frames Received : 20469
------------------------------------------------------------------------------
------------------------------------------------------
Frames Sent Frames Received
------------------------------------------------------
Forward 20329 20329
Backward 20329 20329
------------------------------------------------------
-------------------------------------------
Frame Loss Ratios
-------------------------------------------
Minimum Maximum Average
-------------------------------------------
Forward 0.000% 0.000% 0.000%
Backward 0.000% 0.000% 0.000%
-------------------------------------------
-------------------------------------------------------------------------------
Availability Counters (Und = Undetermined)
-------------------------------------------------------------------------------
Available Und-Avail Unavailable Und-Unavail HLI CHLI
-------------------------------------------------------------------------------
Forward 2033 0 0 0 0 0
Backward 2033 0 0 0 0 0
-------------------------------------------------------------------------------
The monitor command can be used to automatically update the statistics for the raw measurement interval.
Service Assurance Agent
The Service Application Agent (SAA) tool allows operators to configure several tests that provide performance information such as delay, jitter, and loss of services or network segments. The test results are saved in SNMP tables or summarized XML files. These results can be collected and reported on using network management systems.
SAA uses resources allocated to various OAM processes. These processes are not dedicated to SAA but are shared throughout the system. SAA test and descriptions describes the logical groups of different OAM functions.
| Test | Description |
|---|---|
Background |
Tasks are configured outside the SAA hierarchy that consume OAM task resources. Specifically, these include SDP keepalive, static route CPE check, filter redirect policy, ping test, and VRRP policy host unreachable. These are critical tasks that ensure the network operation and may affect data forwarding or network convergence. |
SAA Continuous |
SAA tests configured as continuous (always scheduled) |
SAA non-continuous |
SAA tests that are not configured as continuous, and are scheduled outside the SAA application. The oam saa test-name start command is required to initiate the test run. |
Non-SAA (Directed) |
Tasks that do not include any configuration under SAA. These tests are SNMP or via the CLI that is used to troubleshoot or profile network condition. This would take the form ‟oam test-type”, or ping or traceroute with the specific test parameters. |
Y.1731 defines two approaches for measuring frame delay and frame delay variation: single-ended and dual-ended. SAA supports the single-ended approach.
SAA test types are restricted to tests that use a request response mechanism; that is, single-ended tests. Dual-ended tests that initiate the test on one node but require the statistical gathering on the other node are not supported under SAA.
Post-processing analysis of individual test runs can be used to determine the success or failure of these runs. The operator can set rising and lowering thresholds for delay, jitter, and loss. Exceeding the threshold causes the Last Test Result field to display the Failed keyword. A trap can be generated when the test fails. The operator can also configure a probe failure threshold and trap when these thresholds are exceeded.
Each supported test type has test-specific configuration properties. Not all options, intervals, and parameters are available for all tests. Some configuration parameters, such as the sub-second probe interval, require specific hardware.
Trace type tests apply the timeout to each individual packet, which may affect spacing. Packet timeout is required to move from one probe to the next probe. For tests that do not require this type of behavior, typically ping and ETH-CFM PM functions, the probes are sent at the specified interval and the timeout is only applied at the end of the test if any probe is lost during the run. When the timeout is applied at the end of the run, the test is considered complete either when all responses are received or the timeout expires at the end of the test run. For tests marked continuous (always scheduled), the spacing between runs may be delayed by the timeout value when a packet is lost. The test run is complete when all probes have either been received back or the timeout value has expired.
To preserve system resources, specifically memory, the operator should only store summarized history results. By default, summary results are stored for tests configured with sub-second probe intervals or a probe count above 100, or is written to a file. By default, per-probe information is stored for tests configured with an interval of one second counters or above and probe counts of 100 or less, and is not written to a file. The operator may choose to override these defaults using the probe-history {keep | drop | auto} command options. The auto option sets the preceding defaults. The other options override the default retention schemes based on the operator requirements. The keep option retains and stores per-probe information and the drop option stores summary-only information. The probe data can be viewed using the show saa test command. If the per-probe information is retained, this data is available at the completion of the test run. The summary data is updated throughout the test run. The overall memory system usage is available using the show system memory-pools command. The OAM entry represents the overall memory usage. This includes the history data stored for SAA tests. A clear saa testname option is available to release the memory and flush test results.
SAA-launched tests maintain the two most recently completed tests and one in progress test. It is important to ensure that the collection and accounting record process is configured to write the data to file before it is overwritten. After the results are overwritten, they are lost.
Any data not written to file is lost on a CPU switchover.
The operator can use the following show, clear, and monitor commands to monitor the test OAM toolset:
The show test-oam oam-config-summary command provides information about the configured tests.
The show test-oam oam-perf command provides the transmit (launched form me) rate information and remotely launched test receive rate on the local network element.
The clear test-oam oam-perf command provides the ability to clear the test OAM performance statistics for a current view of the different rates in the preceding oam-perf command.
The monitor test-oam oam-perf command provides time sliced performance statistics for test oam functions.