Custom dashboards
The visualisation feature comes with a set of default Grafana dashboards. Service providers can update this list if they need.
For more information to create custom dashboards, refer to https://grafana.com/docs/grafana/latest/.
Creating a sample custom dashboard
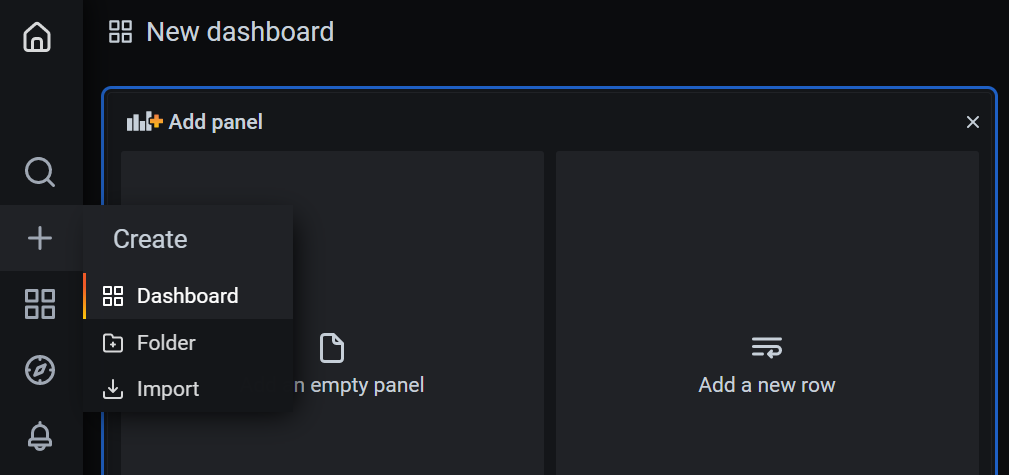
Perform the following steps to create an Intelligent Data Store custom dashboard.- In the New dashboard/Edit panel, select IDS
DataSource from the data source selector to link the Intelligent
Data Store DataSource to Grafana.
Grafana supports different data sources from where you can source or pull data. During enterprise provisioning, the Intelligent Data Store creates one default data source namely, IDS DataSource. When creating dashboards, select this pre-configured IDS DataSource from the drop-down to query the Intelligent Data Source Data APIs.
Figure 2. Creating an Intelligent Data Store custom dashboard 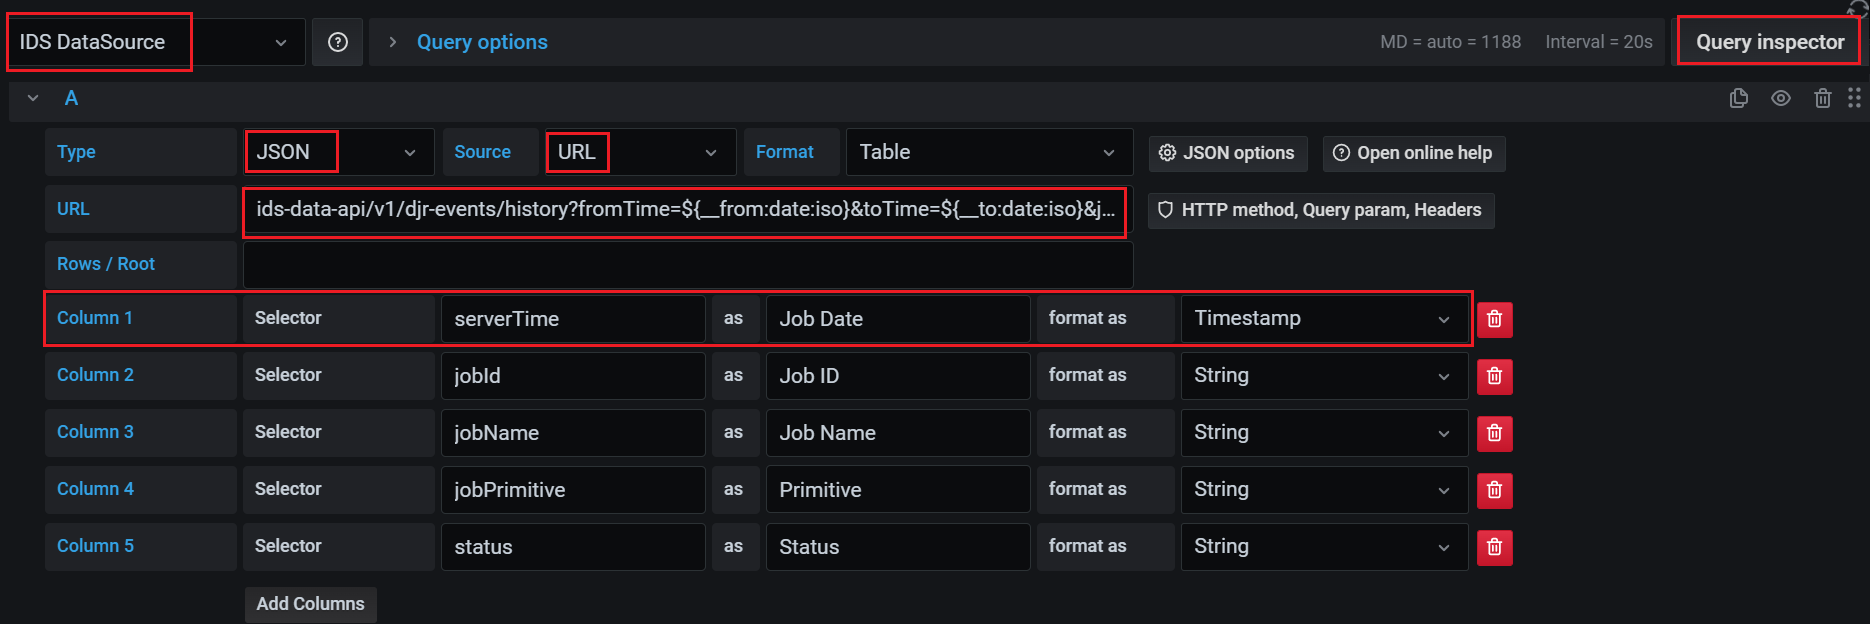
- Set the following parameters:
- Type: Select JSON from the drop-down as Intelligent Data Store API supports JSON format.
- Source: URL
- In the URL field box, specify the required Intelligent
Data Store API. URL has to be the context path of the Intelligent Data Store
API.
Example: For Device Job Report History, specify the URL as
ids-data-api/v1/djr-events/history?fromTime=${__from:date:iso}&toTime=${__to:date:iso}.For Intelligent Data Store APIs and their parameters supported by IMPACT IoT, see Intelligent Data Store API Reference Swagger document.
- Configure the Column details for the data you want to
display for the selected API. To add more columns, use the Add
columns option.
Output data formats of the APIs are detailed in the Swagger document. For more details see Intelligent Data Store API Reference Swagger document.
- Select the visualization option from Show Options >
Visualization side panel.
Figure 3. Visualization option panel 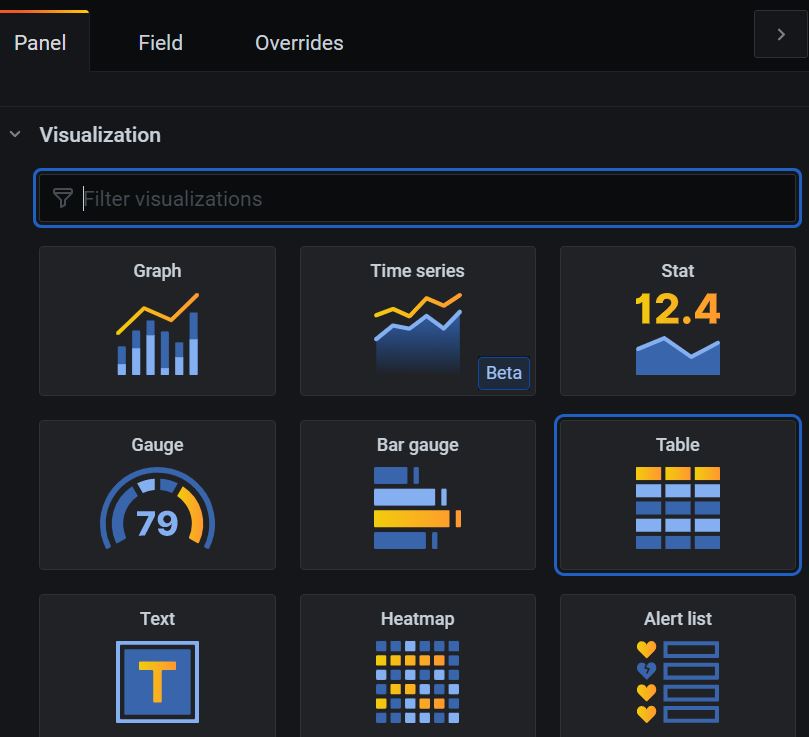
Use the Query Inspector tab to examine the data if needed while building the dashboard.
Figure 4. Data query 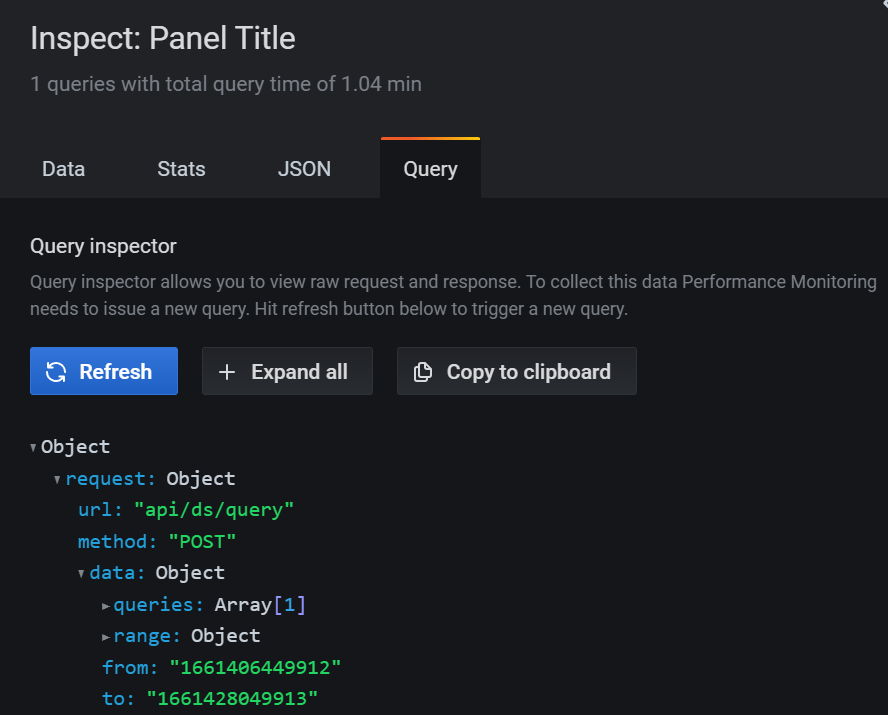
These configuration steps enable you to create the custom dashboard for the selected API.