Sample dashboards
Sample dashboards are provided out of the box which can be imported for specific tenant. The dashboard provides visualization in the form charts and widgets. Dashboards can be used to search records using respective parameters. The user can create more dashboards according to their use cases and preferences.
You can import these dashboards using the Import feature in Grafana. To download sample dashboards, click here.
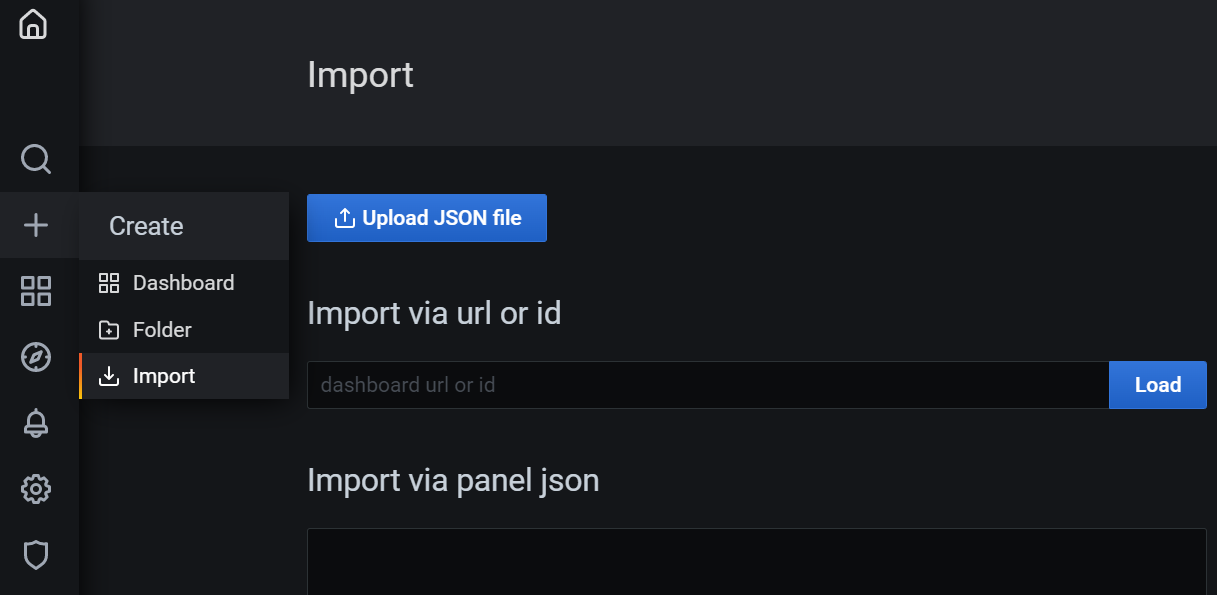
To import out-of-the-box sample dashboards, click the Upload JSON file button in the Import page and select the JSON file of the required dashboard.
Refer the following Sample dashboards table for the out-of-the-box dashboards supported by IMPACT IoT.
| Dashboard JSON File | Description |
|---|---|
| DeviceDashboard.json | This dashboard displays the latest information about a device,
like device details, latest observations, and device state
transitions. This dashboard uses the Intelligent Data Store
**current** APIs to retrieve the data related to the device. For more information, see data access APIs for each event in Data Access APIs - Version-2. |
| DeviceJobHistory.json | This dashboard displays a table of the history of device job
results for a specific device. For more information, see DRJ Historical API in Device Job Result Events. |
| SMSDeliveryReports.json | This dashboard displays the historical SMS Delivery Reports for a
specific device. For more information, see SMS Historical API in SMS DeliveryReceipt Events. |
| MonteEvents.json | This dashboard displays the historical MONTE events of a specific
device. For more information, see Monte Historical API in Event Monitoring Events. |
| AlertEvents.json | This dashboard displays a table of alerts for a specific
device. For more information, see Alert Historical API in Alert Events. |
| AggregationEvents.json | This dashboard displays a table of aggregation events generated
for the specified rule(s). For more information, see Aggregation Historical API in Aggregation Events. |
| UtilitiesDeviceDashboard.json | This dashboard displays the basic device details and graphs for
actual, average and estimated meter reading of a water meter. The
user has to input the below fields in the dashboard:
|
| BillingDashboard.json | This dashboard displays the impact billing records. The Billing dashboard can be used to search records by various parameters like subject, actionIdentity, action, type, result and so on. It displays the total requests, total data uplink downlink, number of the requests by their type and so on. |