Topology
A common visualization used to describe relationships between structures is a graph or topology diagram. A topology consists of a set of nodes, links, and endpoints, with one or more toggle-able overlays and badges to indicate various types of status for the displayed objects.
A node in the topology is an anchor for endpoints, and the relationship between endpoints is described using links.
In EDA, a topology can represent the relationships between any set of resources that have
a structured relationship. The most common form of this is a physical topology, which
EDA uses to illustrate how managed TopoNode resources interact with
each other using TopoLink resources.
The most common topology visualization, and the one currently supported by EDA, is a tree in which:
- Nodes and links are included in the tree
- Each level of the tree is denoted as a "tier"
- A tier may have one or more groups of resources
- Relationships between tiers are drawn based on links present
Nodes
In a physical topology, a node is simply a termination point for endpoints. For example, in a data center a topology can be represented using:
- A leaf switch that is abstracted using a
TopoNode, which becomes a "node" in the topology. - The interface connecting to a spine is abstracted using an
Interface, which becomes an "endpoint" in the topology. - The physical cable plugged into the interface is abstracted using a
TopoLink, which becomes the "link" in the topology.
Within the EDA GUI's topology display, nodes can display badges and adopt a particular shading based on a selected overlay.
Links
Any links with endpoints on nodes selected is drawn as links connecting those nodes in the topology illustration. Other links may extend into an abstract "edge" icon.
Endpoints
An endpoint is one end of a link, and is commonly used in physical topologies.
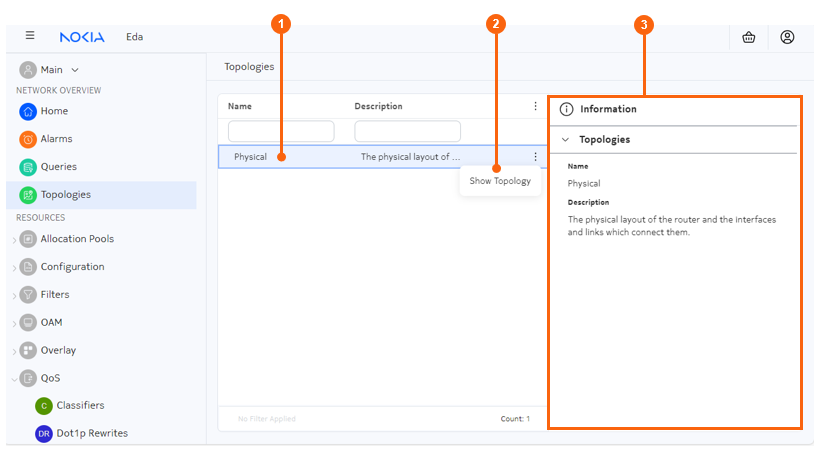
The Topologies page
You can view the topology page by selecting Topologies in EDA's main menu.
| # | Name | Function |
|---|---|---|
| 1 | Topology list | Select an available topology. Currently, the Physical topology is supported. |
| 2 | Table row action list | Select to take an action for the current row. Currently the Show Topology action is supported. |
| 3 | Information panel | Like most page of the EDA GUI, the Topologies list includes an information panel that displays details about the currently selected object. |
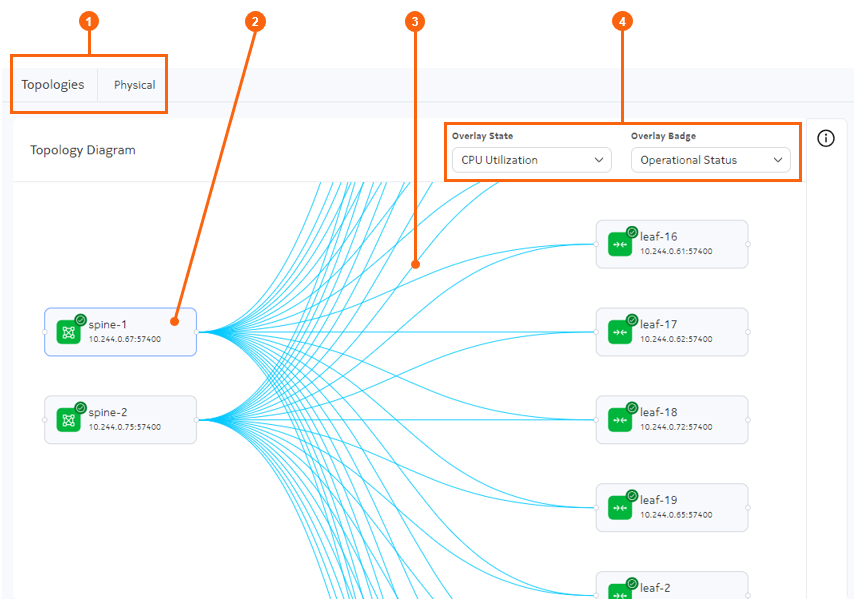
The topology illustration
When you select Show Topology from the actions on the Topologies page, EDA displays a graphical representation of the topology including nodes and links.
| # | Name | Function |
|---|---|---|
| 1 | Topology breadcrumb | Displays the name of the topology currently being displayed. You can click Topologies to return to the Topologies page. |
| 2 | Node | This is an example of a node within the topology. Click on any node to view details about that node in the Information panel. |
| 3 | Links | These are examples of links within the topology. Click on any link to view details about that link, the connected nodes, and the link endpoints in the Information panel. |
| 4 | Overlay and Badge selectors | Use this drop-down list to select an available overlay and / or
set of badges. Each overlay applies shading to the topology illustration to indicate the related status of all nodes and links. Badges display on the nodes with in the topology, and the badge icon and color indicate the related status of each node. |
Overlays
Overlays are specific to a topology, although the same functional overlay may exist for different topologies. For example, EDA's status overlay shows the operational state of the resources within the topology, and shades them a corresponding color in the topology illustration.
In EDA, you can toggle overlays on and off. When available, multiple overlays can be enabled concurrently.
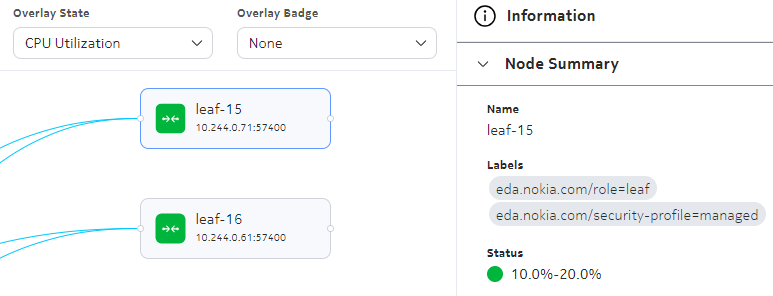
More details about the significance of overlay shading is available in the Information panel for each node.
- The Status overlay indicates the operational status of each TopoNode and TopoLink in the topology. This status derived from the status of NPP connectivity to the node, and the operational state of underlying interfaces making up the TopoLink. As with other overlays, updates are constantly updated to reflect moment-by-moment status.
- The CPU utilization overlay shades nodes based on the percentage of CPU utilization.
- The Deviations overlay indicates whether the current, detected configuration of a node or link differs in some way from the configuration expected by EDA. This can happen when methods external to EDA are used to configure resources.
More details about the significance of the overlay shading for a selected object is available in the Information panel for a badged node.
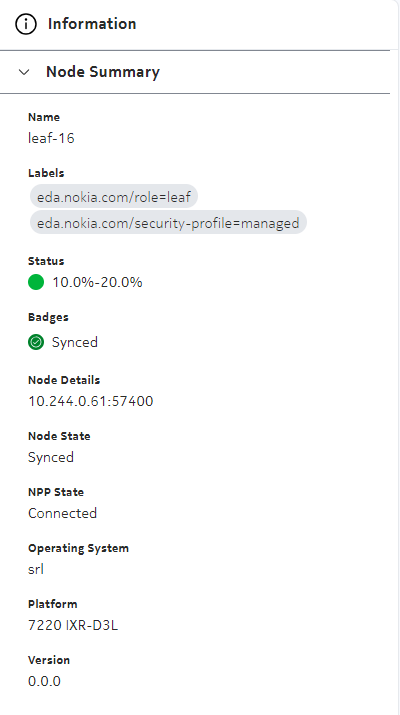
Badges
EDA applications may provide badges for display on the nodes with the topology display. Each badge consists of an icon or a single-digit character (to identify the information type) and a set of colors (to indicate status related to that information type). Where multiple badges are available and enabled, they display in a series at the upper right of the node image.
More details about the significance of a badge is available in the Information panel for a badged node.
For some badges, you can also hover your mouse over the badge to see more information about its meaning.
Information panel
As with many pages in the EDA GUI, an information panel is available on the right side of the topology illustration. Expand this panel to view detailed information about a selected object within the illustration.
This can be a useful way to see the specific meaning of overlays shading or badges within the topology illustration.
Viewing a topology
The page in the EDA UI in which to view network topologies is located at . This page displays a list of available topologies.
- Select a topology from the list.
-
Click the Table row actions icon at the right edge of
the list and select Show Topology from the actions
list.
The Topology Diagram displays, showing a graphical representation of the nodes and links within network topology.
- Optionally, select an overlay by clicking the Overlay State drop-down and selecting an overlay from the list.
- Optionally, select a badge type by clicking the Overlay Badge drop-down and selecting a badge type from the list.
-
To view details about an individual node, select the node and then expand the
Information panel.
Note: When the Information panel is open, you can click other objects to see their information in the panel.
-
To view information about a link within the topology, click the link. If it is
not already expanded, expand the Information panel.
The panel shows information about:
- the nodes at either end of the link, and their status
- the inter-switch links that connect the nodes, and their status
- the endpoints of each link and their status.
Note: For any displayed item in the link Information panel, click the More icon to open the configuration window for that link. From there you can see complete details about the link configuration.