Home page
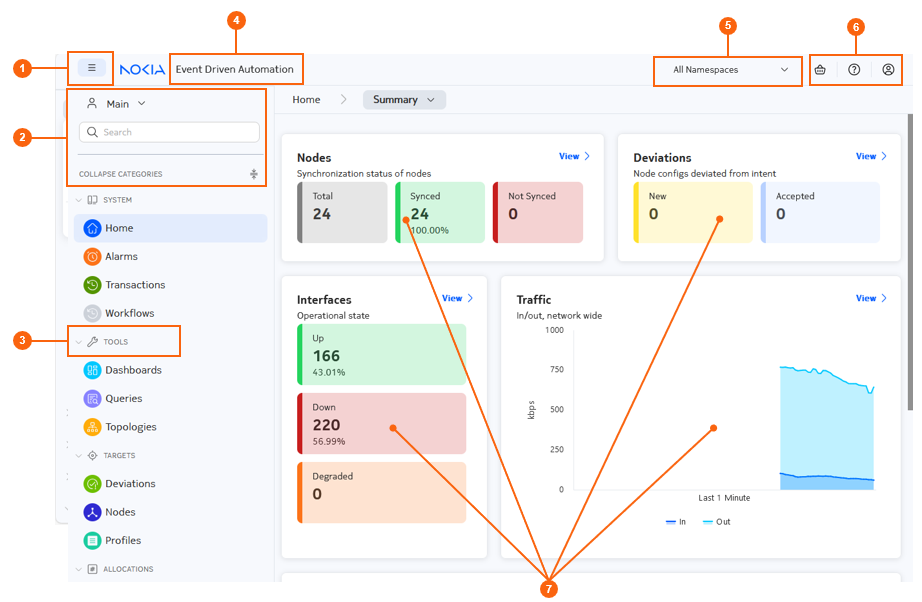
The EDA Home page is the first landing page for the EDA GUI. While some elements of the Home page are unique, it also includes a set of standard controls that are available from all pages within the EDA GUI.
- The Summary page (default), that displays status summaries for nodes, interfaces, and traffic as well as active alarms
- the Platform Status view, that displays summary information for the status of key EDA component
The Summary page
| # | Name | Function |
|---|---|---|
| 1 | Menu pin/un-pin | Use this button to expand and pin, or collapse and hide, the main menu in the left column of the EDA GUI. |
| 2 | Menu controls | Use these tools to:
|
| 4 | Event Driven Automation Home button | Click here on any page of the EDA GUI to navigate to, or re-load, the EDA Home page. |
| 5 | Namespace selector | Use this drop-down selector to choose a working namespace: either
all namespaces, or one specific namespace. This selection affects
the namespace from which to display data, and either create or
manage resources. Note: The namespaces listed
in the selector are limited to those namespaces that you have
permission to access. |
| 6 | Common buttons |
|
| 6 | Menu heading expand/collapse toggle | Click this control to alternately expand all headings or collapse all headings in the main navigation menu. |
| 7 | Dashlets | Each dashlet displays important information about the status of
the EDA application and the network it is managing. Clicking the View link in any dashlet opens the EDA GUI page specific to that dashlet's information. Note: All
dashlets are "live"; they continuously update to show the latest
data. |
The following default panels display on the Summary page:
- Nodes: displays the synchronization state of the nodes
known to EDA (total nodes; synced nodes; unsynced nodes).
Clicking the View link from this panel takes you to the Nodes list.
- Deviations: displays the number of nodes that are
configured in a way that differs from the last intent known to EDA. Separate
counts are displays for those deviations that have been accepted (incorporated
into the stored intent) and those that have been detected, but have not been
accepted.
Clicking the View link from this panel takes you to the Deviations list.
- Interfaces: displays the operational state of the
interfaces known to EDA (Up interfaces, Down interfaces, Degraded
interfaces).
Clicking the View link from this panel takes you to the Interfaces list.
- Traffic: displays total inbound and outbound traffic for
the network as a whole.
Clicking the View link from this panel takes you to the EDA Query Builder, displaying the sum of in and out traffic rates for all nodes: v
.namespace.node.srl.interface.traffic-rate fields [sum(in-bps),
                            sum(out-bps)]
. - Alarms: displays the number of current app alarms and
platform alarms, and their percentage distribution by alarm type.
Clicking the View link from this panel takes you to the Alarms list.