Event and accounting logs
Logging overview
The two primary types of logging supported in the OS are event logging and accounting logs.
Event logging controls the generation, dissemination and recording of system events for monitoring status and troubleshooting faults within the system. The OS groups events into four major categories or event sources.
- security events
- events that pertain to attempts to breach system security
- change events
- events that pertain to the configuration and operation of the node
- main events
- events that pertain to applications that are not assigned to other event categories/sources
- debug events
- events that pertain to trace or other debugging information
Events within the OS and have the following characteristics:
a time stamp in UTC or local time
the generating application
a unique event ID within the application
a router name (also called a vrtr-name) identifying the associated routing context (for example, Base or vprn1000)
a subject identifying the affected object for the event (for example, interface name or port identifier)
a short text description
Event control assigns the severity for each application event and whether the event should be generated or suppressed. The severity numbers and severity names supported in the OS conform to ITU standards M.3100 X.733 & X.21 and are listed in Event severity levels.
| Severity number | Severity name |
|---|---|
1 |
cleared |
2 |
indeterminate (info) |
3 |
critical |
4 |
major |
5 |
minor |
6 |
warning |
Events that are suppressed by event control do not generate any event log entries. Event control maintains a count of the number of events generated (logged) and dropped (suppressed) for each application event. The severity of an application event can be configured in event control.
An event log within the OS associates the event sources with logging destinations. Examples of logging destinations include the console session, a specific Telnet or SSH session, memory logs, file destinations, SNMP trap groups and syslog destinations. A log filter policy can be associated with the event log to control which events are logged in the event log based on combinations of application, severity, event ID range, router name (vrtr-name), and the subject of the event.
The OS accounting logs collect comprehensive accounting statistics to support a variety of billing models. The routers collect accounting data on services and network ports on a per-service class basis. In addition to gathering information critical for service billing, accounting records can be analyzed to provide insight about customer service trends for potential service revenue opportunities. Accounting statistics on network ports can be used to track link utilization and network traffic pattern trends. This information is valuable for traffic engineering and capacity planning within the network core.
Accounting statistics are collected according to the options defined within the context of an accounting policy. Accounting policies are applied to customer Service Access Points (SAPs) and network ports. Accounting statistics are collected by counters for individual service queues defined on the customer’s SAP or by the counters within forwarding class (FC) queues defined on the network ports.
The type of record defined within the accounting policy determines where a policy is applied, what statistics are collected and time interval at which to collect statistics.
The supported destination for an accounting log is a compact flash system device. Accounting data is stored within a standard directory structure on the device in compressed XML format. On platforms that support multiple storage devices, Nokia recommends that accounting logs be configured on the cf1: or cf2: devices only. Accounting log files are not recommended on the cf3: device if other devices are available (Nokia recommends that cf3: be used primarily for software images and configuration related files).
Log file encryption
The log files saved in local storage can be encrypted using the AES-256-CTR cipher algorithm. The encryption key is used for all local log files in the system.
Use the following command to configure the log file encryption key and enable log file encryption.
configure log encryption-key- You can decrypt encrypted log files offline using the appropriate OpenSSL command.
openssl enc aes-256-ctr -pbkdf2 -d -in <log file encrypted> -out <output log file> -p -pass pass:<passphrase> - When you open an encrypted log file in a text editor, you cannot edit or view its contents because the entire file is encrypted.
Log destinations
Both event logs and accounting logs use a common mechanism for referencing a log destination. Log destinations are described in subsequent sections.
Only a single log destination can be associated with an event log or with an accounting log. An event log can be associated with multiple event sources, but it can only have a single log destination.
A file destination is the only type of log destination that can be configured for an accounting log.
Console
Sending events to a console destination means the message is sent to the system console The console device can be used as an event log destination.
Session
A session destination is a temporary log destination which directs entries to the active Telnet or SSH session for the duration of the session. When the session is terminated, for example, when the user logs out, the ‟to session” configuration is removed. Event logs configured with a session destination are stored in the configuration file but the ‟to session” part is not stored. Event logs can direct log entries to the session destination.
CLI logs
A CLI log is a log that outputs log events to a CLI session. The events are sent to the CLI session for the duration of that CLI session (or until an unsubscribe-from command is issued).
Use the following command to subscribe to a CLI log from within a CLI session.
tools perform log subscribe-to log-idMemory logs
A memory log is a circular buffer. When the log is full, the oldest entry in the log is replaced with the new entry. When a memory log is created, the specific number of entries it can hold can be specified, otherwise it assumes a default size. An event log can send entries to a memory log destination.
Log files
Log files can be used by both event logs and accounting logs and are stored on the compact flash devices in the file system.
A log file policy is identified using a numerical ID in classic interfaces and a string name in MD interfaces, but a log file policy is generally associated with a number of individual files in the file system. A log file policy is configured with rollover, expressed in minutes, which represents the period of time an individual log file is written to before a new file is created for the relevant log file policy. The rollover time is checked only when an update to the log is performed. Therefore, complying to this rule is subject to the incoming rate of the data being logged. For example, if the rate is very low, the actual rollover time may be longer than the configured value.
The retention time for a log file policy specifies the amount of time an individual log file is retained on the system based on the creation date and time of the file. The system continuously checks for log files with expired retention periods once every hour and deletes as many files as possible during a 10-second interval.
When a log file policy is created, only the compact flash device for the log files is specified. Log files are created in specific subdirectories with standardized names depending on the type of information stored in the log file.
Event log files are always created in the \log directory on the specified compact flash device. The naming convention for event log files is:
log eeff-timestamp
-
ee is the event log ID
-
ff is the log file destination ID
-
timestamp is the timestamp when the file is created in the form of:
yyyymmdd-hhmmss
where:-
yyyy is the four-digit year (for example, 2007)
-
mm is the two digit number representing the month (for example, 12 for December)
-
dd is the two digit number representing the day of the month (for example, 03 for the 3rd of the month)
-
hh is the two digit hour in a 24-hour clock (for example, 04 for 4 a.m.)
-
mm is the two digit minute (for example, 30 for 30 minutes past the hour)
-
ss is the two digit second (for example, 14 for 14)
-
Accounting log files are created in the \act-collect directory on a compact flash device (specifically cf1 or cf2). The naming convention for accounting log files is nearly the same as for log files except the prefix act is used instead of the prefix log. The naming convention for accounting logs is:
act aaff-timestamp.xml.gz
-
aa is the accounting policy ID
-
ff is the log file destination ID
-
timestamp is the timestamp when the file is created in the form of yyyymmdd-hhmmss where:
-
yyyy is the four-digit year (for example, 2007)
-
mm is the two digit number representing the month (for example, 12 for December)
-
dd is the two digit number representing the day of the month (for example, 03 for the 3rd of the month)
-
hh is the two digit hour in a 24-hour clock (for example, 04 for 4 a.m.)
-
mm is the two digit minute (for example, 30 for 30 minutes past the hour)
-
ss is the two digit second (for example, 14 for 14 seconds)
Accounting logs are .xml files created in a compressed format and have a .gz extension.
The \act-collect directory is where active accounting logs are written. When an accounting log is rolled over, the active file is closed and archived in the \act directory before a new active accounting log file created in \act-collect.
When creating a new log file on a compact flash disk card, the system checks the amount of free disk space and that amount must be greater than or equal to the lesser of 5.2 MB or 10% of the compact flash disk capacity.
SNMP trap group
An event log can be configured to send events to SNMP trap receivers by specifying an SNMP trap group destination.
An SNMP trap group can have multiple trap targets. Each trap target can have different operational values.
A trap destination has the following properties:
The IP address of the trap receiver.
The UDP port used to send the SNMP trap.
SNMP version (v1, v2c, or v3) used to format the SNMP notification.
SNMP community name for SNMPv1 and SNMPv2c receivers.
Security name and level for SNMPv3 trap receivers.
For SNMP traps that are sent out-of-band through the Management Ethernet port on the SF/CPM, the source IP address of the trap is the IP interface address defined on the Management Ethernet port. For SNMP traps that are sent in-band, the source IP address of the trap is the system IP address of the router.
Each trap target destination of a trap group receives the identical sequence of events as defined by the log ID and the associated sources and log filter applied. For the list of options that can be sent in SNMP notifications, please see the SR OS MIBs (and RFC 3416, section 4.2.6).
Syslog
Syslog implementation overview
An event log can be configured to send events to one syslog destination. Syslog destinations have the following properties:
Syslog server IP address
UDP port or TLS profile used to send the syslog message
Syslog Facility Code (0 to 23) (default 23 - local 7)
Syslog Severity Threshold (0 to 7); sends events exceeding the configured level
Because syslog uses eight severity levels whereas the router uses six internal severity levels, the severity levels are mapped to syslog severities. The following table describes the severity level mappings to syslog severities.
| SR OS event severity | Syslog severity numerical code | Syslog severity name | Syslog severity definition |
|---|---|---|---|
— |
0 |
emergency |
System is unusable |
critical (3) |
1 |
alert |
Action must be taken immediately |
major (4) |
2 |
critical |
Critical conditions |
minor (5) |
3 |
error |
Error conditions |
warning (6) |
4 |
warning |
Warning conditions |
— |
5 |
notice |
Normal but significant condition |
cleared (1) indeterminate (2) |
6 |
info |
Informational messages |
— |
7 |
debug |
Debug-level messages |
The general format of an SR OS syslog message is as follows (see RFC 3164, The BSD Syslog Protocol):
<PRI> <HEADER><MSG>
where:
<PRI> (the ‟<” and ‟>” are included in the syslog message) is the configured facility*8+severity (as described in the 7450 ESS, 7750 SR, 7950 XRS, and VSR System Management Guide and RFC 3164).
<HEADER> is "MMM DD HH:MM:SS <source IP addr>" (without the quotes). There are always 2 characters for the day (DD). Single digit days are preceded with a space character.
<MSG> is <log-prefix>: <seq> <vrtr-name> <application>-<severity>-<Event Name>-<Event ID> [<subject>]: <message>\n
-
<log-prefix> is an optional 32 characters of text (default = 'TMNX') as configured in the log-prefix command.
-
<seq> is the log event sequence number (always preceded by a colon and a space char)
-
<vrtr-name> is vprn1, vprn2, … | Base | management | vpls-management
-
<subject> may be empty resulting in []:
-
\n is the standard ASCII newline character (0x0A)
Examples (from different nodes)
default log-prefix (TMNX):
<188>Jan  2 18:43:23 10.221.38.108 TMNX: 17 Base SYSTEM-WARNING-tmnxStateChange-
2009 [CHASSIS]:  Status of Card 1 changed administrative state: inService,
operational state: outOfService\n
<186>Jan  2 18:43:23 10.221.38.108 TMNX: 18 Base CHASSIS-MAJOR-tmnxEqCardRemoved-
2003 [Card 1]:  Class IO Module : removed\n
no log-prefix:
<188>Jan 11 18:48:12 10.221.38.108 : 32 Base SYSTEM-WARNING-tmnxStateChange-2009
[CHASSIS]:  Status of Card 1 changed administrative state: inService,
operational state: outOfService\n
<186>Jan 11 18:48:12 10.221.38.108 : 33 Base CHASSIS-MAJOR-tmnxEqCardRemoved-
2003 [Card 1]:  Class IO Module : removed\n
log-prefix "test":
<186>Jan 11 18:51:22 10.221.38.108 test: 47 Base CHASSIS-MAJOR-tmnxEqCardRemoved-
2003 [Card 1]:  Class IO Module : removed\n
<188>Jan 11 18:51:22 10.221.38.108 test: 48 Base SYSTEM-WARNING-tmnxStateChange-
2009 [CHASSIS]:  Status of Card 1 changed administrative state: inService,
operational state: outOfService\n
Syslog over TLS for log events
Syslog messages containing log events can be optionally sent over TLS instead of UDP. TLS support for log event syslog messages is based on RFC 5425, which provides security for syslog through the use of encryption and authentication.
To enable the use of TLS for syslog log events, configure a TLS profile against the syslog profile. The following example shows the configuration of a TLS profile against the syslog profile.
configure log syslog "3" tls-client-profile "secure-44" Syslog over TLS packets are sent with a fixed TCP source port of 6514.
TLS is supported for the following log event syslogs:
-
system syslogs (configure log syslog), which can send syslog messages as follows:
-
in-band (for example, out a port on an IMM)
-
out-of-band (out a CPM Ethernet port in the management router instance)
The configure log route-preference command configuration determines where the TLS connection is established for the base system syslogs.
-
-
service VPRN syslogs (configure service vprn log syslog)
NETCONF
A NETCONF log is a log that outputs log events to a NETCONF session as notifications. A NETCONF client can subscribe to a NETCONF log using the configured netconf-stream stream-name for the log in a subscription request. See NETCONF notifications for more details.
Event logs
Event logs are the means of recording system generated events for later analysis. Events are messages generated by the system by applications or processes within the router.
Event logging block diagram depicts a function block diagram of event logging.
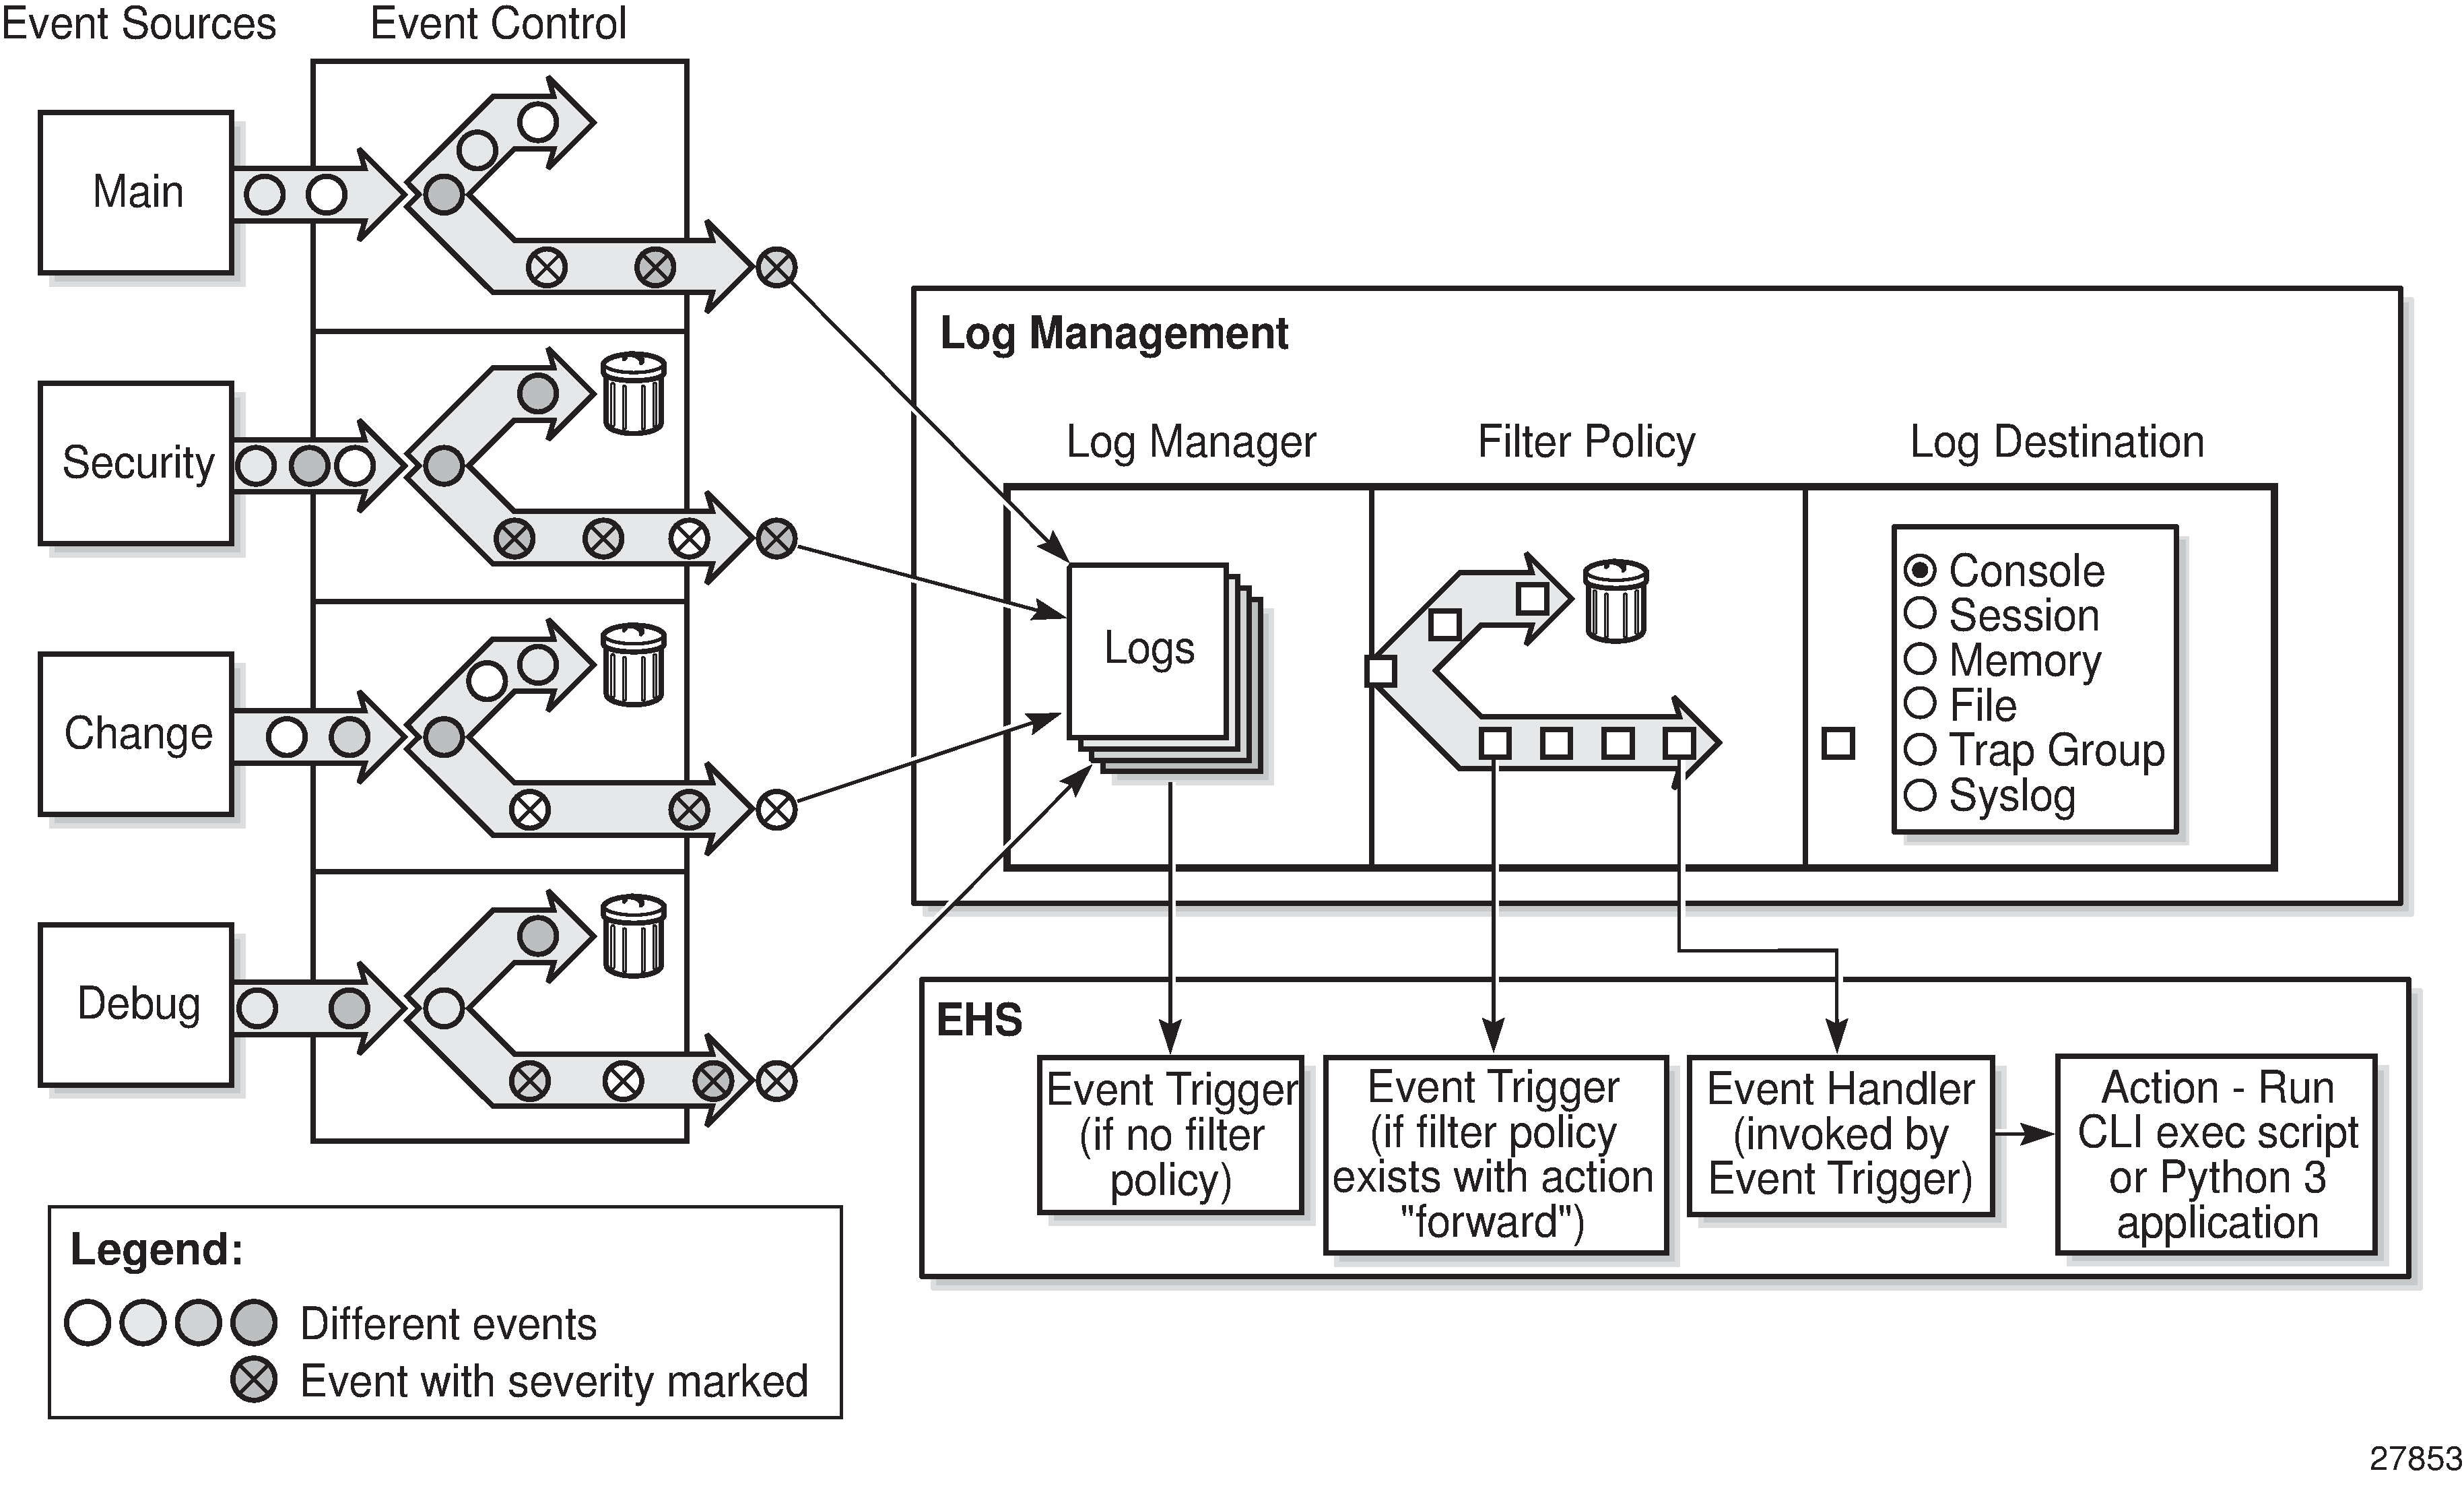
Event sources
In Event logging block diagram, the event sources are the main categories of events that feed the log manager.
security
The security event source is all events that affect attempts to breach system security such as failed login attempts, attempts to access MIB tables to which the user is not granted access or attempts to enter a branch of the CLI to which access has not been granted. Security events are generated by the SECURITY application and the authenticationFailure event in the SNMP application.
change
The change activity event source is all events that directly affect the configuration or operation of the node. Change events are generated by the USER application. The Change event stream also includes the tmnxConfigModify (#2006), tmnxConfigCreate (#2007), tmnxConfigDelete (#2008) and tmnxStateChange (#2009) change events from the SYSTEM application, as well as the various xxxConfigChange events from the MGMT_CORE application.
debug
The debug event source is the debugging configuration that has been enabled on the system. Debug events are generated when debug is enabled for various protocols under the debug branch of the CLI (for example, debug system ntp).
main
The main event source receives events from all other applications within the router.
Use the following command to show information about all applications.
show log applicationsThe following example shows partial output of the show log applications command. Examples of applications within the system include IP, MPLS, OSPF, CLI, services, and so on.
==================================
Log Event Application Names
==================================
Application Name
----------------------------------
...
BGP
CCAG
CFLOWD
CHASSIS
...
MPLS
MSDP
NTP
...
USER
VRRP
VRTR
==================================
Event control
Event control pre-processes the events generated by applications before the event is passed into the main event stream. Event control assigns a severity to application events and can either forward the event to the main event source or suppress the event. Suppressed events are counted in event control, but these events do not generate log entries as it never reaches the log manager.
Simple event throttling is another method of event control and is configured similarly to the generation and suppression options. See Simple logger event throttling.
Events are assigned a default severity level in the system, but the application event severities can be changed by the user.
Application events contain an event number and description that describes why the event is generated. The event number is unique within an application, but the number can be duplicated in other applications.
Use the following command to display log event information.
show log event-controlThe following example, generated by querying event control for application generated events, displays a partial list of event numbers and names.
=======================================================================
Log Events
=======================================================================
Application
 ID#    Event Name                       P   g/s     Logged     Dropped
-----------------------------------------------------------------------

show
BGP:
   2001 bgpEstablished                   MI  gen          1           0
   2002 bgpBackwardTransition            WA  gen          7           0
   2003 tBgpMaxPrefix90                  WA  gen          0           0
...
CCAG:
CFLOWD:
   2001 cflowdCreated                    MI  gen          1           0
   2002 cflowdCreateFailure              MA  gen          0           0
   2003 cflowdDeleted                    MI  gen          0           0
...
CHASSIS:
   2001 cardFailure                      MA  gen          0           0
   2002 cardInserted                     MI  gen          4           0
   2003 cardRemoved                      MI  gen          0           0
...

,,,
DEBUG:
L  2001 traceEvent                       MI  gen          0           0
DOT1X:
FILTER:
   2001 filterPBRPacketsDropped          MI  gen          0           0
IGMP:
   2001 vRtrIgmpIfRxQueryVerMismatch     WA  gen          0           0
   2002 vRtrIgmpIfCModeRxQueryMismatch   WA  gen          0           0
IGMP_SNOOPING:
IP:
L  2001 clearRTMError                    MI  gen          0           0
L  2002 ipEtherBroadcast                 MI  gen          0           0
L  2003 ipDuplicateAddress               MI  gen          0           0
...
ISIS:
   2001 vRtrIsisDatabaseOverload         WA  gen          0           0
Log manager and event logs
Events that are forwarded by event control are sent to the log manager. The log manager manages the event logs in the system and the relationships between the log sources, event logs and log destinations, and log filter policies.
An event log has the following properties:
a unique log ID
The log ID is a short, numeric identifier for the event log. A maximum of 30 logs can be configured at a time.
one or more log sources
The source stream or streams to be sent to log destinations can be specified. The source must be identified before the destination can be specified. The events can be from the main event stream, events in the security event stream, or events in the user activity stream.
one event log destination
A log can only have a single destination (for example, syslog or memory).
an optional event filter policy
An event filter policy defines whether to forward or drop an event or trap-based on match criteria.
Event filter policies
The log manager uses event filter policies to allow fine control over which events are forwarded or dropped based on various criteria. Like other filter policies in the SR OS, filter policies have a default action. The default actions are either:
Forward
Drop
Filter policies also include a number of filter policy entries that are identified with an entry ID and define specific match criteria and a forward or drop action for the match criteria.
Each entry contains a combination of matching criteria that define the application, message, event number, router, severity, and subject conditions. The entry’s action determines how the packets should be treated if they have met the match criteria.
Entries are evaluated in order from the lowest to the highest entry ID. The first matching event is subject to the forward or drop action for that entry.
Valid operators are displayed in Valid filter policy operators:
| Operator | Description |
|---|---|
eq |
equal to |
neq |
not equal to |
lt |
less than |
lte |
less than or equal to |
gt |
greater than |
gte |
greater than or equal to |
A match criteria entry can include combinations of:
Equal to or not equal to a specific system application.
Equal to or not equal to an event message string or regular expression match.
Equal to, not equal to, less than, less than or equal to, greater than or greater than or equal to an event number within the application.
Equal to, not equal to, less than, less than or equal to, greater than or greater than or equal to a severity level.
Equal to or not equal to a router name string or regular expression match.
Equal to or not equal to an event subject string or regular expression match.
Event log entries
Log entries that are forwarded to a destination are formatted in a way appropriate for the specific destination whether it be recorded to a file or sent as an SNMP trap, but log event entries have common elements or properties. All application generated events have the following properties:
A time stamp in UTC or local time.
The generating application.
A unique event ID within the application.
A router name identifying the router instance that generated the event.
A subject identifying the affected object.
A short text description.
The general format for an event in an event log with either a memory, console or file destination is as follows.
nnnn <time> TZONE <severity>: <application> #<event-id> <vrtr-name> <subject>
<message>
The following is an event log example:
252 2013/05/07 16:21:00.761 UTC WARNING: SNMP #2005 Base my-interface-abc
"Interface my-interface-abc is operational"
The specific elements that compose the general format are described in Log entry field descriptions.
| Label | Description |
|---|---|
nnnn |
The log entry sequence number. |
<time> |
YYYY/MM/DD HH:MM:SS.SSS |
YYYY/MM/DD |
The UTC date stamp for the log entry:
|
HH:MM:SS.SSS |
The UTC time stamp for the event:
|
TZONE |
The timezone (for example, UTC, EDT) as configured by the following command. |
<severity> |
The severity levels of the event:
|
<application> |
The application generating the log message. |
<event-id> |
The application’s event ID number for the event. |
<vrtr-name> |
The router name (vrtr-name, for example, vprn101 or Base), in a format used by the logging system, representing the router instance that generated the event. |
<subject> |
The subject/affected object for the event. |
<message> |
A text description of the event. |
Simple logger event throttling
Simple event throttling provides a mechanism to protect event receivers from being overloaded when a scenario causes many events to be generated in a very short period of time. A throttling rate, # events/# seconds, can be configured. Specific event types can be configured to be throttled. When the throttling event limit is exceeded in a throttling interval, any further events of that type cause the dropped events counter to be incremented.
Use the commands in the following context to display dropped event counts.
show log event-controlEvents are dropped before being sent to one of the logger event collector tasks. There is no record of the details of the dropped events and therefore no way to retrieve event history data lost by this throttling method.
A particular event type can be generated by multiple managed objects within the system. At the point this throttling method is applied the logger application has no information about the managed object that generated the event and cannot distinguish between events generated by object ‟A” from events generated by object ‟B”. If the events have the same event-id, they are throttled regardless of the managed object that generated them. It also does not know which events may eventually be logged to destination log-id <n> from events that are logged to destination log-id <m>.
Throttle rate applies commonly to all event types. It is not configurable for a specific event-type.
A timer task checks for events dropped by throttling when the throttle interval expires. If any events have been dropped, a TIMETRA-SYSTEM-MIB::tmnxTrapDropped notification is sent.
Default system log
Log 99 is a pre-configured memory-based log which logs events from the main event source (not security, debug, and so on). Log 99 exists by default.
The following example displays the log 99 configuration.
MD-CLI
[ex:/configure log]
A:admin@node-2# info
    log-id "99" {
        admin-state enable
        description "Default system log"
        source {
            main true
        }
        destination {
            memory {
                max-entries 500
            }
        }
    }
    snmp-trap-group "7" {
    }
classic CLI
A:node-2>config>log# info detail
#------------------------------------------
echo "Log Configuration "
#------------------------------------------
...
        snmp-trap-group 7
        exit
...
        log-id 99
            description "Default system log"
            no filter
            from main
            to memory 500
            no shutdown
        exit
----------------------------------------------
Event handling system
The Event Handling System (EHS) is a framework that allows operator-defined behavior to be configured on the router. EHS adds user-controlled programmatic exception handling by allowing the execution of either a CLI script or a Python 3 application when a log event (the ‟trigger”) is detected. Various fields in the log event provide regexp style expression matching, which allows flexibility for the trigger definition.
EHS handler objects are used to tie together the following:
trigger events (typically log events that match a configurable criteria)
a set of actions to perform (enabled using CLI scripts and Python applications)
EHS, along with CRON, may execute SR OS CLI scripts or Python 3 applications to perform operator-defined functions as a result of receiving a trigger event. The Python programming language provides an extensive framework for automation activities for triggered or scheduled events, including model-driven transactional configuration and state manipulation. See the Python chapter for more information.
The use of Python applications from EHS is supported only in model-driven configuration mode.
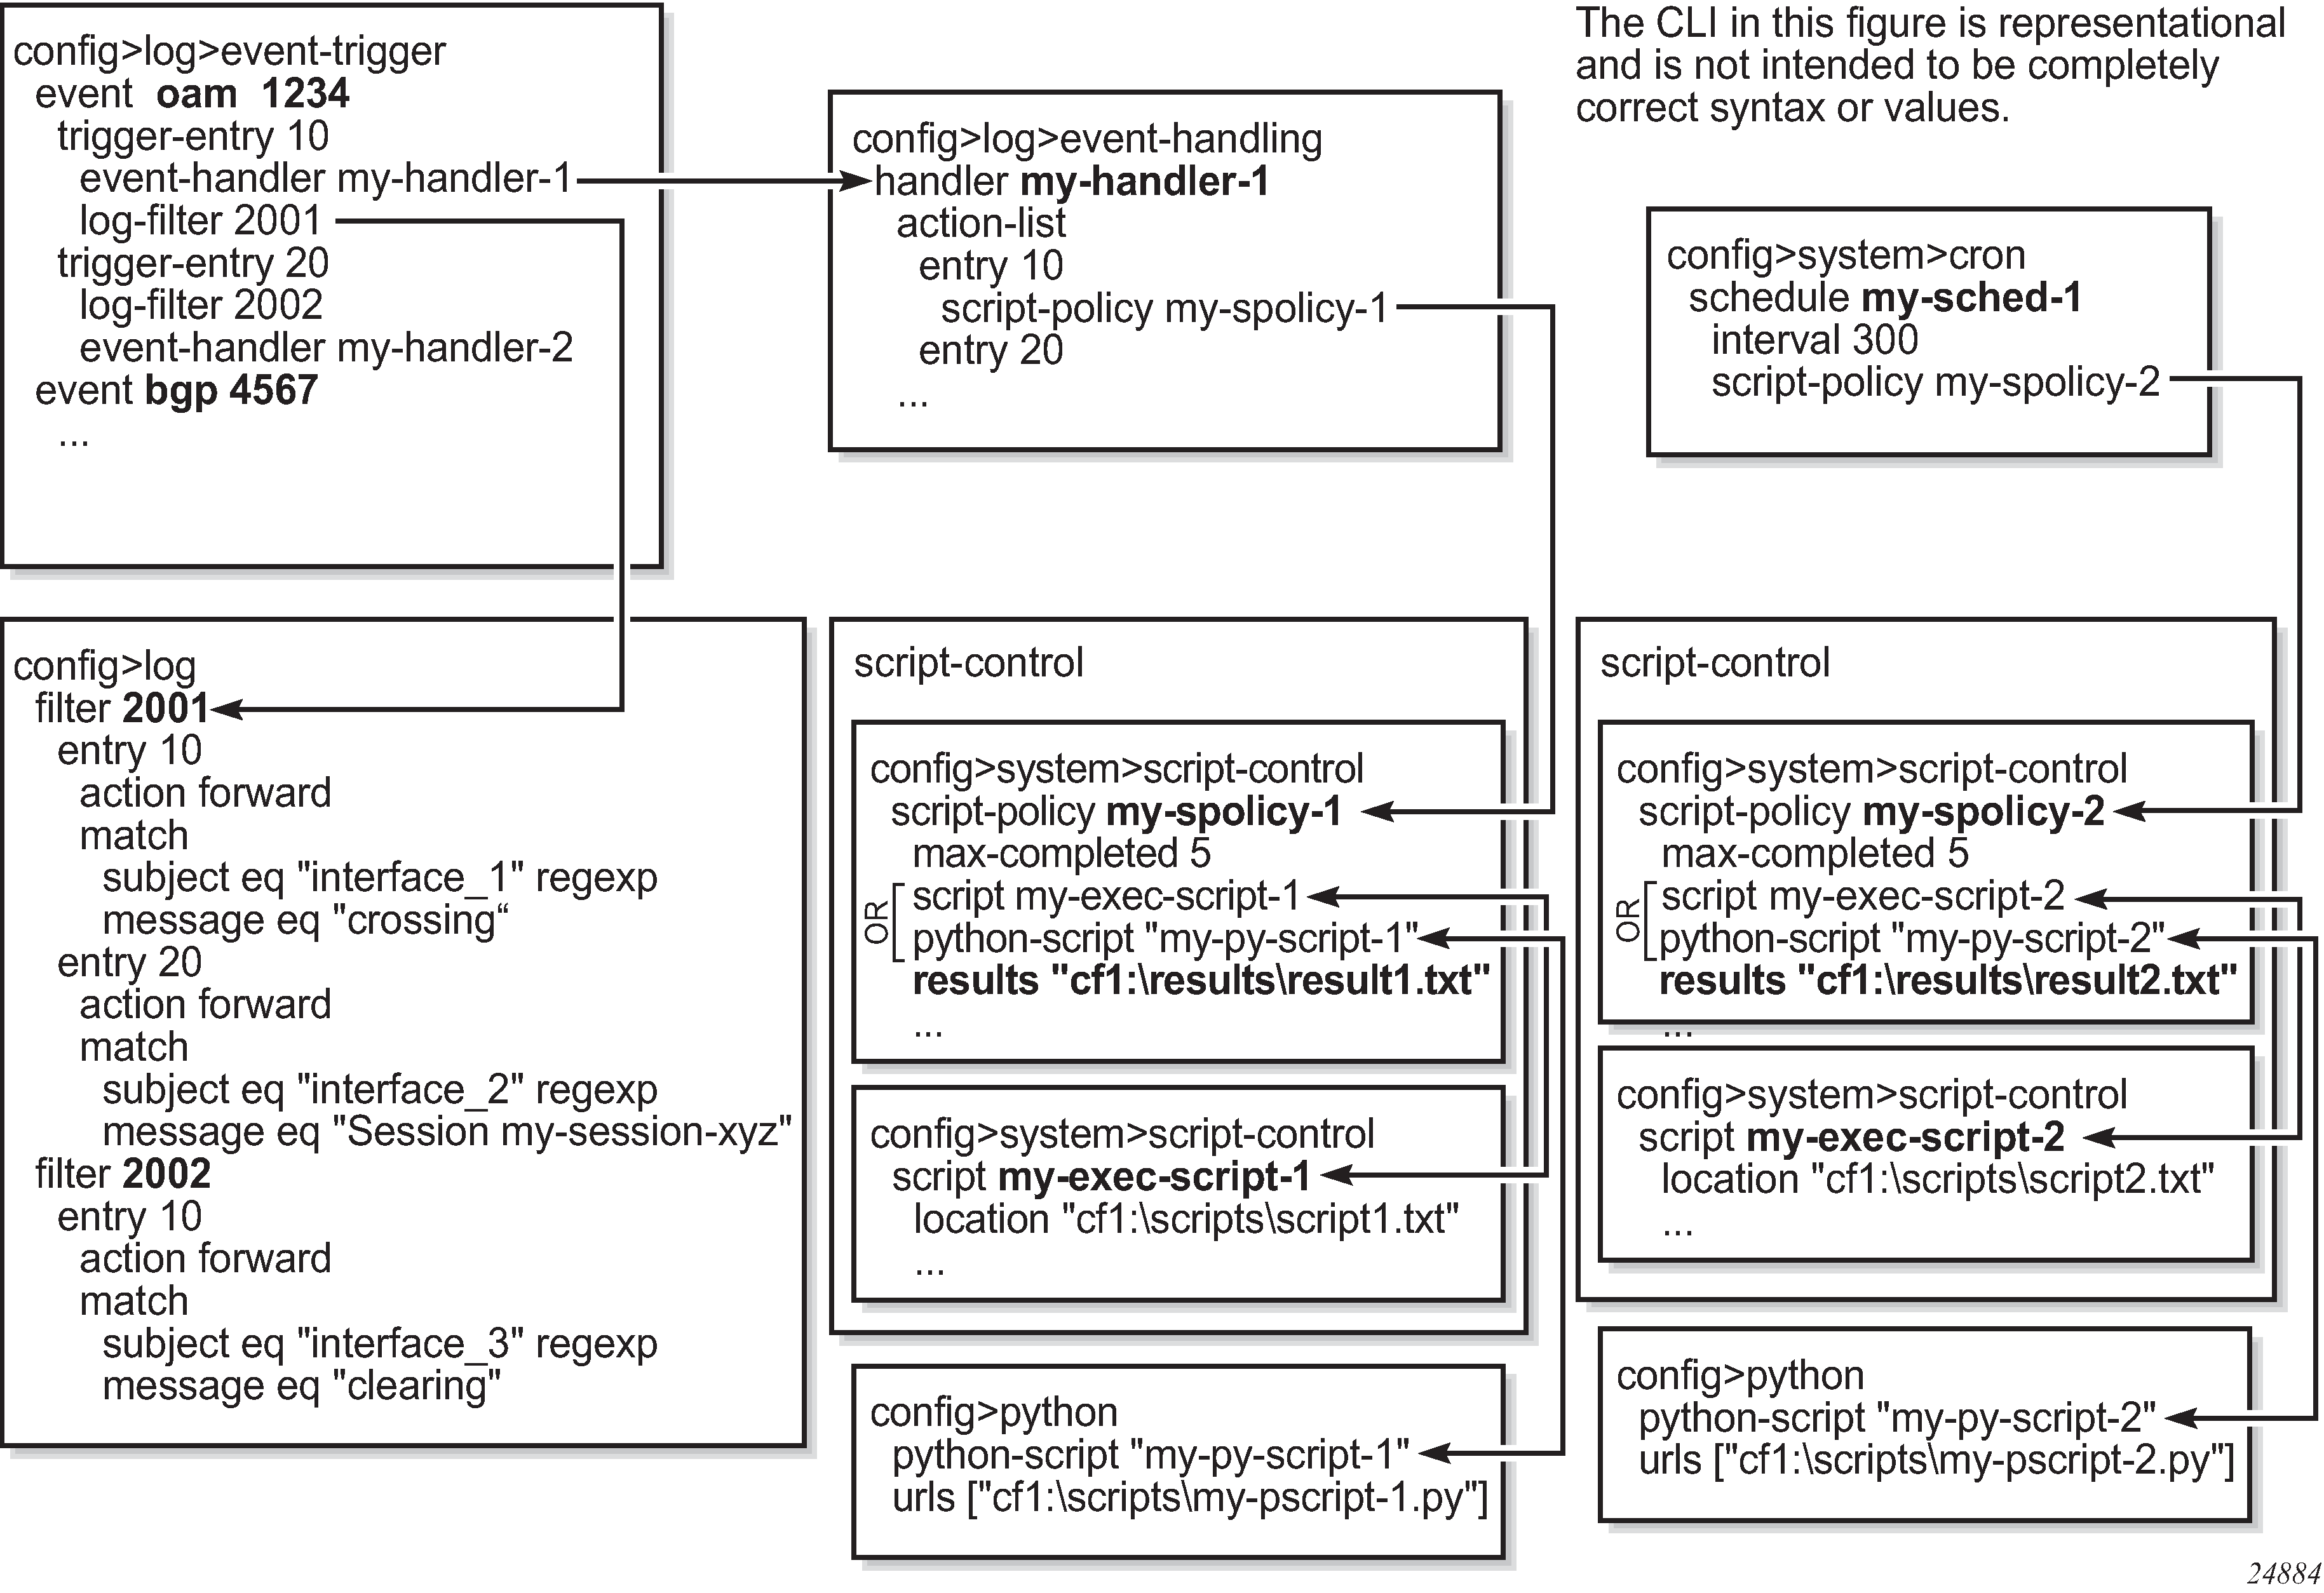
EHS object relationships (classic CLI) shows the relationships among the different configurable objects used by EHS (and CRON).
EHS configuration and variables
You can configure complex rules to match log events as the trigger for EHS. For example, use the commands in the following context to configure discard using suppression and throttling:
- MD-CLI
configure log log-events - classic
CLI
configure log event-control
When a log event is generated in SR OS, it is subject to discard using the configured suppression and throttling before it is evaluated as a trigger for EHS, according to the following:
EHS does not trigger on log events that are suppressed through the configuration.
EHS does not trigger on log events that are throttled by the logger.
EHS is triggered on log events that are dropped by user-configured log filters assigned to individual logs.
Use the following command to assign log filters:
configure log filterThe EHS event trigger logic occurs before the distribution of log event streams into individual logs.
The parameters from the log event are passed into the triggered EHS CLI script or Python application. For CLI scripts, the parameters are passed as individual dynamic variables (for example, $eventid). For Python applications, see the details in the following sections. The parameters are composed of:
- common events
- event specific options
The common event parameters are:
- appid
- eventid
- severity
- gentime (in UTC)
- timestamp (in seconds, available within a Python application only)
The event specific parameters depend on the log event. Use the following command to obtain information for a particular log event.
show log event-parametersAlternatively, in the MD-CLI use the following command for information.
state log log-eventsTriggering a CLI script from EHS
When using the classic CLI, an EHS script has the ability to define local (static) variables and uses basic .if or .set syntax inside the script. The use of variables with .if or .set commands within an EHS script adds more logic to the EHS scripting and allows the reuse of a single EHS script for more than one trigger or action.
Both passed-in and local variables can be used within an EHS script, either as part of the CLI commands or as part of the .if or .set commands.
The following applies to both CLI commands and .if or .set commands (where X represents a variable).
Using $X, without using single or double quotes, replaces the variable X with its string or integer value.
Using ‟X”, with double quotes, means the actual string X.
Using ‟$X”, with double quotes, replaces the variable X with its string or integer value.
Using ‛X’, with single quotes does not replace the variable X with its value but means the actual string $X.
The following interpretation of single and double quotes applies.
All characters within single quotes are interpreted as string characters.
All characters within double quotes are interpreted as string characters except for $, which replaces the variable with its value (for example, shell expansion inside a string).
Examples of EHS syntax supported in classic CLI
This section describes the supported EHS syntax for the classic CLI.
.if $string_variable==string_value_or_string_variable {
CLI_commands_set1
.} else {
CLI_commands_set2
.} endif
.if ($string_variable==string_value_or_string_variable) {
CLI_commands_set1
.} else {
CLI_commands_set2
.} endif
.if $integer_variable==integer_value_or_integer_variable {
CLI_commands_set1
.} else {
CLI_commands_set2
.} endif
.if ($integer_variable==integer_value_or_integer_variable) {
CLI_commands_set1
.} else {
CLI_commands_set2
.} endif
.if $string_variable!=string_value_or_string_variable {
CLI_commands_set1
.} else {
CLI_commands_set2
.} endif
.if ($string_variable!=string_value_or_string_variable) {
CLI_commands_set1
.} else {
CLI_commands_set2
.} endif
.if $integer_variable!=integer_value_or_integer_variable {
CLI_commands_set1
.} else {
CLI_commands_set2
.} endif
.if ($integer_variable!=integer_value_or_integer_variable) {
CLI_commands_set1
.} else {
CLI_commands_set2
.} endif
.set $string_variable = string_value_or_string_variable
.set ($string_variable = string_value_or_string_variable)
.set $integer_variable = integer_value_or_integer_variable
.set ($integer_variable = integer_value_or_integer_variable)
where:
CLI_commands_set1 is a set of one or more CLI commands
CLI_commands_set2 is a set of one or more CLI commands
string_variable is a local (static) string variable
string_value_or_string_variable is a string value/variable
integer_variable is a local (static) integer variable
integer_value_or_integer_variable is an integer value/variable
A limit of 100 local (static) variables per EHS script is imposed. Exceeding this limit may result in an error and partial execution of the script.
When a set statement is used to set a string_variable to a string_value, the string_value can be any non-integer value not surrounded by single or double quotes or it can be surrounded by single or double quotes.
A "." preceding a directive (for example, if, set, and so on) is always expected to start a new line.
An end of line is always expected after {.
A CLI command is always expected to start a new line.
Passed-in (dynamic) variables are always read-only inside an EHS script and cannot be overwritten using a set statement.
.if commands support == and != operators only.
.if and .set commands support addition, subtraction, multiplication, and division of integers.
.if and .set commands support addition, which means concatenation, of strings.
Valid examples of EHS syntax in classic CLI
This section provides a list of valid examples to trigger log events using EHS syntax in classic CLI.
configure service epipe $serviceID
where $serviceID is either a local (static) integer variable or passed-in (dynamic) integer variable
echo srcAddr is $srcAddr
where $srcAddr is a passed-in (dynamic) string variable
.set $ipAddr = "10.0.0.1"
where $ipAddr is a local (static) string variable
.set $ipAddr = $srcAddr
where $srcAddr is a passed-in (dynamic) string variable
$ipAddr is a local (static) string variable.
.set ($customerID = 50)
where $customerID is a local (static) integer variable
.set ($totalPackets = $numIngrPackets + $numEgrPackets)
where $totalPackets, $numIngrPackets, $numEgrPackets are local (static) integer variables
.set ($portDescription = $portName + $portLocation)
where $portDescription, $portName, $portLocation are local (static) string variables
if ($srcAddr == "CONSOLE") {
CLI_commands_set1
.else {
CLI_commands_set2
.} endif
where $srcAddr is a passed-in (dynamic) string variable
CLI_commands_set1 is a set of one or more CLI commands
CLI_commands_set2 is a set of one or more CLI commands
.if ($customerId == 10) {
CLI_commands_set1
.else {
CLI_commands_set2
.} endif
where $customerID is a passed-in (dynamic) integer variable CLI_commands_set1 is a set of one or more CLI commands
CLI_commands_set2 is a set of one or more CLI commands
.if ($numIngrPackets == $numEgrPackets) {
CLI_commands_set1
.else {
CLI_commands_set2
.} endif
where $numIngrPackets and $numEgrPackets are local (static) integer variables
CLI_commands_set1 is a set of one or more CLI commands
CLI_commands_set2 is a set of one or more CLI commands
Invalid examples for EHS syntax in classic CLI
This section provides a list of invalid variable use in EHS syntax in classic CLI.
.set $srcAddr = "10.0.0.1"
where $srcAddr is a passed-in (dynamic) string variable
Reason: passed-in variables are read only inside an EHS script.
.set ($ipAddr = $numIngrPackets + $numEgrPackets)
where $ipAddr is a local (static) string variable
$numIngrPackets and $numEgrPackets are local (static) integer variables
Reason: variable types do not match, cannot assign a string to an integer.
.set ($numIngrPackets = $ipAddr + $numEgrPackets)
where $ipAddr is a local (static) string variable
$numIngrPackets and $numEgrPackets are local (static) integer variables
Reason: variable types do not match, cannot concatenate a string to an integer.
.set $ipAddr = "10.0.0.1"100
where $ipAddr is a local (static) string variable
Reason: when double quotes are used, they have to surround the entire string.
.if ($totalPackets == "10.1.1.1") {
.} endif
where $totalPackets is a local (static) integer variables
Reason: cannot compare an integer variable to a string value.
.if ($ipAddr == 10) {
.} endif
where $ipAddr is a local (static) string variable
Reason: cannot compare a string variable to an integer value.
.if ($totalPackets == $ipAddr) {
where $totalPackets is a local (static) integer variables
$ipAddr is a local (static) string variable
Reason: cannot compare an integer variable to a string variable.
Triggering a Python application from EHS
When using model-driven configuration mode and the MD-CLI, EHS can trigger a Python application that is executed inside a Python interpreter running on SR OS. See the Python chapter for more information.
Python applications are not supported in classic configuration mode or mixed configuration mode.
When developing an EHS Python application, the event attributes are passed to the application using the get_event function in the pysros.ehs module.
To import this module, the Python application developer must add the following statement to the application:
from pysros.ehs import get_event
Use the get_event function call to obtain the event triggered the Python application to run. The following example catches the event and returns a Python object into the event variable:
event = get_event()
When using an EHS Python application, the operator can use the Python programming language to create applications, as required. See the Python chapter for information about displaying model-driven state or configuration information, performing transactional configuration of SR OS, or executing CLI commands in Python.
Common event parameters (group one) are available in Python from the object created using the get_event function, as shown in the following table (the functions assume that the EHS event object is called event).
| Function call | Description | Example output | Python return type |
|---|---|---|---|
event.appid |
The name of the application that generated the event |
SYSTEM |
String |
event.eventid |
The event ID number of the application |
2068 |
Integer |
event.severity |
The severity level of the event |
minor |
String |
event.subject |
The subject or affected object of the event |
EHS script |
String |
event.gentime |
The formatted time the event was generated in UTC |
The timestamp in ISO 8601 format (consistent with state date/time leaves) that the event was generated. For example, 2021-03-08T11:52:06.0-05:00 |
String |
event.timestamp |
The timestamp that the event was generated (in seconds) |
1632165026.921208 |
Float |
The variables (group two) are available in Python in the event parameters attribute of the event object, as shown in the following table. They are presented as a Python dictionary (unordered).
| Function call | Description | Example output | Python return type |
|---|---|---|---|
event.eventparameters |
The event specific variable parameters |
<EventParams> When calling keys() on this object the example output is: ('tmnxEhsHandlerName', 'tmnxEhsHEntryId', 'tmnxEhsHEntryScriptPlcyOwner', 'tmnxEhsHEntryScriptPlcyName', 'smLaunchOwner', 'smLaunchName', 'smLaunchScriptOwner', 'smLaunchScriptName', 'smLaunchError', 'tmnxSmLaunchExtAuthType', 'smRunIndex', 'tmnxSmRunExtAuthType', 'tmnxSmRunExtUserName') |
Dict |
In addition to the variables, the format_msg() function is provided to output the formatted log string from the event as it would appear in the output of the show log command. The following is an example usage.
print(event.format_msg())The following shows an example output of the format_msg() function.
Launch of none operation failed with a error: Python script's operational status is not 'inService'.
The script policy "test_ehs" created by the owner "TiMOS CLI" was executed with cli-user account "not-specified"
EHS debounce
EHS debounce (also called dampening) is the ability to trigger an action (for example an EHS script), if an event happens (N) times within a specific time window (S).
N = [2..15]
S = [1..604800]
Triggering occurs with the Nth event not at the end of S.
There is no sliding window (for example a trigger at Nth event, N+1 event, and so on), as N is reset after a trigger and count is restarted.
When EHS debouncing or dampening is used, the varbinds passed in to an EHS script at script triggering time are from the Nth event occurrence (the Nth triggering event).
If S is not specified, the SR OS continues to trigger every Nth event.
For example:
When linkDown occurs N times in S seconds, an EHS script is triggered to shut down the port.
Executing EHS or CRON CLI scripts or Python applications
The execution of EHS or CRON scripts depends on the CLI engine associated with the configuration mode. The EHS or CRON script execution engine is based on the configured primary CLI engine. For example, if cli-engine is configured to md-cli, the script executes in the MD-CLI infrastructure and disregards the configuration mode, even if it is classic.
Use the following command to configure the primary CLI engine.
configure system management-interface cli cli-engineThe following is the default behavior of the EHS or CRON scripts, depending on the configuration mode.
-
Model-Driven configuration mode
EHS or CRON scripts execute in the MD-CLI environment and an error occurs if any classic CLI commands exist. Python applications are fully supported and use the SR OS model-driven interfaces and the pySROS libraries to obtain and manipulate state and configuration data, as well as pySROS API calls to execute MD-CLI commands.
classic CLI configuration mode
EHS or CRON scripts execute in the classic CLI environment and an error occurs if any model-driven CLI commands exist. Python applications are not supported and the system returns an error.
mixed configuration mode
EHS or CRON scripts execute in the classic CLI environment and an error occurs if any Model-Driven CLI commands exist. Python applications are not supported and the system returns an error.
EHS or CRON scripts that contain MD-CLI commands can be used in the MD-CLI as follows:
scripts can be configured
scripts can be created, edited, and results read through FTP
scripts can be triggered and executed
scripts generate an error if there are any non MD-CLI commands or .if or .set syntax in the script
configure system security cli-script authorization event-handler cli-userWhen a user is not specified, an EHS or CRON script bypasses authorization and can execute all commands.
In all configuration modes, use the following command to disable a script policy, even if history exists:
- MD-CLI
configure system script-control script-policy admin-state disable - classic
CLI
configure system script-control script-policy shutdown
When the script policy is disabled, the following applies.
Newly triggered EHS or CRON scripts or Python applications are not allowed to execute or queue.
In-progress EHS or CRON scripts or Python applications are allowed to continue.
Already queued EHS or CRON scripts or Python applications are allowed to execute.
By default, a script policy is configured to allow an EHS or CRON script to override datastore locks from any model-driven interface (MD-CLI, NETCONF, and so on) in mixed and model-driven modes. Use the following command to configure a script policy to prevent EHS or CRON scripts from overriding datastore locks:
- MD-CLI
configure system script-control script-policy lock-override false - classic
CLI
configure system script-control script-policy no lock-override
Managing logging in VPRNs
Log events can initiate from within a VPRN, instead of from the base router instance or the CPM management router instance. For example, a syslog collector may be reachable through a VPRN interface. Use the following command to configure event logs for a VPRN service.
configure service vprn logBy default, the event-source streams for VPRN event logs contain only events that are associated with that specific VPRN. It is also possible to configure a system-wide set of log events. This can be useful, for example, when a VPRN is being used as a management VPRN. Use the following command to send a VPRN event log for the entire system-wide set of log events (VPRN and non-VPRN).
configure log services-all-eventsCustomizing syslog messages using Python
Log events in SR OS can be customized, including by a Python script, before they are sent to a syslog server. If the result of a log filter is to drop the event, no further processing occurs and the message is not sent. The following figure shows the interaction between the logger and the Python engine.
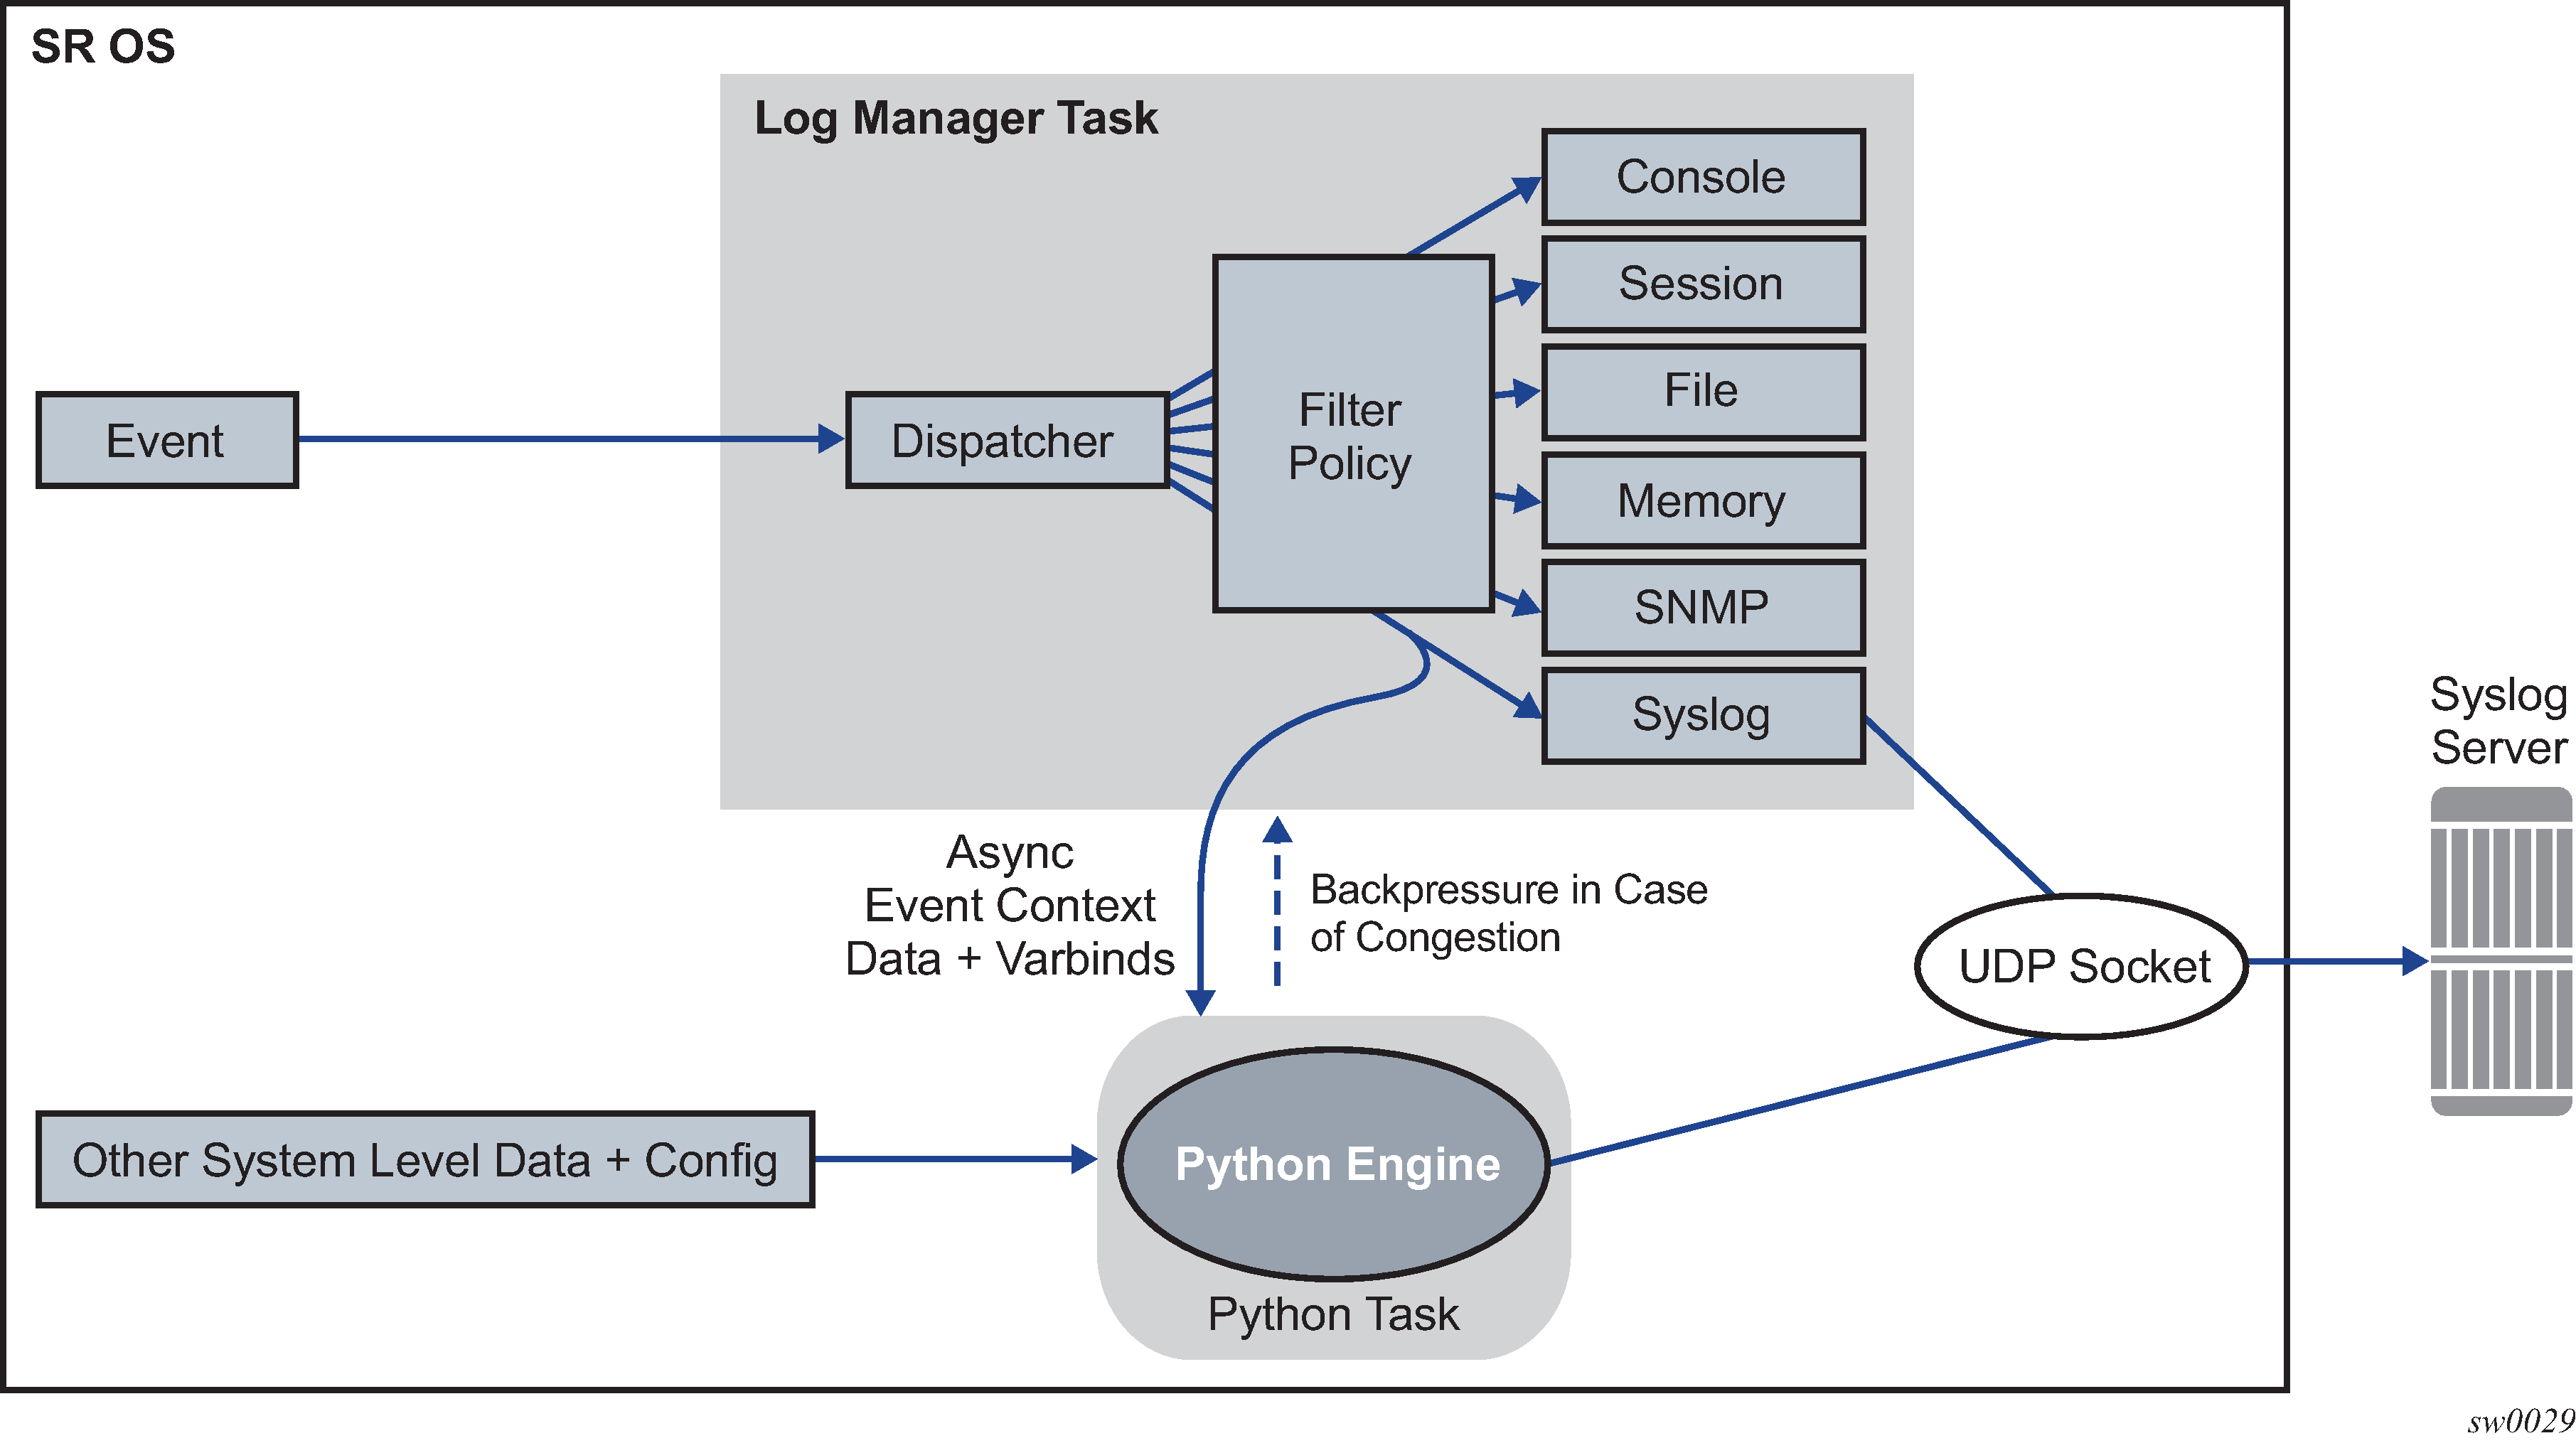
Python engine for syslog
This section describes the syslog-specific aspects of Python processing. For an introduction to Python, see the 7450 ESS, 7750 SR, and VSR Triple Play Service Delivery Architecture Guide, "Python script support for ESM".
When an event is dispatched to the log manager in SR OS, the log manager asynchronously passes the event context data and variables (varbinds in Python 2 and event parameters in Python 3) to the Python engine; that is, the logger task is not waiting for feedback from Python.
Varbinds or event parameters are variable bindings that represent the variable number of values that are included in the event. Each varbind in Python 2 consists of a triplet (OID, type, value).
Along with other system-level variables, the Python engine constructs a syslog message and sends it to the syslog destination when the Python engine successfully concludes. During this process, the operator can modify the format of the syslog message or leave it intact, as if it was generated by the syslog process within the log manager.
The tasks of the Python engine in a syslog context are as follows:
assemble custom syslog messages (including PRI, HEADER and MSG fields) based on the received event context data, varbinds and event parameters specific to the event, system-level data, and the configuration parameters (syslog server IP address, syslog facility, log-prefix, and the destination UDP port)
reformat timestamps in a syslog message
- modify attributes in the message and reformats the message
send the original or modified message to the syslog server
drop the message
Python 2 syslog APIs
Python APIs are used to assemble a syslog message which, in SR OS, has the format described in section Syslog.
The following table describes Python information that can be used to manipulate syslog messages.
| Imported Nokia (ALC) modules | Access rights | Comments |
|---|---|---|
event (from alc import event) |
— |
Method used to retrieve generic event information |
syslog (from alc import syslog) |
— |
Method used to retrieve syslog-specific parameters |
system (from alc import system) |
— |
Method used to retrieve system-specific information. Currently, the only parameter retrieved is the system name. |
Events use the following format as they are written into memory, file, console, and system: nnnn <time> <severity>:<application> # <event_id> <router-name> <subject> <message> The event-related information received in the context data from the log manager is retrieved via the following Python methods: |
||
event.sequence |
RO |
Sequence number of the event (nnnn) |
event.timestamp |
RO |
Event timestamp in the format: (YYYY/MM/DD HH:MM:SS.SS) |
event.routerName |
RO |
Router name, for example, BASE, VPRN1, and so on |
event.application |
RO |
Application generating the event, for example, NA |
event.severity |
RO |
Event severity configurable in SR OS (CLEARED [1], INFO [2], CRITICAL [3], MAJOR [4], MINOR [5], WARNING [6]). |
event.eventId |
RO |
Event ID; for example, 2012 |
event.eventName |
RO |
Event Name; for example, tmnxNatPlBloclAllocationLsn |
event.subject |
RO |
Optional field; for example, [NAT] |
event.message |
RO |
Event-specific message; for example, "{2} Map 192.168.20.29 [2001-2005] MDA 1/2 -- 276824064 classic-lsn-sub %3 vprn1 10.10.10.101 at 2015/08/31 09:20:15" |
Syslog methods |
||
syslog.hostName |
RO |
IP address of the SR OS node sending the syslog message. This is used in the Syslog HEADER. |
syslog.logPrefix |
RO |
Log prefix which is configurable and optional; for example, TMNX: |
syslog.severityToPRI(event.severity) |
— |
Python method used to derive the PRI field in syslog header based on event severity and a configurable syslog facility |
syslog.severityToName(event.severity) |
— |
SR OS event severity to syslog severity name. For more information, see the Syslog section. |
syslog.timestampToUnix(timestamp) |
— |
Python method that takes a timestamp in the YYYY/MM/DD HH:MM:SS format and converts it into a UNIX-based format (seconds from Jan 01 1970 – UTC) |
syslog.set(newSyslogPdu) |
— |
Python method used to send the syslog message in the newSyslogPdu. This variable must be constructed manually via string manipulation. In the absence of the command, the SR OS assembles the default syslog message (as if Python was not configured) and sends it to the syslog server, assuming that the message is not explicitly dropped. |
syslog.drop() |
— |
Python method used to drop a syslog message. This method must be called before the syslog.set<newSyslogPdu method. |
System methods |
||
system.name |
RO |
Python method used to retrieve the system name |
For example, assume that the syslog format is:
<PRI><timestamp> <hostname> <log-prefix>: <sequence> <router-name>  <appid>-
<severity>-<name>-<eventid> [<subject>]: <text>
Then the syslogPdu is constructed via Python as shown in the following example:
syslogPdu = "<" + syslog.severityToPRI(event.severity) + ">" \ + event.timestamp + "
 " \ + syslog.hostname + " " + syslog.logPrefix + ": " + \ event.sequence + " " + ev
ent.routerName + " " + \  event.application + "-
" + \ syslog.severityToName(event.severity) + "-" + \
               event.eventName + "-" + event.eventId + " [" + \
               event.subject + "]: " + event.message
Python 3 syslog APIs
Python APIs are used to modify and assemble a syslog message which, in SR OS, has the format described in section Syslog.
The syslog module for Python 3 is included in the pySROS libraries pre-installed on the SR OS device. The get_event function must be imported from the pysros.syslog module at the beginning of each Python 3 application by including the following:
from pysros.sylog import get_eventThe specific event that the syslog handler is processing can be returned in a variable using the following example Python 3 code:
my_event = get_event()In the preceding example, my_event is an object of type Event. The Event class provides a number of parameters and functions as described in the following table:
| Key name | Python type | Read-only | Description |
|---|---|---|---|
|
name |
String |
N |
Event name |
|
appid |
String |
N |
Name of application that generated the log message |
|
eventid |
Integer |
N |
Event ID number of the application |
|
severity |
String |
N |
Severity level of the event (lowercase). The accepted values in SR OS are:
|
|
sequence |
Integer |
N |
Sequence number of the event in the syslog collector |
|
subject |
String |
N |
Subject or affected object for the event |
|
router_name |
String |
N |
Name of the SR OS router-instance (for example, Base) in which the event is triggered |
|
gentime |
String |
Y |
Timestamp in ISO 8601 format for the generated event. Example: 2021-03-08T11:52:06.0-0500. Changes to the timestamp field are reflected in this field |
|
timestamp |
Float |
N |
Timestamp, in seconds |
|
hostname |
String |
N |
Hostname field of the syslog message. This can be an IP address, a fully-qualified domain name, or a hostname. |
|
log_prefix |
String |
N |
Optional log prefix, for example, TMNX |
|
facility |
Integer |
N |
Syslog facility [0-31] |
|
text |
String |
N |
String representation of the text portion of the message only. By default, this is generated from the eventparameters attribute. |
|
eventparameters |
Dict |
Y |
Python class that behaves similarly to a Python dictionary of all key, value pairs for all log event specific information that does not fall into the standard fields. |
|
format_msg() |
String |
n/a |
Formatted version of the full log message as it appears in show log Note: format_msg() is a function
itself and must be called in order to generate the
formatted message.
|
|
format_syslog_msg() |
String |
n/a |
Formatted version of the syslog message as it would be sent to the syslog server. Note: format_syslog_msg() is a
function itself and must be called in order to
generate the formatted message.
|
|
override_payload(payload) |
n/a |
Provide a custom syslog message as it would appear in the packet, including the header information (facility, timestamp, and so on) and body data (the actual message). Attributes from this Event are used to construct a completely new message format. Any prior changes to the values of these attributes are used. |
|
|
drop() |
n/a |
Drop the message from the pipeline. The syslog message is not sent out (regardless of any subsequent changes in the Python script). The script continues normally. |
The parameter values for the specific event are provided in the Event class. At the end of the Python application execution, the resultant values are returned to the syslog system to transmit the syslog message. Any changes made to the read-write parameters are used in the syslog message unless the drop() method is called.
More information about the pysros.syslog module can be found in the API documentation for pySROS delivered with the pySROS libraries.
Timestamp format manipulation in Python 2
Certain logging environments require customized formatting of the timestamp. Nokia provides a timestamp conversion method in the alu.syslog Python module to convert a timestamp from the format YYYY/MM/DD hh:mm:ss into a UNIX-based timestamp format (seconds from Jan 01 1970 – UTC).
For example, an operator can use the following Python method to convert a timestamp from the YYYY/MM/DD hh:mm:ss.ss or YYYY/MM/DD hh:mm:ss (no centiseconds) format into either the UNIX timestamp format or the MMM DD hh:mm:ss format.
from alc import event
from alc import syslog
from alc import system
#input format: YYYY/MM/DD hh:mm:ss.ss  or YYYY/MM/DD hh:mm:ss
#output format 1: MMM DD hh:mm:ss
#output format 2: unixTimestamp (TBD)
def timeFormatConversion(timestamp,format):
    if format not in range(1,2):
        raise NameError('Unexpected format, expected:' \
                        '0<format<3 got: '+str(format))
    try:
        dat,tim=timestamp.split(' ')
    except:
        raise NameError('Unexpected timestamp format, expected:' \
                        'YYYY/MM/DD hh:mm:ss got: '+timestamp)
    try:
        YYYY,MM,DD=dat.split('/')
    except:
        raise NameError('Unexpected timestamp format, expected:' \
                        'YYYY/MM/DD hh:mm:ss got: '+timestamp)
    try:
        hh,mm,ss=tim.split(':')
        ss=ss.split('.')[0]   #just in case that the time format is hh:mm:ss.ss
    except:
        raise NameError('Unexpected timestamp format, expected:' \
                        'YYYY/MM/DD hh:mm:ss got: '+timestamp)
    if not (1970<=int(YYYY)<2100 and
            1<=int(MM)<=12 and
            1<=int(DD)<=31 and
            0<=int(hh)<=24 and
            0<=int(mm)<=60 and
            0<=int(ss)<=60):
        raise NameError('Unexpected timestamp format, or values out of the range' \
                        'Expected: YYYY/MM/DD hh:mm:ss got: '+timestamp)
    if format == 1:
        MMM={1:'Jan',
             2:'Feb',
             3:'Mar',
             4:'Apr',
             5:'May',
             6:'Jun',
             7:'Jul',
             8:'Aug',
             9:'Sep',
             10:'Oct',
             11:'Nov',
             12:'Dec'}[int(MM)]
        timestamp=MMM+' '+DD+' '+hh+':'+mm+':'+ss
    if format == 2:
        timestamp=syslog.timestampToUnix(timestamp)
    return timestamp
The timeFormatConversion method can accept the event.timestamp value in the format:
YYYY/MM/DD HH:MM:SS.SS
and return a new timestamp in the format determined by the format parameter:
1 MMM DD HH:MM:SS
2 Unix based time format
This method accepts the input format in either of the two forms, YYYY/MM/DD HH:MM:SS.SS or YYYY/MM/DD HH:MM:SS, and ignores the centisecond part in the former form.
Timestamp format manipulation in Python 3
Certain logging environments require customized formatting of the timestamp. The Python 3 interpreter provided with SR OS also provides the utime and datetime modules for format manipulation.
Python processing efficiency
Python retrieves event-related variables from the log manager, as opposed to retrieving pre-assembled syslog messages. This eliminates the need for string parsing of the syslog message to manipulate it constituent parts increasing the speed of Python processing.
To further improve processing performance, Nokia recommends performing string manipulation via the Python native string method, when possible.
Python backpressure
A Python task assembles syslog messages based on the context information received from the logger and sends them to the syslog server independent of the logger. If the Python task is congested because of a high volume of received data, the backpressure should be sent to the ISA so that the ISA stops allocating NAT resources. This behavior matches the current behavior in which NAT resources allocation is blocked if that logger is congested.
Selecting events for Python processing
Events destined for Python processing are configured through a log ID that references a Python policy. Event selection is performed using a filter associated with the log ID. The remainder of the events destined for the same syslog server can bypass Python processing by redirecting them to a different log ID.
-
Use the commands in the following contexts to create the Python
policy and log ID:
- MD-CLI
configure python python-policy PyForLogEvents configure python python-policy syslog - classic
CLI
configure python python-policy PyForLogEvents create
configure python python-policy syslog
- MD-CLI
-
Use log filters to identify the events that are subject to Python
processing:
MD-CLI
[ex:/configure log]
A:admin@node-2# info
    filter "6" {
        default-action drop
        named-entry "1" {
            action forward
            match {
                application {
                    eq nat
                }
                event {
                    eq 2012
                }
            }
        }
    }
    filter "7" {
        default-action forward
        named-entry "1" {
            action drop
            match {
                application {
                    eq nat
                }
                event {
                    eq 2012
                }
            }
        }
    }
classic CLIA:node-2>config>log# info ---------------------------------------------- filter 6 default-action drop entry 1 action forward match application eq "nat" number eq 2012 exit exit exit filter 7 default-action forward entry 1 action drop match application eq "nat" number eq 2012 exit exit exit -
Specify the syslog destination.
MD-CLI
[ex:/configure log]
A:admin@node-2# info
    syslog "1" {
        address 192.168.1.1
    }
classic CLIA:node-2>config>log># info ---------------------------------------------- syslog 1 address 192.168.1.1 exit -
Apply the Python syslog policy to selected events using the
specified filters.
In the following example, the configuration-only event 2012 from application "nat" is sent to log-id 33. All other events are forwarded to the same syslog destination using log-id 34, without any modification. As a result, all events (modified using log-id 33 and unmodified using log-id 34) are sent to the syslog 1 destination.
This configuration may cause reordering of syslog messages at the syslog 1 destination because of slight delay of messages processed by Python.
MD-CLI[ex:/configure log] A:admin@node-2# info log-id "33" { admin-state enable python-policy "PyForLogEvents" filter "6" source { main true } destination { syslog "1" } } log-id "34" { admin-state enable filter "7" source { main true } destination { syslog "1" } }classic CLIA:node-2>config>log># info ---------------------------------------------- log-id 33 filter 6 from main to syslog 1 python-policy "PyForLogEvents" no shutdown exit log-id 34 filter 7 from main to syslog 1 no shutdown exit
Accounting logs
Before an accounting policy can be created, a target log file policy must be created to collect the accounting records. The files are stored in system memory on compact flash (cf1: or cf2:) in a compressed (tar) XML format and can be retrieved using FTP or SCP.
A file policy can only be assigned to either one event log or one accounting log.
Accounting records
An accounting policy must define a record name and collection interval. Only one record name can be configured per accounting policy. Also, a record name can only be used in one accounting policy.
The record name, sub-record types, and default collection period for service and network accounting policies are shown in Accounting record name and collection periods. Policer stats field descriptions (fields per policer stat-mode are provided in the stat-mode command descriptions in the 7450 ESS, 7750 SR, 7950 XRS, and VSR Quality of Service Guide), Queue group record types, and Queue group record type fields provide field descriptions.
| Record name | Sub-record types | Accounting object | Platform | Default collection period (minutes) |
|---|---|---|---|---|
service-ingress-octets |
sio |
SAP |
All |
5 |
service-egress-octets |
seo |
SAP |
All |
5 |
service-ingress-packets |
sip |
SAP |
All |
5 |
service-egress-packets |
sep |
SAP |
All |
5 |
network-ingress-octets |
nio |
Network port |
All |
15 |
network-egress-octets |
neo |
Network port |
All |
15 |
network-egress-packets |
nep |
Network port |
All |
15 |
network-ingress-packets |
nio |
Network port |
All |
15 |
compact-service-ingress-octets |
ctSio |
SAP |
All |
5 |
combined-service-ingress |
cmSipo |
SAP |
All |
5 |
combined-network-ing-egr-octets |
cmNio & cmNeo |
Network port |
All |
15 |
combined-service-ing-egr-octets |
cmSio & cmSeo |
SAP |
All |
5 |
complete-network-ingr-egr |
cpNipo & cpNepo |
Network port |
All |
15 |
complete-service-ingress-egress |
cpSipo & cpSepo |
SAP |
All |
5 |
combined-sdp-ingress-egress |
cmSdpipo and cmSdpepo |
SDP and SDP binding |
All |
5 |
complete-sdp-ingress-egress |
cmSdpipo, cmSdpepo, cpSdpipo and cpSdpepo |
SDP and SDP binding |
All |
5 |
complete-subscriber-ingress-egress |
cpSBipo & cpSBepo |
Subscriber profile |
7750 SR |
5 |
aa-protocol |
aaProt |
AA ISA Group |
7750 SR |
15 |
aa-application |
aaApp |
AA ISA Group |
7750 SR |
15 |
aa-app-group |
aaAppGrp |
AA ISA Group |
7750 SR |
15 |
aa-subscriber-protocol |
aaSubProt |
Special study AA subscriber |
7750 SR |
15 |
aa-subscriber-application |
aaSubApp |
Special study AA subscriber |
7750 SR |
15 |
custom-record-aa-sub |
aaSubCustom |
AA subscriber |
All |
15 |
combined-mpls-lsp-egress |
mplsLspEgr |
LSP |
All |
5 |
combined-mpls-lsp-ingress |
mplsLspIn |
LSP |
All |
5 |
saa |
saa png trc hop |
SAA or SAA test |
All |
5 |
complete-ethernet-port |
enet |
Ethernet port |
All |
15 |
When creating accounting policies, one service accounting policy and one network accounting policy can be defined as default. If statistics collection is enabled on a SAP or network port and no accounting policy is applied, then the respective default policy is used. If no default policy is defined, then no statistics are collected unless a specifically defined accounting policy is applied.
Each accounting record name is composed of one or more sub-records which is in turn composed of multiple fields.
See the Application Assurance Statistics Fields Generated per Record table in the 7450 ESS, 7750 SR, and VSR Multiservice ISA and ESA Guide for fields names for Application Assurance records.
The availability of the records listed in Accounting record name details depends on the specific platform functionality and user configuration.
| Record name | Sub-record | Field | Field description |
|---|---|---|---|
Service-ingress-octets (sio) |
sio |
svc |
SvcId |
sap |
SapId |
||
qid |
QueueId |
||
hoo |
OfferedHiPrioOctets |
||
hod |
DroppedHiPrioOctets |
||
loo |
LowOctetsOffered |
||
lod |
LowOctetsDropped |
||
uco |
UncoloredOctetsOffered |
||
iof |
InProfileOctetsForwarded |
||
oof |
OutOfProfileOctetsForwarded |
||
Service-egress-octets (seo) |
seo |
svc |
SvcId |
sap |
SapId |
||
qid |
QueueId |
||
iof |
InProfileOctetsForwarded |
||
iod |
InProfileOctetsDropped |
||
oof |
OutOfProfileOctetsForwarded |
||
ood |
OutOfProfileOctetsDropped |
||
Service-ingress-packets (sip) 1 |
sip |
svc |
SvcId |
sap |
SapId |
||
qid |
QueueId |
||
hpo |
HighPktsOffered |
||
hpd |
HighPktsDropped |
||
lpo |
LowPktsOffered |
||
lpd |
LowPktsDropped |
||
ucp |
UncoloredPacketsOffered |
||
ipf |
InProfilePktsForwarded |
||
opf |
OutOfProfilePktsForwarded |
||
Service-egress-packets (sep) 1 |
sep |
svc |
SvcId |
sap |
SapId |
||
qid |
QueueId |
||
ipf |
InProfilePktsForwarded |
||
ipd |
InProfilePktsDropped |
||
opf |
OutOfProfilePktsForwarded |
||
opd |
OutOfProfilePktsDropped |
||
Network-ingress-octets (nio) |
nio |
port |
PortId |
qid |
QueueId |
||
iof |
InProfileOctetsForwarded |
||
iod |
InProfileOctetsDropped |
||
oof |
OutOfProfileOctetsForwarded |
||
ood |
OutOfProfileOctetsDropped |
||
Network-egress-octets (neo) |
neo |
port |
PortId |
qid |
QueueId |
||
iof |
InProfileOctetsForwarded |
||
iod |
InProfileOctetsDropped |
||
oof |
OutOfProfileOctetsForwarded |
||
ood |
OutOfProfileOctetsDropped |
||
Network-ingress-packets (nip) |
nip |
port |
PortId |
qid |
QueueId |
||
ipf |
InProfilePktsForwarded |
||
ipd |
InProfilePktsDropped |
||
opf |
OutOfProfilePktsForwarded |
||
opd |
OutOfProfilePktsDropped |
||
Network-egress-packets (nep) |
nep |
port |
PortId |
qid |
QueueId |
||
ipf |
InProfilePktsForwarded |
||
ipd |
InProfilePktsDropped |
||
opf |
OutOfProfilePktsForwarded |
||
opd |
OutOfProfilePktsDropped |
||
Compact-service-ingress-octets (ctSio) |
ctSio |
svc |
SvcId |
sap |
SapId |
||
qid |
QueueId |
||
hoo |
OfferedHiPrioOctets |
||
hod |
DroppedHiPrioOctets |
||
loo |
LowOctetsOffered |
||
lod |
LowOctetsDropped |
||
uco |
UncoloredOctetsOffered |
||
Combined-service-ingress (cmSipo) |
cmSipo |
svc |
SvcId |
sap |
SapId |
||
qid |
QueueId |
||
hpo |
HighPktsOffered |
||
hpd |
HighPktsDropped |
||
lpo |
LowPktsOffered |
||
lpd |
LowPktsDropped |
||
ucp |
UncoloredPacketsOffered |
||
hoo |
OfferedHiPrioOctets |
||
hod |
DroppedHiPrioOctets |
||
loo |
LowOctetsOffered |
||
lod |
LowOctetsDropped |
||
uco |
UncoloredOctetsOffered |
||
ipf |
InProfilePktsForwarded |
||
opf |
OutOfProfilePktsForwarded |
||
iof |
InProfileOctetsForwarded |
||
oof |
OutOfProfileOctetsForwarded |
||
Combined-network-ing-egr-octets (cmNio & cmNeo) |
cmNio |
port |
PortId |
qid |
QueueId |
||
iof |
InProfileOctetsForwarded |
||
iod |
InProfileOctetsDropped |
||
oof |
OutOfProfileOctetsForwarded |
||
ood |
OutOfProfileOctetsDropped |
||
cmNeo |
port |
PortId |
|
qid |
QueueId |
||
iof |
InProfileOctetsForwarded |
||
iod |
InProfileOctetsDropped |
||
oof |
OutOfProfileOctetsForwarded |
||
ood |
OutOfProfileOctetsDropped |
||
Combined-service-ingr-egr-octets (cmSio & CmSeo) |
cmSio |
svc |
SvcId |
sap |
SapId |
||
qid |
QueueId |
||
hoo |
OfferedHiPrioOctets |
||
hod |
DroppedHiPrioOctets |
||
loo |
LowOctetsOffered |
||
lod |
LowOctetsDropped |
||
uco |
UncoloredOctetsOffered |
||
iof |
InProfileOctetsForwarded |
||
oof |
OutOfProfileOctetsForwarded |
||
cmSeo |
svc |
SvcId |
|
sap |
SapId |
||
qid |
QueueId |
||
iof |
InProfileOctetsForwarded |
||
iod |
InProfileOctetsDropped |
||
oof |
OutOfProfileOctetsForwarded |
||
ood |
OutOfProfileOctetsDropped |
||
Complete-network-ingr-egr (cpNipo & cpNepo) |
cpNipo |
port |
PortId |
qid |
QueueId |
||
ipf |
InProfilePktsForwarded |
||
ipd |
InProfilePktsDropped |
||
opf |
OutOfProfilePktsForwarded |
||
opd |
OutOfProfilePktsDropped |
||
iof |
InProfileOctetsForwarded |
||
iod |
InProfileOctetsDropped |
||
oof |
OutOfProfileOctetsForwarded |
||
ood |
OutOfProfileOctetsDropped |
||
cpNepo |
port |
PortId |
|
qid |
QueueId |
||
ipf |
InProfilePktsForwarded |
||
ipd |
InProfilePktsDropped |
||
opf |
OutOfProfilePktsForwarded |
||
opd |
OutOfProfilePktsDropped |
||
iof |
InProfileOctetsForwarded |
||
iod |
InProfileOctetsDropped |
||
oof |
OutOfProfileOctetsForwarded |
||
ood |
OutOfProfileOctetsDropped |
||
Complete-service-ingress-egress (cpSipo & cpSepo) |
cpSipo |
svc |
SvcId |
sap |
SapId |
||
qid |
QueueId |
||
hpo |
HighPktsOffered |
||
hpd |
HighPktsDropped |
||
lpo |
LowPktsOffered |
||
lpd |
LowPktsDropped |
||
ucp |
UncoloredPacketsOffered |
||
hoo |
OfferedHiPrioOctets |
||
hod |
DroppedHiPrioOctets |
||
loo |
LowOctetsOffered |
||
lod |
LowOctetsDropped |
||
uco |
UncoloredOctetsOffered |
||
apo |
AllPacketsOffered |
||
aoo |
AllOctetsOffered |
||
apd |
AllPacketsDropped |
||
aod |
AllOctetsDropped |
||
apf |
AllPacketsForwarded |
||
aof |
AllOctetsForwarded |
||
ipd |
InProfilePktsDropped |
||
iod |
InProfileOctetsDropped |
||
opd |
OutOfProfilePktsDropped |
||
ood |
OutOfProfileOctetsDropped |
||
hpf |
HighPriorityPacketsForwarded |
||
hof |
HighPriorityOctetsForwarded |
||
Complete-service-ingress-egress (cpSipo & cpSepo) (Continued) |
cpSipo (Continued) |
lpf |
LowPriorityPacketsForwarded |
lof |
LowPriorityOctesForwarded |
||
ipf |
InProfilePktsForwarded |
||
opf |
OutOfProfilePktsForwarded |
||
iof |
InProfileOctetsForwarded |
||
oof |
OutOfProfileOctetsForwarded |
||
cpSepo |
svc |
SvcId |
|
sap |
SapId |
||
qid |
QueueId |
||
ipf |
InProfilePktsForwarded |
||
ipd |
InProfilePktsDropped |
||
opf |
OutOfProfilePktsForwarded |
||
opd |
OutOfProfilePktsDropped |
||
iof |
InProfileOctetsForwarded |
||
iod |
InProfileOctetsDropped |
||
oof |
OutOfProfileOctetsForwarded |
||
ood |
OutOfProfileOctetsDropped |
||
Complete-sdp-ingress-egress (cpSdpipo & cpSdpepo) |
cpSdpipo |
sdp |
SdpID |
tpf |
TotalPacketsForwarded |
||
tpd |
TotalPacketsDropped |
||
tof |
TotalOctetsForwarded |
||
tod |
TotalOctetsDropped |
||
cpSdpepo |
sdp |
SdpID |
|
tpd |
TotalPacketsDropped |
||
tod |
TotalOctetsDropped |
||
Combined-sdp-ingress-egress (cmSdpipo & cmSdpepo) |
cmSdpipo |
svc |
SvcID |
sdp |
SdpID |
||
tpf |
TotalPacketsForwarded |
||
tpd |
TotalPacketsDropped |
||
tof |
TotalOctetsForwarded |
||
tod |
TotalOctetsDropped |
||
cmSdpepo |
svc |
SvcID |
|
sdp |
SdpID |
||
tpf |
TotalPacketsForwarded |
||
tof |
TotalOctetsForwarded |
||
Complete-sdp-ingress-egress (cmSdpipo & cmsdpepo) (cpSdpip & cpSdpepo) |
cmSdpipo |
svc |
SvcID |
sdp |
SdpID |
||
tpf |
TotalPacketsForwarded |
||
tpd |
TotalPacketsDropped |
||
tof |
TotalOctetsForwarded |
||
tod |
TotalOctetsDropped |
||
cmSdpepo |
svc |
SvcID |
|
sdp |
SdpID |
||
tpf |
TotalPacketsForwarded |
||
tof |
TotalOctetsForwarded |
||
cpSdpipo |
sdp |
SdpID |
|
tpf |
TotalPacketsForwarded |
||
tpd |
TotalPacketsDropped |
||
tof |
TotalOctetsForwarded |
||
tod |
TotalOctetsDropped |
||
cpSdpepo |
sdp |
SdpID |
|
tpf |
TotalPacketsForwarded |
||
tof |
TotalOctetsForwarded |
||
Complete-subscriber-ingress-egress (cpSBipo & cpSBepo) |
SubscriberInformation |
subId |
SubscriberId |
subProfile |
SubscriberProfile |
||
Sla- Information |
svc |
SvcId |
|
sap |
SapId |
||
slaProfile |
SlaProfile |
||
spiSharing |
SPI sharing type and identifier |
||
Complete-subscriber-ingress-egress (cpSBipo & cpSBepo) (Continued) |
cpSBipo |
qid |
QueueId |
hpo |
HighPktsOffered |
||
hpd |
HighPktsDropped |
||
lpo |
LowPktsOffered |
||
lpd |
LowPktsDropped |
||
ucp |
UncolouredPacketsOffered |
||
hoo |
OfferedHiPrioOctets |
||
hod |
DroppedHiPrioOctets |
||
loo |
LowOctetsOffered |
||
lod |
LowOctetsDropped |
||
apo |
AllPktsOffered |
||
aoo |
AllOctetsOffered |
||
uco |
UncolouredOctetsOffered |
||
ipf |
InProfilePktsForwarded |
||
opf |
OutOfProfilePktsForwarded |
||
iof |
InProfileOctetsForwarded |
||
oof |
OutOfProfileOctetsForwarded |
||
v4pf |
IPv4PktsForwarded |
||
v6pf |
IPv6PktsForwarded |
||
v4pd |
IPv4PktsDropped |
||
v6pd |
IPv6PktsDropped |
||
v4of |
IPv4OctetsForwarded |
||
v6of |
IPv6OctetsForwarded |
||
v4od |
IPv4OctetsDropped |
||
v6od |
IPv6OctetsDropped |
||
Complete-subscriber-ingress-egress (cpSBipo & cpSBepo) (Continued) |
cpSBepo |
qid |
QueueId |
ipf |
InProfilePktsForwarded |
||
ipd |
InProfilePktsDropped |
||
opf |
OutOfProfilePktsForwarded |
||
opd |
OutOfProfilePktsDropped |
||
iof |
InProfileOctetsForwarded |
||
iod |
InProfileOctetsDropped |
||
oof |
OutOfProfileOctetsForwarded |
||
ood |
OutOfProfileOctetsDropped |
||
v4pf |
IPv4PktsForwarded |
||
v6pf |
IPv6PktsForwarded |
||
v4pd |
IPv4PktsDropped |
||
v6pd |
IPv6PktsDropped |
||
v4of |
IPv4OctetsForwarded |
||
v6of |
IPv6OctetsForwarded |
||
v4od |
IPv4OctetsDropped |
||
v6od |
IPv6OctetsDropped |
||
saa |
saa |
tmd |
TestMode |
own |
OwnerName |
||
tst |
TestName |
||
png |
PingRun subrecord |
||
rid |
RunIndex |
||
trr |
TestRunResult |
||
mnr |
MinRtt |
||
mxr |
MaxRtt |
||
avr |
AverageRtt |
||
rss |
RttSumOfSquares |
||
pbr |
ProbeResponses |
||
spb |
SentProbes |
||
mnt |
MinOutTt |
||
mxt |
MaxOutTt |
||
avt |
AverageOutTt |
||
tss |
OutTtSumOfSquares |
||
mni |
MinInTt |
||
mxi |
MaxInTt |
||
avi |
AverageInTt |
||
iss |
InTtSumOfSqrs |
||
ojt |
OutJitter |
||
ijt |
InJitter |
||
rjt |
RtJitter |
||
prt |
ProbeTimeouts |
||
prf |
ProbeFailures |
||
saa (Continued) |
trc |
rid |
RunIndex |
trr |
TestRunResult |
||
lgp |
LastGoodProbe |
||
hop |
hop |
TraceHop |
|
hid |
HopIndex |
||
mnr |
MinRtt |
||
mxr |
MaxRtt |
||
avr |
AverageRtt |
||
rss |
RttSumOfSquares |
||
pbr |
ProbeResponses |
||
spb |
SentProbes |
||
mnt |
MinOutTt |
||
mxt |
MaxOutTt |
||
avt |
AverageOutTt |
||
tss |
OutTtSumOfSquares |
||
mni |
MinInTt |
||
mxi |
MaxInTt |
||
avi |
AverageInTt |
||
iss |
InTtSumOfSqrs |
||
ojt |
OutJitter |
||
ijt |
InJitter |
||
rjt |
RtJitter |
||
prt |
ProbeTimeouts |
||
prf |
ProbeFailures |
||
tat |
TraceAddressType |
||
tav |
TraceAddressValue |
||
Complete-ethernet-port (enet) |
enet |
port |
PortId |
to |
EtherStatsOctets |
||
tp |
EtherStatsPkts |
||
de |
EtherStatsDropEvents |
||
tbcp |
EtherStatsBroadcastPkts |
||
mcp |
EtherStatsMulticastPkts |
||
cae |
EtherStatsCRCAlignErrors |
||
up |
EtherStatsUndersizePkts |
||
op |
EtherStatsOversizePkts |
||
fgm |
EtherStatsFragments |
||
jab |
EtherStatsJabbers |
||
col |
EtherStatsCollisions |
||
p64o |
EtherStatsPkts64Octets |
||
p127o |
EtherStatsPkts65to127Octets |
||
p255o |
EtherStatsPkts128to255Octets |
||
p511o |
EtherStatsPkts256to511Octets |
||
p1023o |
EtherStatsPkts512to1023Octets |
||
p1518o |
EtherStatsPkts1024to1518Octets |
||
po1518o |
EtherStatsPktsOver1518Octets |
||
ae |
Dot3StatsAlignmentErrors |
||
fe |
Dot3StatsFCSErrors |
||
scf |
Dot3StatsSingleCollisionFrames |
||
mcf |
Dot3StatsMultipleCollisionFrames |
||
sqe |
Dot3StatsSQETestErrors |
||
dt |
Dot3StatsDeferredTransmissions |
||
Complete-ethernet-port (enet) (Continued) |
enet (Continued) |
lcc |
Dot3StatsLateCollisions |
exc |
Dot3StatsExcessiveCollisions |
||
imt |
Dot3StatsInternalMacTransmitErrors |
||
cse |
Dot3StatsCarrierSenseErrors |
||
ftl |
Dot3StatsFrameTooLongs |
||
imre |
Dot3StatsInternalMacReceiveErrors |
||
se |
Dot3StatsSymbolErrors |
||
ipf |
Dot3InPauseFrames |
||
opf |
Dot3OutPauseFrames |
Policer stats field descriptions, Queue group record types, and Queue group record type fields provide field descriptions.
| Field | Field description |
|---|---|
pid |
PolicerId |
statmode |
PolicerStatMode |
aod |
AllOctetsDropped |
aof |
AllOctetsForwarded |
aoo |
AllOctetsOffered |
apd |
AllPacketsDropped |
apf |
AllPacketsForwarded |
apo |
AllPacketsOffered |
c1od |
ConnectionOneOctetsDropped2 |
c1of |
ConnectionOneOctetsForwarded2 |
c1oo |
ConnectionOneOctetsOffered2 |
c1pd |
ConnectionOnePacketsDropped2 |
c1pf |
ConnectionOnePacketsForwarded2 |
c1po |
ConnectionOnePacketsOffered2 |
c2od |
ConnectionTwoOctetsDropped2 |
c2of |
ConnectionTwoOctetsForwarded2 |
c2oo |
ConnectionTwoOctetsOffered2 |
c2pd |
ConnectionTwoPacketsDropped2 |
c2pf |
ConnectionTwoPacketsForwarded2 |
c2po |
ConnectionTwoPacketsOffered2 |
hod |
HighPriorityOctetsDropped |
hof |
HighPriorityOctetsForwarded |
hoo |
HighPriorityOctetsOffered |
hpd |
HighPriorityPacketsDropped |
hpf |
HighPriorityPacketsForwarded |
hpo |
HighPriorityPacketsOffered |
iod |
InProfileOctetsDropped |
iof |
InProfileOctetsForwarded |
ioo |
InProfileOctetsOffered |
ipd |
InProfilePacketsDropped |
ipf |
InProfilePacketsForwarded |
ipo |
InProfilePacketsOffered |
lod |
LowPriorityOctetsDropped |
lof |
LowPriorityOctetsForwarded |
loo |
LowPriorityOctetsOffered |
lpd |
LowPriorityPacketsDropped |
lpf |
LowPriorityPacketsForwarded |
lpo |
LowPriorityPacketsOffered |
opd |
OutOfProfilePacketsDropped |
opf |
OutOfProfilePacketsForwarded |
opo |
OutOfProfilePacketsOffered |
ood |
OutOfProfileOctetsDropped |
oof |
OutOfProfileOctetsForwarded |
ooo |
OutOfProfileOctetsOffered |
xpd |
ExceedProfilePktsDropped |
xpf |
ExceedProfilePktsForwarded |
xpo |
ExceedProfilePktsOffered |
xod |
ExceedProfileOctetsDropped |
xof |
ExceedProfileOctetsForwarded |
xoo |
ExceedProfileOctetsOffered |
ppd |
InplusProfilePacketsDropped |
ppf |
InplusProfilePacketsForwarded |
ppo |
InplusProfilePacketsOffered |
pod |
InplusProfileOctetsDropped |
pof |
InplusProfileOctetsForwarded |
poo |
InplusProfileOctetsOffered |
uco |
UncoloredOctetsOffered |
ucp |
UncoloredPacketsOffered |
v4po |
IPv4PktsOffered 3 |
v4oo |
IPv4OctetsOffered3 |
v6po |
IPv6PktsOffered3 |
v6oo |
IPv6OctetsOffered3 |
v4pf |
IPv4PktsForwarded3 |
v6pf |
IPv6PktsForwarded3 |
v4pd |
IPv4PktsDropped3 |
v6pd |
IPv6PktsDropped3 |
v4of |
IPv4OctetsForwarded3 |
v6of |
IPv6OctetsForwarded3 |
v4od |
IPv4OctetsDropped3 |
v6od |
IPv6OctetsDropped3 |
| Record name | Description |
|---|---|
qgone |
PortQueueGroupOctetsNetworkEgress |
qgosi |
PortQueueGroupOctetsServiceIngress |
qgose |
PortQueueGroupOctetsServiceEgress |
qgpne |
PortQueueGroupPacketsNetworkEgress |
qgpsi |
PortQueueGroupPacketsServiceIngress |
qgpse |
PortQueueGroupPacketsServiceEgress |
fpqgosi |
ForwardingPlaneQueueGroupOctetsServiceIngress |
fpqgoni |
ForwardingPlaneQueueGroupOctetsNetworkIngress |
fpqgpsi |
ForwardingPlaneQueueGroupPacketsServiceIngress |
fpqgpni |
ForwardingPlaneQueueGroupPacketsNetworkIngress |
| Field | Field description |
|---|---|
data port |
Port (used for port based Queue Groups) |
member-port |
LAGMemberPort (used for port based Queue Groups) |
data slot |
Slot (used for Forwarding Plane based Queue Groups) |
forwarding-plane |
ForwardingPlane (used for Forwarding Plane based Queue Groups) |
queue-group |
QueueGroupName |
instance |
QueueGroupInstance |
qid |
QueueId |
pid |
PolicerId |
statmode |
PolicerStatMode |
aod...ucp |
same as above |
Accounting files
When a policy has been created and applied to a service or network port, the accounting file is stored on the compact flash in a compressed XML file format. The router creates two directories on the compact flash to store the files. The following output displays a directory named act-collect that holds accounting files that are open and actively collecting statistics. The directory named act stores the files that have been closed and are awaiting retrieval.
ALA-1>file cf1:\# dir act*
12/19/2006 06:08a      <DIR>          act-collect
12/19/2006 06:08a      <DIR>          act

ALA-1>file cf1:\act-collect\ # dir
Directory of cf1:\act-collect#

12/23/2006 01:46a      <DIR>          .
12/23/2006 12:47a      <DIR>          ..
12/23/2006 01:46a                 112 act1111-20031223-014658.xml.gz
12/23/2006 01:38a                 197 act1212-20031223-013800.xml.gz
Accounting files always have the prefix "act" followed by the accounting policy ID, log ID, and timestamp. The accounting log file naming and log file policy properties like rollover and retention are described in more detail in Log files.
Design considerations for accounting policies
The router has ample resources to support large scale accounting policy deployments. When preparing for an accounting policy deployment, verify that data collection, file rollover, and file retention intervals are properly tuned for the amount of statistics to be collected.
If the accounting policy collection interval is too brief there may be insufficient time to store the data from all the services within the specified interval. If that is the case, some records may be lost or incomplete. Interval time, record types, and number of services using an accounting policy are all factors that should be considered when implementing accounting policies.
The rollover and retention intervals on the log files and the frequency of file retrieval must also be considered when designing accounting policy deployments. The amount of data stored depends on the type of record collected, the number of services that are collecting statistics, and the collection interval that is used. For example, with a 1Gb CF and using the default collection interval, the system is expected to hold 48 hours’ worth of billing information.
Reporting and time-based accounting
SR OS on the 7750 SR platform has support for volume accounting and time-based accounting concepts, and provides an extra level of intelligence at the network element level to provide service models such as ‟prepaid access” in a scalable manner. This means that the network element gathers and stores per-subscriber accounting information and compares it with ‟pre-defined” quotas. When a quota is exceeded, the pre-defined action (such as re-direction to a web portal or disconnect) is applied.
Custom record usage for overhead reduction in accounting
Custom records can be used to decrease accounting messaging overhead as follows:
User configurable records
Users can define a collection of fields that make up a record. These records can be assigned to an accounting policy. These are user-defined records instead of being limited to pre-defined record types. The operator can select queues and policers and the counters within these queues and policers that need to be collected. See the predefined records containing a specific field for XML field name of a custom record field.
Changed statistics only
A record is only generated if a significant change has occurred to the fields being written in a specific record. This capability applies to both ingress and egress records regardless on the method of delivery (such as RADIUS and XML). The capability also applies to Application Assurance records; however without an ability to specify different significant change values and per-field scope (for example, all fields of a custom record are collected if any activity was reported against any of the statistics that are part of the custom record).
Configurable accounting records
XML accounting files for service and ESM-based accounting
To reduce the volume of data generated, you can specify which records are needed for collection. This excludes queues and policers or selected counters within the queues and policers that are not relevant for billing.
Use the commands in the following context to configure custom records.
configure log accounting-policy custom-recordESM-based accounting applies to the 7750 SR only.
Record headers including information such as service ID or SAP ID are always generated.
XML accounting files for policer counters
Policer counters can be collected using custom records within the accounting policy configuration. The policer identifier for which counters are collected must be configured under custom-record, specifying the required ingress (i-counters) and egress (e-counters) counters to be collected. A similar configuration is available for a reference policer (ref-policer) to define a reference counter used together with the significant-change command.
The counters collected are dependent on the stat-mode of the related policer, as this determines which statistics are collected by the system for the policer.
The ingress policer counters collected for each combination of XML accounting record name and policer stat-mode are provided in Custom record policer ingress counter mapping.
The egress policer counters collected for each combination of XML accounting record name and policer stat-mode are provided in Custom record policer egress counter mapping.
| Policer i-counters CLI name | Policer stat-mode | Custom record counter | Custom record field |
|---|---|---|---|
|
in-profile-octets-discarded-count |
minimal |
— |
— |
|
offered-limited-capped-cir offered-limited-profile-cir offered-priority-cir offered-profile-capped-cir offered-profile-cir offered-profile-no-cir offered-total-cir |
In-Profile Octets Dropped |
iod |
|
|
offered-priority-no-cir |
High-Priority Octets Dropped |
hod |
|
|
v4-v6 |
V4 Octets Dropped |
v4od |
|
|
in-profile-octets-forwarded-count |
minimal |
— |
— |
|
offered-limited-capped-cir offered-limited-profile-cir offered-priority-cir offered-profile-capped-cir offered-profile-cir offered-profile-no-cir offered-total-cir |
In-Profile Octets Forwarded |
iof |
|
|
offered-priority-no-cir |
High-Priority Octets Forwarded |
hof |
|
|
v4-v6 |
V4 Octets Forwarded |
v4of |
|
|
in-profile-octets-offered-count |
minimal offered-limited-profile-cir offered-total-cir |
— |
— |
|
offered-limited-capped-cir offered-profile-capped-cir offered-profile-cir offered-profile-no-cir |
In-Profile Octets Offered |
ioo |
|
|
offered-priority-cir offered-priority-no-cir |
High-Priority Octets Offered |
hoo |
|
|
v4-v6 |
V4 Octets Offered |
v4oo |
|
|
in-profile-packets-discarded-count |
minimal |
— |
— |
|
offered-limited-capped-cir offered-limited-profile-cir offered-priority-cir offered-profile-capped-cir offered-profile-cir offered-profile-no-cir offered-total-cir |
In-Profile Packets Dropped |
ipd |
|
|
offered-priority-no-cir |
High-Priority Packets Dropped |
hpd |
|
|
v4-v6 |
V4 Packets Dropped |
v4pd |
|
|
in-profile-packets-forwarded-count |
minimal |
— |
— |
|
offered-limited-capped-cir offered-limited-profile-cir offered-priority-cir offered-profile-capped-cir offered-profile-cir offered-profile-no-cir offered-total-cir |
In-Profile Packets Forwarded |
ipf |
|
|
offered-priority-no-cir |
High-Priority Packets Forwarded |
hpf |
|
|
v4-v6 |
V4 Packets Forwarded |
v4pf |
|
|
in-profile-packets-offered-count |
minimal offered-limited-profile-cir offered-total-cir |
— |
— |
|
offered-limited-capped-cir offered-profile-capped-cir offered-profile-cir offered-profile-no-cir |
In-Profile Packets Offered |
ipo |
|
|
offered-priority-cir offered-priority-no-cir |
High-Priority Packets Offered |
hpo |
|
|
v4-v6 |
V4 Packets Offered |
v4po |
|
|
out-profile-octets-discarded-count |
minimal |
All Octets Dropped |
aod |
|
offered-limited-capped-cir offered-limited-profile-cir offered-priority-cir offered-profile-capped-cir offered-profile-cir offered-profile-no-cir offered-total-cir |
Out-of-Profile Octets Dropped |
ood |
|
|
offered-priority-no-cir |
Low-Priority Octets Dropped |
lod |
|
|
v4-v6 |
V6 Octets Dropped |
v6od |
|
|
out-profile-octets-forwarded-count |
minimal |
All Octets Forwarded |
aof |
|
offered-limited-capped-cir offered-limited-profile-cir offered-priority-cir offered-profile-capped-cir offered-profile-cir offered-profile-no-cir offered-total-cir |
Out-of-Profile Octets Forwarded |
oof |
|
|
offered-priority-no-cir |
Low-Priority Octets Forwarded |
lof |
|
|
v4-v6 |
V6 Octets Forwarded |
v6of |
|
|
out-profile-octets-offered-count |
minimal offered-total-cir |
All Octets Offered |
aoo |
|
offered-limited-capped-cir |
— |
— |
|
|
offered-limited-profile-cir offered-profile-capped-cir offered-profile-cir offered-profile-no-cir |
Out-of-Profile Octets Offered |
ooo |
|
|
offered-priority-cir offered-priority-no-cir |
Low-Priority Octets Offered |
loo |
|
|
v4-v6 |
V6 Octets Offered |
v6oo |
|
|
out-profile-packets-discarded-count |
minimal |
All Packets Dropped |
apd |
|
offered-limited-capped-cir offered-limited-profile-cir offered-priority-cir offered-profile-capped-cir offered-profile-cir offered-profile-no-cir offered-total-cir |
Out-of-Profile Packets Dropped |
opd |
|
|
offered-priority-no-cir |
Low-Priority Packets Dropped |
lpd |
|
|
v4-v6 |
V6 Packets Dropped |
v6pd |
|
|
out-profile-packets-forwarded-count |
minimal |
All Packets Forwarded |
apf |
|
offered-limited-capped-cir offered-limited-profile-cir offered-priority-cir offered-profile-capped-cir offered-profile-cir offered-profile-no-cir offered-total-cir |
Out-of-Profile Packets Forwarded |
opf |
|
|
offered-priority-no-cir |
Low-Priority Packets Forwarded |
lpf |
|
|
v4-v6 |
V6 Packets Forwarded |
v6pf |
|
|
out-profile-packets-offered-count |
minimal offered-total-cir |
All Packets Offered |
apo |
|
offered-limited-capped-cir |
n/a |
n/a |
|
|
offered-limited-profile-cir offered-profile-capped-cir offered-profile-cir offered-profile-no-cir |
Out-of-Profile Packets Offered |
opo |
|
|
offered-priority-cir offered-priority-no-cir |
Low-Priority Packets Offered |
lpo |
|
|
v4-v6 |
V6 Packets Offered |
v6po |
|
|
uncoloured-octets-offered-count |
minimal offered-priority-cir offered-priority-no-cir offered-profile-no-cir offered-total-cir v4-v6 |
— |
— |
|
offered-limited-capped-cir offered-limited-profile-cir offered-profile-capped-cir offered-profile-cir |
Uncoloured Octets Offered |
uco |
|
|
uncoloured-packets-offered-count |
minimal offered-priority-cir offered-priority-no-cir offered-profile-no-cir offered-total-cir v4-v6 |
— |
— |
|
offered-limited-capped-cir offered-limited-profile-cir offered-profile-capped-cir offered-profile-cir |
Uncoloured Packets Offered |
ucp |
| Policer e-counters CLI name | Policer stat-mode | Custom record counter | Custom record field |
|---|---|---|---|
|
exceed-profile-octets-discarded-count |
bonding minimal offered-limited-capped-cir offered-profile-capped-cir offered-profile-cir offered-profile-no-cir offered-total-cir v4-v6 |
n/a |
n/a |
|
offered-four-profile-no-cir offered-total-cir-exceed offered-total-cir-four-profile |
Exceed-Profile Octets Dropped |
xod |
|
|
exceed-profile-octets-forwarded-count |
bonding minimal offered-limited-capped-cir offered-profile-capped-cir offered-profile-cir offered-profile-no-cir offered-total-cir v4-v6 |
— |
— |
|
offered-four-profile-no-cir offered-total-cir-exceed offered-total-cir-four-profile |
Exceed-Profile Octets Forwarded |
xof |
|
|
exceed-profile-octets-offered-count |
bonding minimal offered-limited-capped-cir offered-profile-capped-cir offered-profile-cir offered-profile-no-cir offered-total-cir offered-total-cir-exceed offered-total-cir-four-profile v4-v6 |
— |
— |
|
offered-four-profile-no-cir |
Exceed-Profile Octets Offered |
xoo |
|
|
exceed-profile-packets-discarded-count |
bonding minimal offered-limited-capped-cir offered-profile-capped-cir offered-profile-cir offered-profile-no-cir offered-total-cir v4-v6 |
— |
— |
|
offered-four-profile-no-cir offered-total-cir-exceed offered-total-cir-four-profile |
Exceed-Profile Packets Dropped |
xpd |
|
|
exceed-profile-packets-forwarded-count |
bonding minimal offered-limited-capped-cir offered-profile-capped-cir offered-profile-cir offered-profile-no-cir offered-total-cir v4-v6 |
— |
— |
|
offered-four-profile-no-cir offered-total-cir-exceed offered-total-cir-four-profile |
Exceed-Profile Packets Forwarded |
xpf |
|
|
exceed-profile-packets-offered-count |
bonding minimal offered-limited-capped-cir offered-profile-capped-cir offered-profile-cir offered-profile-no-cir offered-total-cir offered-total-cir-exceed offered-total-cir-four-profile v4-v6 |
— |
— |
|
offered-four-profile-no-cir |
Exceed-Profile Packets Offered |
xpo |
|
|
in-plus-profile-octets-discarded-count |
bonding minimal offered-limited-capped-cir offered-profile-capped-cir offered-profile-cir offered-profile-no-cir offered-total-cir offered-total-cir-exceed v4-v6 |
— |
— |
|
offered-four-profile-no-cir offered-total-cir-four-profile |
In-Plus-Profile Octets Dropped |
pod |
|
|
in-plus-profile-octets-forwarded-count |
bonding minimal offered-limited-capped-cir offered-profile-capped-cir offered-profile-cir offered-profile-no-cir offered-total-cir offered-total-cir-exceed v4-v6 |
— |
— |
|
offered-four-profile-no-cir offered-total-cir-four-profile |
In-Plus-Profile Octets Forwarded |
pof |
|
|
in-plus-profile-octets-offered-count |
bonding minimal offered-limited-capped-cir offered-profile-capped-cir offered-profile-cir offered-profile-no-cir offered-total-cir offered-total-cir-exceed offered-total-cir-four-profile v4-v6 |
— |
— |
|
offered-four-profile-no-cir |
In-Plus-Profile Octets Offered |
poo |
|
|
in-plus-profile-packets-discarded-count |
bonding minimal offered-limited-capped-cir offered-profile-capped-cir offered-profile-cir offered-profile-no-cir offered-total-cir offered-total-cir-exceed v4-v6 |
— |
— |
|
offered-four-profile-no-cir offered-total-cir-four-profile |
In-Plus-Profile Packets Dropped |
ppd |
|
|
in-plus-profile-packets-forwarded-count |
bonding minimal offered-limited-capped-cir offered-profile-capped-cir offered-profile-cir offered-profile-no-cir offered-total-cir offered-total-cir-exceed v4-v6 |
— |
— |
|
offered-four-profile-no-cir offered-total-cir-four-profile |
In-Plus-Profile Packets Forwarded |
ppf |
|
|
in-plus-profile-packets-offered-count |
bonding minimal offered-limited-capped-cir offered-profile-capped-cir offered-profile-cir offered-profile-no-cir offered-total-cir offered-total-cir-exceed offered-total-cir-four-profile v4-v6 |
— |
— |
|
offered-four-profile-no-cir |
In-Plus-Profile Packets Offered |
ppo |
|
|
in-profile-octets-discarded-count |
bonding |
Connection 1 Octets Dropped |
c1od |
|
minimal |
— |
— |
|
|
offered-four-profile-no-cir offered-limited-capped-cir offered-profile-capped-cir offered-profile-cir offered-profile-no-cir offered-total-cir offered-total-cir-exceed offered-total-cir-four-profile |
In-Profile Octets Dropped |
iod |
|
|
v4-v6 |
V4 Octets Dropped |
v4od |
|
|
in-profile-octets-forwarded-count |
bonding |
Connection 1 Octets Forwarded |
c1of |
|
minimal |
— |
— |
|
|
offered-limited-capped-cir offered-profile-capped-cir offered-profile-cir offered-profile-no-cir offered-total-cir offered-total-cir-exceed offered-four-profile-no-cir offered-total-cir-four-profile |
In-Profile Octets Forwarded |
iof |
|
|
v4-v6 |
V4 Octets Forwarded |
v4of |
|
|
in-profile-octets-offered-count |
bonding |
Connection 1 Octets Offered |
c1oo |
|
minimal offered-total-cir offered-total-cir-exceed offered-total-cir-four-profile |
— |
— |
|
|
offered-four-profile-no-cir offered-limited-capped-cir offered-profile-capped-cir offered-profile-cir offered-profile-no-cir |
In-Profile Octets Offered |
ioo |
|
|
v4-v6 |
V4 Octets Offered |
v4oo |
|
|
in-profile-packets-discarded-count |
bonding |
Connection 1 Packets Dropped |
c1pd |
|
minimal |
— |
— |
|
|
offered-four-profile-no-cir offered-limited-capped-cir offered-profile-capped-cir offered-profile-cir offered-profile-no-cir offered-total-cir offered-total-cir-exceed offered-total-cir-four-profile |
In-Profile Packets Dropped |
ipd |
|
|
v4-v6 |
V4 Packets Dropped |
v4pd |
|
|
in-profile-packets-forwarded-count |
bonding |
Connection 1 Packets Forwarded |
c1pf |
|
minimal |
— |
— |
|
|
offered-limited-capped-cir offered-profile-capped-cir offered-profile-cir offered-profile-no-cir offered-total-cir offered-total-cir-exceed offered-four-profile-no-cir offered-total-cir-four-profile |
In-Profile Packets Forwarded |
ipf |
|
|
v4-v6 |
V4 Packets Forwarded |
v4pf |
|
|
in-profile-packets-offered-count |
bonding |
Connection 1 Packets Offered |
c1po |
|
minimal offered-total-cir offered-total-cir-exceed offered-total-cir-four-profile |
— |
— |
|
|
offered-four-profile-no-cir offered-limited-capped-cir offered-profile-capped-cir offered-profile-cir offered-profile-no-cir |
In-Profile Packets Offered |
ipo |
|
|
v4-v6 |
V4 Packets Offered |
v4po |
|
|
out-profile-octets-discarded-count |
bonding |
Connection 2 Octets Dropped |
c2od |
|
minimal |
All Octets Dropped |
aod |
|
|
offered-limited-capped-cir offered-profile-capped-cir offered-profile-cir offered-profile-no-cir offered-total-cir offered-total-cir-exceed offered-four-profile-no-cir offered-total-cir-four-profile |
Out-of-Profile Octets Dropped |
ood |
|
|
v4-v6 |
V6 Octets Dropped |
v6od |
|
|
out-profile-octets-forwarded-count |
bonding |
Connection 2 Octets Forwarded |
c2of |
|
minimal |
All Octets Forwarded |
aof |
|
|
offered-limited-capped-cir offered-profile-capped-cir offered-profile-cir offered-profile-no-cir offered-total-cir offered-total-cir-exceed offered-four-profile-no-cir offered-total-cir-four-profile |
Out-of-Profile Octets Forwarded |
oof |
|
|
v4-v6 |
V6 Octets Forwarded |
v6of |
|
|
out-profile-octets-offered-count |
bonding |
Connection 2 Octets Offered |
c2oo |
|
minimal offered-total-cir offered-total-cir-exceed offered-total-cir-four-profile |
All Octets Offered |
aoo |
|
|
offered-limited-capped-cir offered-profile-capped-cir offered-profile-cir offered-profile-no-cir offered-four-profile-no-cir |
Out-of-Profile Octets Offered |
ooo |
|
|
v4-v6 |
V6 Octets Offered |
v6oo |
|
|
out-profile-packets-discarded-count |
bonding |
Connection 2 Packets Dropped |
c2pd |
|
minimal |
All Packets Dropped |
apd |
|
|
offered-limited-capped-cir offered-profile-capped-cir offered-profile-cir offered-profile-no-cir offered-total-cir offered-total-cir-exceed offered-four-profile-no-cir offered-total-cir-four-profile |
Out-of-Profile Packets Dropped |
opd |
|
|
v4-v6 |
V6 Packets Dropped |
v6pd |
|
|
out-profile-packets-forwarded-count |
bonding |
Connection 2 Packets Forwarded |
c2pf |
|
minimal |
All Packets Forwarded |
apf |
|
|
offered-limited-capped-cir offered-profile-capped-cir offered-profile-cir offered-profile-no-cir offered-total-cir offered-total-cir-exceed offered-four-profile-no-cir offered-total-cir-four-profile |
Out-of-Profile Packets Forwarded |
opf |
|
|
v4-v6 |
V6 Packets Forwarded |
v6pf |
|
|
out-profile-packets-offered-count |
bonding |
Connection 2 Packets Offered |
c2po |
|
minimal offered-total-cir offered-total-cir-exceed offered-total-cir-four-profile |
All Packets Offered |
apo |
|
|
offered-limited-capped-cir offered-profile-capped-cir offered-profile-cir offered-profile-no-cir offered-four-profile-no-cir |
Out-of-Profile Packets Offered |
opo |
|
|
v4-v6 |
V6 Packets Offered |
v6po |
|
|
uncoloured-octets-offered-count |
bonding minimal offered-four-profile-no-cir offered-limited-capped-cir offered-profile-no-cir offered-total-cir offered-total-cir-exceed offered-total-cir-four-profile v4-v6 |
— |
— |
|
offered-profile-capped-cir offered-profile-cir |
Uncoloured Octets Offered |
uco |
|
|
uncoloured-packets-offered-count |
bonding minimal offered-four-profile-no-cir offered-limited-capped-cir offered-profile-no-cir offered-total-cir offered-total-cir-exceed offered-total-cir-four-profile v4-v6 |
— |
— |
|
offered-profile-capped-cir offered-profile-cir |
Uncoloured Packets Offered |
ucp |
RADIUS accounting in networks using ESM
You can include individual counters in RADIUS accounting messages. Use the commands in the following context to configure custom-record counters for RADIUS accounting messages.
configure subscriber-mgmt radius-accounting-policy custom-recordSee the CLI help or the reference guide for the commands and syntax. This functionality applies to the 7750 SR only.
Significant change only reporting
Another way to decrease accounting messaging related to overhead is to include only ‟active” objects in a periodical reporting. An ‟active object” in this context is an object which has seen a ‟significant” change in corresponding counters. A significant change is defined in terms of a cumulative value (the sum of all reference counters).
This concept is applicable to all methods used for gathering accounting information, such as an XML file and RADIUS, as well as to all applications using accounting, such as service-acct, ESM-acct, and Application Assurance.
Accounting records are reported at the periodical intervals. This periodic reporting is extended with an internal filter which omits periodical updates for objects whose counter change experienced lower changes than a defined (configurable) threshold.
Specific to RADIUS accounting the significant-change command does not affect ACCT-STOP messages. ACCT-STOP messages are always sent, regardless the amount of change of the corresponding host.
For Application Assurance records, a significant change of 1 in any field of a customized record (send a record if any field changed) is supported. When configured, if any statistic field records activity, an accounting record containing all fields is collected.
Immediate completion of records
Record completion for XML accounting
For ESM RADIUS accounting, an accounting stop message is sent when:
A subscriber/subscriber-host is deleted.
An SLA profile instance is changed.
A similar concept is also used for XML accounting. In case the accounted object is deleted or changed, the latest information is written in the XML file with a ‟final” tag indication in the record header. This functionality applies to the 7750 SR only.
AA accounting per forwarding class
This feature allows the operator to report on protocol/application/app-group volume usage per forwarding class by adding a bitmap information representing the observed FC in the XML accounting files. In case the accounted object is deleted or changed, the latest information is written in the XML file with a ‟final” tag indication in the record header.
Configuration notes
This section describes logging configuration restrictions.
A log file policy or log filter policy cannot be deleted if it has been applied to a log.
File policies, syslog policies, or SNMP trap groups must be configured before they can be applied to a log ID.
A file policy can only be assigned to either one event log or one accounting policy.
Accounting policies must be configured in the configure log context before they can be applied to a service SAP or service interface, or applied to a network port.
The SNMP trap ID must be the same as the log ID.
Configuring logging with CLI
This section provides information to configure logging with the command line interface.
Log configuration overview
Configure logging to save information in a log file or direct the messages to other devices. Logging does the following:
Provides you with logging information for monitoring and troubleshooting.
Allows the selection of the types of logging information to be recorded.
Allows the assignment of a severity to the log messages.
Allows the selection of source and target of logging information.
Log types
Logs can be configured in the following contexts:
log file
Log files can contain log event message streams or accounting/billing information. Log file policies are used to direct events, alarms, traps, and debug information to a file on local storage devices (for example, cf2:).
SNMP trap groups
SNMP trap groups contain an IP address and community names which identify targets to send traps following specified events.
syslog
Information can be sent to a syslog host that is capable of receiving selected syslog messages from a network element.
event control
Configures a particular event or all events associated with an application to be generated or suppressed.
event filters
An event filter defines whether to forward or drop an event or trap based on match criteria.
accounting policies
An accounting policy defines the accounting records that will be created. Accounting policies can be applied to one or more service access points (SAPs).
event logs
An event log defines the types of events to be delivered to its associated destination.
event throttling rate
Defines the rate of throttling events.
Basic log configuration
The most basic log configuration must have the following:
log ID or accounting policy ID
log source
log destination
The following example displays a log configuration for the 7750 SR.
MD-CLI
[ex:/configure log]
A:admin@node-2# info
    log-events {
        bgp event sendNotification {
            severity critical
            throttle false
        }
    }
    file "1" {
        description "This is a test file-id."
        compact-flash-location {
            primary cf1
        }
    }
    file "2" {
        description "This is a test log."
        compact-flash-location {
            primary cf1
        }
    }
    log-id "2" {
        source {
            main true
        }
        destination {
            file "2"
        }
    }
    snmp-trap-group "7" {
        trap-target "testTarget" {
            address 11.22.33.44
            version snmpv2c
            notify-community "public"
        }
    }
classic CLI
A:node-2>config>log# info
#------------------------------------------
echo "Log Configuration "
#------------------------------------------
        event-control "bgp" 2005 generate critical
        file-id 1
            description "This is a test file-id."
            location cf1:
        exit
        file-id 2
            description "This is a test log."
            location cf1:
        exit
        snmp-trap-group 7
            trap-target "testTarget" address 11.22.33.44 "snmpv2c" notify-community "public"
        exit
        log-id 2
            from main
            to file 2
        exit
----------------------------------------------
Common configuration tasks
The following sections describe basic system tasks that must be performed.
Configuring an event log
A log file policy contains information used to direct events, alarms, traps, and debug information to a file on a local storage device (for example, cf2:). One or more event sources can be specified. File policies, SNMP trap groups, or syslog policies must be configured before they can be applied to an event log.
Use commands in the following context to configure an event log file.
configure log log-idThe following example shows an event log file configuration.
MD-CLI
[ex:/configure log]
A:admin@node-2# info
    log-id "2" {
        description "This is a test log file."
        filter "1"
        source {
            main true
            security true
        }
        destination {
            file "1"
        }
    }
classic CLI
A:node-2>config>log>log-id# info
----------------------------------------------
...
log-id name "2"
    description "This is a test log file."
    filter 1
    from main security
    to file 1
exit
...
----------------------------------------------
Configuring a log file policy
To create a log file, a file policy is defined, the target CF or USB drive is specified, and the rollover and retention interval period for the log file is defined. The rollover interval is defined in minutes and determines how long a file is used before it is closed and a new log file is created. The retention interval determines how long the file is stored on the CF before it is deleted.
When creating new log files in a compact flash disk card, the minimum amount of free space is the minimum of 10% of Compact Flash disk capacity or 5 Mb (5,242,880 = 5 × 1024 × 1024).
The following example shows a log file configuration.
MD-CLI
ex:/configure log]
A:admin@node-2# info
    file "1" {
        description "This is a log file."
        rollover 600
        retention 24
        compact-flash-location {
            primary cf1
        }
    }
classic CLI
A:ALA-12>config>log# info
------------------------------------------
        file-id name "1"
            description "This is a log file."
            location cf1:
            rollover 600 retention 24
        exit
----------------------------------------------
Configuring an accounting policy
A log file policy must be created to collect the accounting records. The files are stored in system memory of compact flash (cf1: or cf2:) in a compressed (tar) XML format and can be retrieved using FTP or SCP. See Configuring an event log and Configuring a log file policy.
Accounting policies must be configured in the configure log context before they can be applied to a service SAP or service interface, or applied to a network port.
The default accounting policy statement cannot be applied to LDP nor RSVP statistics collection records.
An accounting policy must define a record type and collection interval. Only one record type can be configured per accounting policy.
When creating accounting policies, one service accounting policy and one network accounting policy can be defined as default. If statistics collection is enabled on a SAP or network port and no accounting policy is applied, then the respective default policy is used. If no default policy is defined, then no statistics are collected unless a specifically defined accounting policy is applied.
By default, the subscriber host volume accounting data is based on the 14-byte Ethernet DLC header, 4-byte or 8-byte VLAN Tag (optional), 20-byte IP header, IP payload, and the 4-byte CRC (everything except the preamble and inter-frame gap). See Subscriber host volume accounting data. This default can be altered by the packet-byte-offset configuration option.
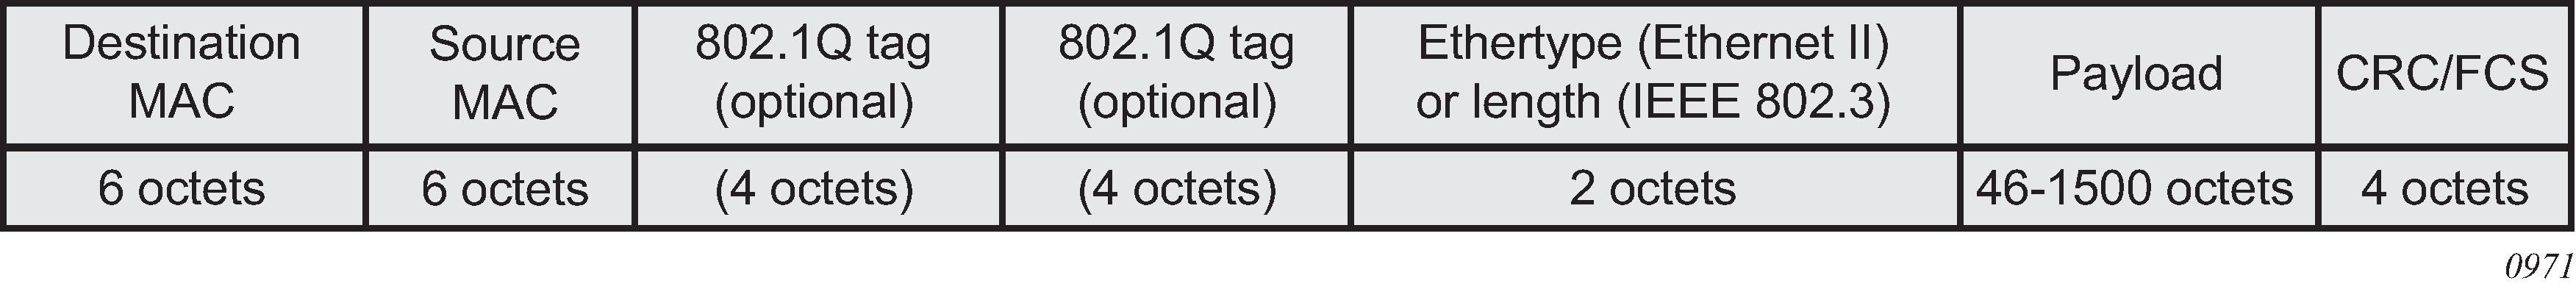
The following example shows an accounting policy configuration.
MD-CLI
[ex:/configure log]
A:admin@node-2# info
    accounting-policy 4 {
        description "This is the default accounting policy."
        default true
        record complete-service-ingress-egress
        destination {
            file "1"
        }
    }
    accounting-policy 5 {
        description "This is a test accounting policy."
        record service-ingress-packets
        destination {
            file "3"
        }
    }
classic CLI
A:node-2>config>log# info
----------------------------------------------
accounting-policy 4
    description "This is the default accounting policy."
    record complete-service-ingress-egress
    default
    to file 1
exit
accounting-policy 5
    description "This is a test accounting policy."
    record service-ingress-packets
    to file 3
exit
----------------------------------------------
Configuring an accounting custom record
The following example shows a custom-record configuration.
MD-CLI
ex:/configure log accounting-policy 1]
A:admin@node-2# info
    custom-record {
        significant-change 20
        queue 1 {
            e-counters {
                in-profile-octets-discarded-count true
                in-profile-octets-forwarded-count true
                out-profile-octets-discarded-count true
                out-profile-octets-forwarded-count true
            }
            i-counters {
                high-octets-discarded-count true
                in-profile-octets-forwarded-count true
                low-octets-discarded-count true
                out-profile-octets-forwarded-count true
            }
        }
        ref-queue {
            all
            e-counters {
                in-profile-packets-forwarded-count true
                out-profile-packets-forwarded-count true
            }
            i-counters {
                in-profile-packets-forwarded-count true
                out-profile-packets-forwarded-count true
            }
        }
    }
The following example shows another custom-record configuration.
[ex:/configure log accounting-policy 1]
A:admin@node-2# info
    custom-record {
        significant-change 1
        aa-specific {
            aa-sub-counters {
                long-duration-flow-count true
                medium-duration-flow-count true
                short-duration-flow-count true
                total-flow-duration true
                total-flows-completed-count true
            }
            from-aa-sub-counters {
                flows-active-count true
                flows-admitted-count true
                flows-denied-count true
                forwarding-class true
                max-throughput-octet-count true
                max-throughput-packet-count true
                max-throughput-timestamp true
                octets-admitted-count true
                octets-denied-count true
                packets-admitted-count true
                packets-denied-count true
            }
            to-aa-sub-counters {
                flows-active-count true
                flows-admitted-count true
                flows-denied-count true
                forwarding-class true
                max-throughput-octet-count true
                max-throughput-packet-count true
                max-throughput-timestamp true
                octets-admitted-count true
                octets-denied-count true
                packets-admitted-count true
                packets-denied-count true
            }
        }
        ref-aa-specific-counter {
            any true
        }
    }
classic CLI
A:node-2>config>log>acct-plcy# info
----------------------------------------------
...
            custom-record
                queue 1
                    i-counters
                        high-octets-discarded-count
                        low-octets-discarded-count
                        in-profile-octets-forwarded-count
                        out-profile-octets-forwarded-count
                    exit
                    e-counters
                        in-profile-octets-forwarded-count
                        in-profile-octets-discarded-count
                        out-profile-octets-forwarded-count
                        out-profile-octets-discarded-count
                    exit
                exit
                significant-change 20
                ref-queue all
                    i-counters
                        in-profile-packets-forwarded-count
                        out-profile-packets-forwarded-count
                    exit
                    e-counters
                        in-profile-packets-forwarded-count
                        out-profile-packets-forwarded-count
                    exit
                exit
...
----------------------------------------------
The following example shows another custom-record configuration.
A:node-2>config>log>acct-policy# info
----------------------------------------------
...
                custom-record
                    aa-specific
                        aa-sub-counters
                            short-duration-flow-count
                            medium-duration-flow-count
                            long-duration-flow-count
                            total-flow-duration
                            total-flows-completed-count
                        exit
                        from-aa-sub-counters
                            flows-admitted-count
                            flows-denied-count
                            flows-active-count
                            packets-admitted-count
                            octets-admitted-count
                            packets-denied-count
                            octets-denied-count
                            max-throughput-octet-count
                            max-throughput-packet-count
                            max-throughput-timestamp
                            forwarding-class
                        exit
                        to-aa-sub-counters
                            flows-admitted-count
                            flows-denied-count
                            flows-active-count
                            packets-admitted-count
                            octets-admitted-count
                            packets-denied-count
                            octets-denied-count
                            max-throughput-octet-count
                            max-throughput-packet-count
                            max-throughput-timestamp
                            forwarding-class
                        exit
                    exit
                    significant-change 1
                    ref-aa-specific-counter any
...
--------------------------------------------------
Configuring event control
The following example shows an event control configuration.
MD-CLI
[ex:/configure log]
A:admin@node-2# info
    log-events {
        ospf event tmnxOspfVirtIfStateChange {
            generate false
            throttle false
        }
        ospf event tmnxOspfVirtNbrStateChange {
            severity cleared
            throttle false
        }
        ospf event tmnxOspfLsdbOverflow {
            severity critical
            throttle false
        }
    }
    throttle-rate {
        limit 500
        interval 10
    }
classic CLI
A:node-2>config>log# info
#------------------------------------------
echo "Log Configuration"
#------------------------------------------
        throttle-rate 500 interval 10
        event-control "oam" 2001 generate throttle
        event-control "ospf" 2001 suppress
        event-control "ospf" 2003 generate cleared
        event-control "ospf" 2014 generate critical
..
----------------------------------------------
Configuring a log filter
The following example shows a log filter configuration.
MD-CLI
[ex:/configure log]
A:admin@node-2# info
    file "1" {
        description "This is our log file."
        rollover 600
        retention 24
        compact-flash-location {
            primary cf1
        }
    }
    filter "1" {
        description "This is a sample filter."
        default-action drop
        named-entry "1" {
            action forward
            match {
                application {
                    eq mirror
                }
                severity {
                    eq critical
                }
            }
        }
    }
    log-id "2" {
        admin-state disable
        description "This is a test log file."
        filter "1"
        source {
            main true
            security true
        }
        destination {
            file "1"
        }
    }
classic CLI
A:node-2>config>log# info
#------------------------------------------
echo "Log Configuration "
#------------------------------------------
        file-id name "1"
            description "This is our log file."
            location cf1:
            rollover 600 retention 24
        exit
        filter name "1"
            default-action drop
            description "This is a sample filter."
            entry 1
                action forward
                match
                    application eq "mirror"
                    severity eq critical
                exit
            exit
        exit
...
        log-id name "2"
            shutdown
            description "This is a test log file."
            filter 1
            from main security
            to file 1
        exit
...
------------------------------------------
Configuring an SNMP trap group
The associated log ID does not have to be configured before a snmp-trap-group can be created, however, the snmp-trap-group must exist before you can configure the log ID to use it.
The following example shows a basic SNMP trap group configuration.
Basic SNMP trap group configuration (MD-CLI)
ex:/configure log]
A:admin@node-2# info
    log-id "2" {
        description "This is a test log file."
        filter "1"
        source {
            main true
            security true
        }
        destination {
            snmp {
            }
        }
    }
SNMP trap group, log, and interface configuration (MD-CLI)
ex:/configure log]
A:admin@node-2# info
    snmp-trap-group "2" {
        trap-target "ops-mon-4" {
            address 10.10.10.104
            version snmpv2c
            notify-community "warnings-12a7"
        }
    }
Basic SNMP trap group configuration (classic CLI)
A:node-2>config>log# info
----------------------------------------------
...
snmp-trap-group 2
    trap-target "ops-mon-4" address 10.10.10.104 snmpv2c notify-community "warnings-12a7"
exit
...
log-id 2
    description "This is a test log file."
    filter 1
    from main security
    to snmp
exit
...
----------------------------------------------
SNMP trap group, log, and interface configuration (classic CLI)
A:node-2>config>log# snmp-trap-group 44
A:node-2>config>log>snmp-trap-group# info
----------------------------------------------
      trap-target "xyz-test" address xx.xx.x.x snmpv2c notify-community "xyztesting"
      trap-target "test2" address xx.xx.xx.x snmpv2c notify-community "xyztesting"
----------------------------------------------
*A:node-2>config>log>log-id# info
----------------------------------------------
      from main
      to snmp
----------------------------------------------
*A:node-2>config>router# interface xyz-test
*A:node-2>config>router>if# info
----------------------------------------------
      address xx.xx.xx.x/24
      port 1/1/1
----------------------------------------------
Setting the replay option
The following example shows the replay option is set by an SNMP SET request for the trap-target address 10.10.10.3, which is bound to the port ID 1/1/1.
MD-CLI
[ex:/configure log snmp-trap-group "44"]
A:admin@node-2# info
    trap-target "test2" {
        address 10.20.20.5
        version snmpv2c
        notify-community "xyztesting"
    }
    trap-target "xyz-test" {
        address 10.10.10.3
        version snmpv2c
        notify-community "xyztesting"
        replay true
    }
classic CLI
A:node-2>config>log>snmp-trap-group 44
A:node-2>config>log>snmp-trap-group# info
----------------------------------------------
trap-target "xyz-test" address 10.10.10.3 snmpv2c notify-community "xyztesting"
replay
trap-target "test2" address 10.20.20.5 snmpv2c notify-community "xyztesting"
----------------------------------------------
Use the following command to display the SNMP trap group log in the configure log snmp-trap-group context.
show log snmp-trap-group 44The following example shows output with the Replay field changed from disabled to enabled.
===============================================================================
SNMP Trap Group 44
===============================================================================
Description : none
-------------------------------------------------------------------------------
Name        : xyz-test
Address     : 10.10.10.3
Port        : 162
Version     : v2c
Community   : xyztesting
Sec. Level  : none
Replay      : enabled
Replay from : n/a
Last replay : never
-------------------------------------------------------------------------------
Name        : test2
Address     : 10.20.20.5
Port        : 162
Version     : v2c
Community   : xyztesting
Sec. Level  : none
Replay      : disabled
Replay from : n/a
Last replay : never
===============================================================================
The following output displays the original log because no events are waiting to be replayed.
===============================================================================
Event Log 44
===============================================================================
SNMP Log contents  [size=100   next event=3819  (wrapped)]

3818 2008/04/22 23:35:39.89 UTC WARNING: SYSTEM #2009 Base IP
"Status of vRtrIfTable: router Base (index 1) interface xyz-test (index 35) changed
administrative state: inService, operational state: inService"

3817 2008/04/22 23:35:39.89 UTC WARNING: SNMP #2005 Base xyz-test
"Interface xyz-test is operational"

3816 2008/04/22 23:35:39.89 UTC WARNING: SNMP #2005 Base 1/1/1
"Interface 1/1/1 is operational"

3815 2008/04/22 23:35:39.71 UTC WARNING: SYSTEM #2009 Base CHASSIS
"Status of Mda 1/1 changed administrative state: inService, operational state:
 inService"

3814 2008/04/22 23:35:38.88 UTC MINOR: CHASSIS #2002 Base Mda 1/2
"Class MDA Module : inserted"

3813 2008/04/22 23:35:38.88 UTC MINOR: CHASSIS #2002 Base Mda 1/1
Disabling the SNMP notification outgoing port
Administratively disabling the port to which a trap-target address is bound removes the route to that trap target from the route table. When the SNMP module receives notification of this event, it marks the trap target as inaccessible and saves the sequence ID of the first SNMP notification that is missed by the trap target.
The following example shows how to disable the port and perform a log event test.
Disable the outgoing port and perform a log event test (MD-CLI)
[ex:/configure]
A:admin@node-2# port 1/1/1 admin-state disable

[ex:/configure]
A:admin@node-2# commit

[ex:/configure]
A:admin@node-2# exit
INFO: CLI #2056: Exiting private configuration mode

[/]
A:admin@ node-2# tools perform log test-event
Disable the outgoing port and perform a log event test (classic CLI)
A:node-2# configure port 1/1/1 shutdown
A:node-2# tools perform log test-event
Use the following command to display the SNMP trap group log.
show log snmp-trap-groupThe following output example shows the Replay from field is updated with the sequence ID of the first event that is replayed when the trap-target address is added back to the route table.
SNMP trap group log
===============================================================================
SNMP Trap Group 44
===============================================================================
Description : none
-------------------------------------------------------------------------------
Name        : xyz-test
Address     : 10.10.10.3
Port        : 162
Version     : v2c
Community   : xyztesting
Sec. Level  : none
Replay      : enabled
Replay from : event #3819
Last replay : never
-------------------------------------------------------------------------------
Name        : test2
Address     : 10.20.20.5
Port        : 162
Version     : v2c
Community   : xyztesting
Sec. Level  : none
Replay      : disabled
Replay from : n/a
Last replay : never
===============================================================================
The following example shows event log output with trap targets that are not accessible and waiting for notification replay as well as the sequence ID of the first notification that is replayed.
SNMP event log
===============================================================================
Event Log 44
===============================================================================
SNMP Log contents  [size=100   next event=3821  (wrapped)]
Cannot send to SNMP target address 10.10.10.3.
Waiting to replay starting from event #3819

3820 2008/04/22 23:41:28.00 UTC INDETERMINATE: LOGGER #2011 Base Event Test
"Test event has been generated with system object identifier tmnxModelSR12Reg.
System description: TiMOS-B-0.0.private both/i386 Nokia 7750 SR Copyright (c)
2000-2016 Nokia. All rights reserved. All use subject to applicable license
agreements. Built on Tue Apr 22 14:41:18 PDT 2008 by test123 in /test123/ws/panos/
main"

3819 2008/04/22 23:41:20.37 UTC WARNING: MC_REDUNDANCY #2022 Base operational state
 of peer chan*
"The MC-Ring operational state of peer 2.2.2.2 changed to outOfService."

3818 2008/04/22 23:35:39.89 UTC WARNING: SYSTEM #2009 Base IP
"Status of vRtrIfTable: router Base (index 1) interface xyz-test (index 35) changed
administrative state: inService, operational state: inService"

3823 2008/04/22 23:41:49.82 UTC WARNING: SNMP #2005 Base xyz-test
"Interface xyz-test is operational"
Re-enabling the in-band port
When you re-enable the in-band port to which a trap-target address is bound, the route to that trap target is re-added to the route table. When the SNMP trap module is notified of this event, it resends the notifications that were missed while there was no route to the trap-target address.
- MD-CLI
configure port admin-state enable tools perform log test-event - classic CLI
configure port no shutdown
tools perform log test-event
Use the following command to display the SNMP trap group log.
show log snmp-trap-group log-id-or-log-nameAfter the notifications are replayed, the Replay from field indicates n/a because there are no more notifications waiting to be replayed and the Last replay field timestamp has been updated.
===============================================================================
SNMP Trap Group 44
===============================================================================
Description : none
-------------------------------------------------------------------------------
Name        : xyz-test
Address     : 10.10.10.3
Port        : 162
Version     : v2c
Community   : xyztesting
Sec. Level  : none
Replay      : enabled
Replay from : n/a
Last replay : 04/22/2008 18:52:36
-------------------------------------------------------------------------------
Name        : test2
Address     : 10.20.20.5
Port        : 162
Version     : v2c
Community   : xyztesting
Sec. Level  : none
Replay      : disabled
Replay from : n/a
Last replay : never
===============================================================================
A display of the event log shows that it is no longer waiting to replay notifications to one or more of its trap target addresses. An event message has been written to the logger that indicates the replay to the trap-target address has happened and displays the notification sequence ID of the first and last replayed notifications.
===============================================================================
Event Log 44
===============================================================================
SNMP Log contents  [size=100   next event=3827  (wrapped)]

3826 2008/04/22 23:42:02.15 UTC MAJOR: LOGGER #2015 Base Log-id 44
"Missed events 3819 to 3825 from Log-id 44 have been resent to SNMP notification
 target address 10.10.10.3."

3825 2008/04/22 23:42:02.15 UTC INDETERMINATE: LOGGER #2011 Base Event Test
"Test event has been generated with system object identifier tmnxModelSR12Reg.
System description: TiMOS-B-0.0.private both/i386 Nokia 7750 SR Copyright (c)
2000-2016 Nokia.
All rights reserved. All use subject to applicable license agreements.
Built on Tue Apr 22 14:41:18 PDT 2008 by test123 in /test123/ws/panos/main"

3824 2008/04/22 23:41:49.82 UTC WARNING: SYSTEM #2009 Base IP
"Status of vRtrIfTable: router Base (index 1) interface xyz-test (index 35) changed
 administrative state: inService, operational state: inService"

3823 2008/04/22 23:41:49.82 UTC WARNING: SNMP #2005 Base xyz-test
"Interface xyz-test is operational"
Configuring a syslog target
A valid syslog ID must exist to send log events to a syslog target host. The following example shows a syslog configuration.
MD-CLI
[ex:/configure log]
A:admin@node-2# info
    syslog "1" {
        description "This is a syslog file."
        address 10.10.10.104
        facility user
        severity warning
    }
classic CLI
A:node-2>config>log# info
----------------------------------------------
...
        syslog "1" name "1"
            description "This is a syslog file."
            address 10.10.10.104
            facility user
            level warning
        exit
...
----------------------------------------------
Modifying a log file
You can modify the configuration of a log file.
MD-CLI
The following example shows a current log-file configuration.
[ex:/configure log]
A:admin@node-2# info
    log-id "2" {
        description "This is a test log file."
        filter "1"
        source {
            main true
            security true
        }
        destination {
            file "1"
        }
    }
The following example shows modifications to the log-file configuration.
[ex:/configure]
A:admin@node-2# log log-id 2

[ex:/configure log log-id "2"]
A:admin@node-2# description "Chassis log file"

[ex:/configure log log-id "2"]
A:admin@node-2# filter 2

[ex:/configure log log-id "2"]
A:admin@node-2# destination file 2

[ex:/configure log log-id "2"]
A:admin@node-2#
The following example shows the modified log-file configuration.
[ex:/configure log]
A:admin@node-2# info
    log-id "2" {
        description "Chassis log file."
        filter "2"
        source {
            security true
        }
        destination {
            file "2"
        }
    }
classic CLI
The following example shows a current log-file configuration.
A:node-2>config>log>log-id# info
----------------------------------------------
...
log-id name "2"
            description "This is a test log file."
            filter 1
            from main security
            to file 1
exit
...
----------------------------------------------
The following example shows the modifications to the log-file configuration.
*A:node-2>config# log
*A:node-2>config>log# log-id 2
*A:node-2>config>log>log-id# description "Chassis log file."
*A:node-2>config>log>log-id# filter 2
*A:node-2>config>log>log-id# from security
*A:node-2>config>log>log-id# exit
The following example shows the modified log-file configuration.
A:node-2>config>log# info
----------------------------------------------
...
log-id name "2"
            description "Chassis log file."
            filter 2
            from security
            to file 1
exit
...
----------------------------------------------
Deleting a log file
Use the following command to delete a log file:
- MD-CLI
It is not necessary to disable the log ID before you delete it. Also, you can use the delete command in any context.
delete - classic CLI
You must shutdown the log ID before you delete it.
configure log log-id shutdown
configure log no log-id 2
The following example shows how to delete a log file.
MD-CLI
[ex:/configure log log-id "2"]
A:admin@node-2# info
    description "filter "1001"
    destination {
        file "50"
    }

[ex:/configure log]
A:admin@node-2# delete log-id 2
classic CLI
A:node-2>config>log# info
----------------------------------------------
file-id name "1"
            description "LocationTest."
            location cf1:
            rollover 600 retention 24
        exit
...
log-id name "2"
            description "Chassis log file."
            filter 2
            from security
            to file 1
exit
...
A:node-2>config>log#
	A:node-2>config>log# log-id 2
	A:node-2>config>log>log-id# shutdown
	A:node-2>config>log>log-id# exit
	A:node-2>config>log# no log-id 2
Modifying a log file ID
You can modify the configuration of the log file ID.
MD-CLI
The following example shows the current log-file configuration.
[ex:/configure log]
A:admin@node-2# info
    file "1" {
        description "This is a log file."
        rollover 600
        retention 24
        compact-flash-location {
            primary cf1
        }
    }
The following example shows the modified log-file configuration.
[ex:/configure log]
A:admin@node-2# info
    file "1" {
        description "LocationTest."
        rollover 2880
        retention 500
        compact-flash-location {
            primary cf2
        }
    }
classic CLI
The following example shows the current log-file configuration.
A:node-2>config>log# info
------------------------------------------
        file-id name "1"
            description "This is a log file."
            location cf1:
            rollover 600 retention 24
        exit
----------------------------------------------
The following example shows modifications to the log-file configuration.
A:node-2>config>log# file-id 1
A:node-2>config>log>file-id# description "LocationTest."
A:node-2>config>log>file-id# location cf2:
A:node-2>config>log>file-id# rollover 2880 retention 500
A:node-2>config>log>file-id# exit
The following example shows the modified log-file configuration.
A:node-2>config>log# info
----------------------------------------------
...
file-id name "1"
    description "LocationTest."
    location cf2:
    rollover 2880 retention 500
exit
...
---------------------------------------------
Modifying a syslog ID
The following example shows how to modify the syslog ID.
MD CLI
The following example shows modifications to the syslog 1 configuration.
[ex:/configure]
*A:admin@node-2# log syslog 1

[ex:/configure log syslog "1"]
*A:admin@node-2# description "Test syslog"

[ex:/configure log syslog "1"]
*A:admin@node-2# address 10.10.0.91

[ex:/configure log syslog "1"]
*A:admin@node-2# facility mail

[ex:/configure log syslog "1"]
*A:admin@node-2# severity info
[ex:/configure log syslog "1"]
The following example shows the modified syslog 1 configuration.
[ex:/configure log syslog]
A:admin@node-2# info
...
    syslog "1" {
        description "Test syslog"
        address 10.10.0.91
        facility mail
        severity info
        }
    }
classic CLI
The following example shows modifications to the syslog 1 configuration.
*A:node-2>config>log#
*A:node-2>config>log# syslog 1
*A:node-2>config>log>syslog$ description "Test syslog."
*A:node-2>config>log>syslog# address 10.10.0.91
*A:node-2>config>log>syslog# facility mail
*A:node-2>config>log>syslog# level info
The following example shows the modified syslog 1 configuration.
A:node-2>config>log# info
----------------------------------------------
...
        syslog name "1"
            description "Test syslog."
            address 10.10.10.91
            facility mail
            level info
        exit
...
----------------------------------------------
Deleting an SNMP trap group
Use the following commands to delete SNMP trap groups:
- MD-CLI
configure log snmp-trap-group delete trap-target configure log delete snmp-trap-group - classic
CLI
configure log snmp-trap-group no trap-target
configure log no snmp-trap-group
classic CLI
The following example shows an SNMP trap group configuration.
A:node-2>config>log# info
----------------------------------------------
...
       snmp-trap-group name "10"
           trap-target "ops-mon-4" address 10.10.10.104 snmpv2c notify-community "warnings-12a7"
       exit
...
----------------------------------------------
The following example shows deleting the trap target and SNMP trap group.
A:node-2>config>log# snmp-trap-group
    A:node-2>config>log>snmp-trap-group# no trap-target ops-mon-4
    A:node-2>config>log>snmp-trap-group# exit
    A:node-2>config>log# no snmp-trap-group 10
Modifying a log filter
You can modify the configuration of a log filter.
MD- CLI
The following example shows a log filter configuration.
[ex:/configure log]
A:admin@node-2# info
...
    filter "1" {
        description "This is a sample filter with default action drop."
        default-action drop
        }
    }
...
The following example shows the modifications applied to the log filter configuration.
[ex:/configure]
A:admin@node-2# log filter 1

[ex:/configure log filter "1"]
A:admin@node-2# description "This filter allows forwarding"

[ex:/configure log filter "1"]
A:admin@node-2# default-action forward

A:admin@node-2#
The following example shows the modified log filter configuration.
A:node-2>config>log>filter# info
----------------------------------------
...
        filter name "1"
            description "This filter allows forwarding"
             default-action forward
            exit
        exit
...
----------------------------------------
classic CLI
The following example shows a log filter configuration.
A:node-2>config>log# info
#------------------------------------------
echo "Log Configuration "
#------------------------------------------
...
        filter name "1"
            default-action drop
            description "This is a sample filter."
            entry 1
                action forward
                match
                    application eq "mirror"
                    severity eq critical
                exit
            exit
        exit
...
------------------------------------------
The following example shows the modifications applied to the log filter configuration.
A:node-2>config# log
*A:node-2>config>log# filter 1
*A:node-2>config>log>filter# description "This allows <n>."
*A:node-2>config>log>filter# default-action forward
*A:node-2>config>log>filter# entry 1
*A:node-2>config>log>filter>entry$ action drop
*A:node-2>config>log>filter>entry# match
*A:node-2>config>log>filter>entry>match# application eq user
*A:node-2>config>log>filter>entry>match# number eq 2001
*A:node-2>config>log>filter>entry>match# no severity
*A:node-2>config>log>filter>entry>match# exit
The following example shows the modified log filter configuration.
A:node-2>config>log>filter# info
----------------------------------------
...
        filter name "1"
            description "This allows <n>."
            entry 1
                action drop
                match
                    application eq "user"
                    number eq 2001
                exit
            exit
        exit
...
----------------------------------------
Modifying event control configuration
You can modify the current event control configuration.
MD-CLI
The following example shows a current event control configuration.
[ex:/configure log]
A:admin@node-2# info
    log-events {
        bgp event tmnxOspfVirtIfStateChange {
            generate false
            throttle false
        }
        ospf event tmnxOspfVirtNbrStateChange {
            severity cleared
            throttle false
        }
        ospf event tmnxOspfLsdbOverflow {
            severity critical
            throttle false
        }
    }
    throttle-rate {
        limit 500
        interval 10
    }
The following example shows a modification to the event control configuration.
[ex:/configure log]
*A:admin@node-2# log-events bgp 2014 suppress
The following example shows the modified event control configuration.
ex:/configure log]
*A:admin@node-2# event-control ospf 2014 suppress
classic CLI
The following example shows a current event control configuration.
A:node-2>config>log# info
----------------------------------------------
...
event-control "bgp" 2014 generate critical
...
----------------------------------------------
The following example shows a modification to the event control configuration.
*A:node-2>config# log
*A:node-2>config>log# event-control bgp 2014 suppress
The following example shows the modified event control configuration.
*A:node-2>:config# log
*A:node-2>config>log# event-control ospf 2014 suppress
Returning to the default event control configuration
Use the following command to delete modified log event options and return them to the default values:
- MD-CLI
configure log log-events delete event option - classic
CLI
configure log no event-control application [event-name | event-number]
The following example shows the command usage.
MD-CLI
[ex:/configure log log-events]
A:admin@node-2# delete snmp event authenticationFailure
classic CLI
A:node-2>config>log# no event-control "bgp" 2001