Visualization
The visualization feature enables you to visualize the data stored in Intelligent Data Store. Grafana is used as the visualization engine. This allows an enterprise to have their own dashboard thereby enabling them to manage the dashboards, users, and so on for each enterprise independently.
IMPACT IoT also supports visualization of the billing records. Billing records are generated in CSV format and these records are ingested by IDS. The billing data is made accessible over APIs. These APIs can be used to visualize the billing records.
Grafana plugins
The following Grafana plugins are used to access the Intelligent Data Store APIs and render dashboards, respectively:
- Infinity plugin for Grafana | Grafana Labs - A data source plugin that helps to access Intelligent Data Store APIs.
- Dynamic text plugin for Grafana | Grafana Labs - A plugin to render dynamic text using HTML or markdown.
- https://grafana.com/grafana/plugins/briangann-datatable-panel - A table plugin which support for search, pagination and so on.
- https://grafana.com/grafana/plugins/briangann-gauge-panel/ - A plugin for gauge for metering.
Accessing the Grafana Console
In the browser address bar, type the URL of the server to access the Grafana console: http(s)://hostname/grafana
where,
http or https is as the platform is configured.
hostname is the ingress name of Grafana as configured in cpro-grafana:ingress:hosts in the values.yaml file.
Logging in to Grafana
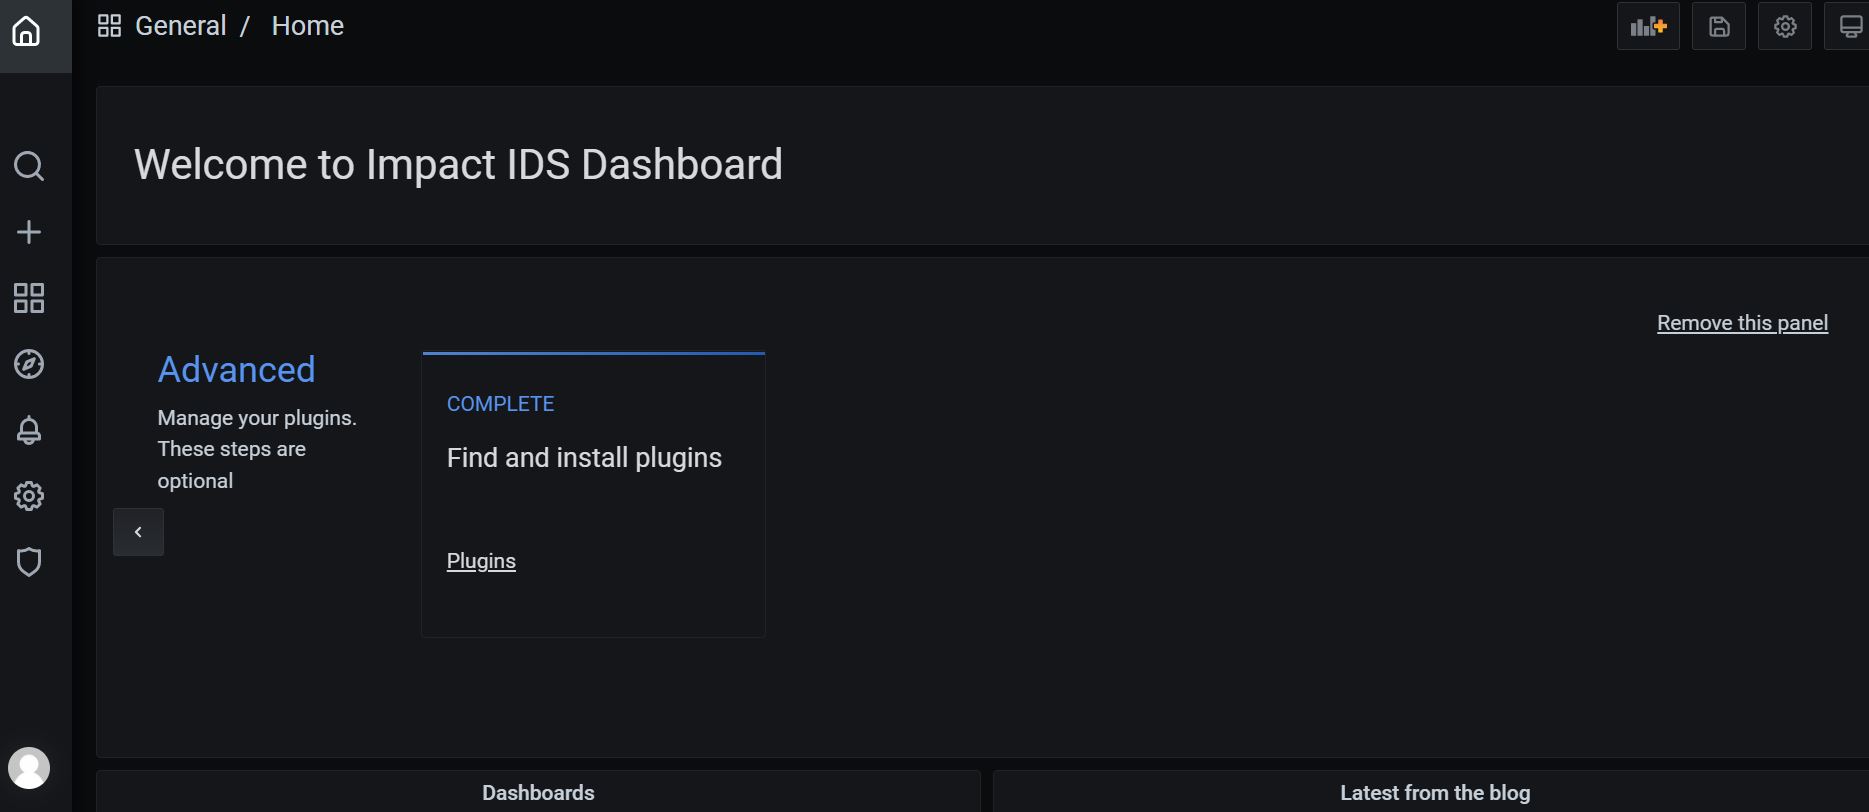
During Enterprise provisioning, IMPACT IoT creates one user with Admin role privileges in Grafana for the provisioned Enterprise. You can login to Grafana using this user credentials and create more users with appropriate roles as necessary. Logging in to Grafana opens up the Grafana Home page.

Configuring the Intelligent Data Store Data API access credentials
Intelligent Data Store Data APIs require authentication for access and this must be configured manually in the Grafana dashboards to access the Data APIs to fetch the data.
Perform the following steps to configure the Intelligent Data Store Data API access credentials:
- Login to Grafana with the user provisioned during enterprise creation.
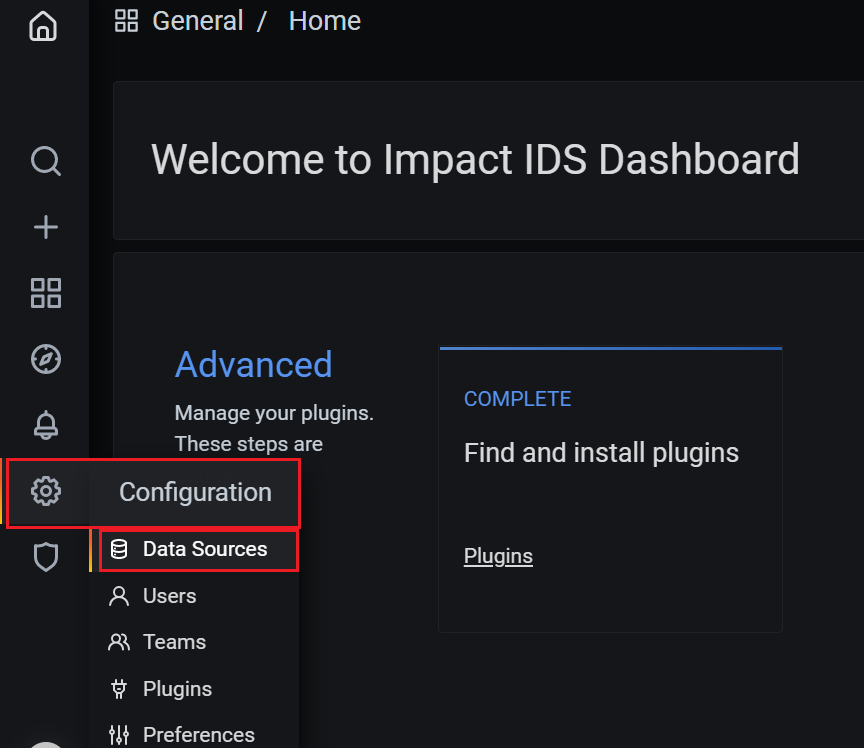
- Navigate to Data Sources.
Figure 2. Grafana Data Sources 
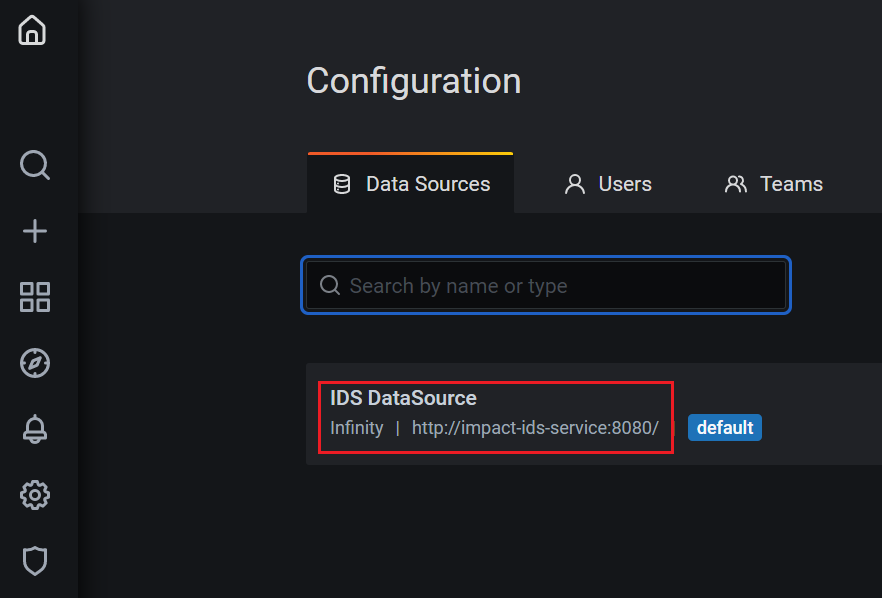
- Click the name of the IDS DataSource to edit the Data Source.
Figure 3. IDS DataSource 
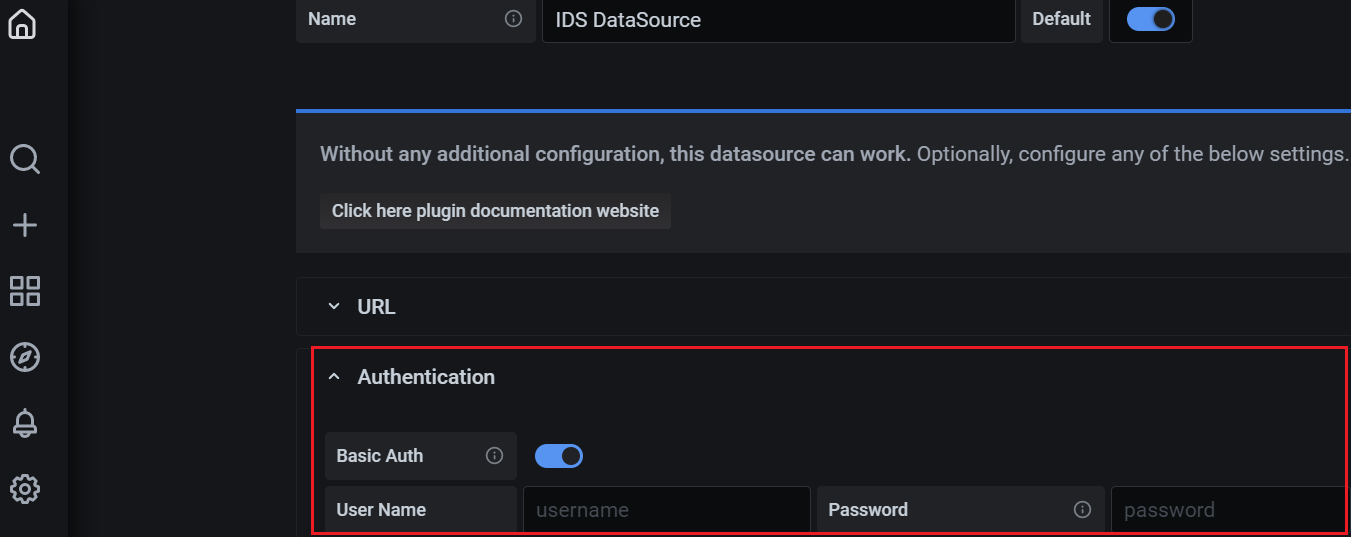
- Set the User name and Password of
the IMPACT IoT tenant under the
Authentication section. This user should belong to
the same enterprise and possess the IDS-User and
IDS-RuleManage permissions.
Figure 4. Setting up User Name and Password 
Note: During Data Source saving care must be taken to ensure that the credentials and permissions are valid.