Application Assurance — Best Practices for ISA and Host IOM Overload Protection
This chapter provides information about Application Assurance best practices for ISA and host IOM overload protection.
Topics in this chapter include:
Applicability
The information and configuration in this chapter is based on SR OS Release 12.0.R4.
Overview
The multiservice integrated services adapter (MS-ISA) is a processing resource module installed on an ISA host IOM. This example describes the best practices for configuration and monitoring of the system to ensure proper engineering of the system resources involved in AA ISA capacity planning.
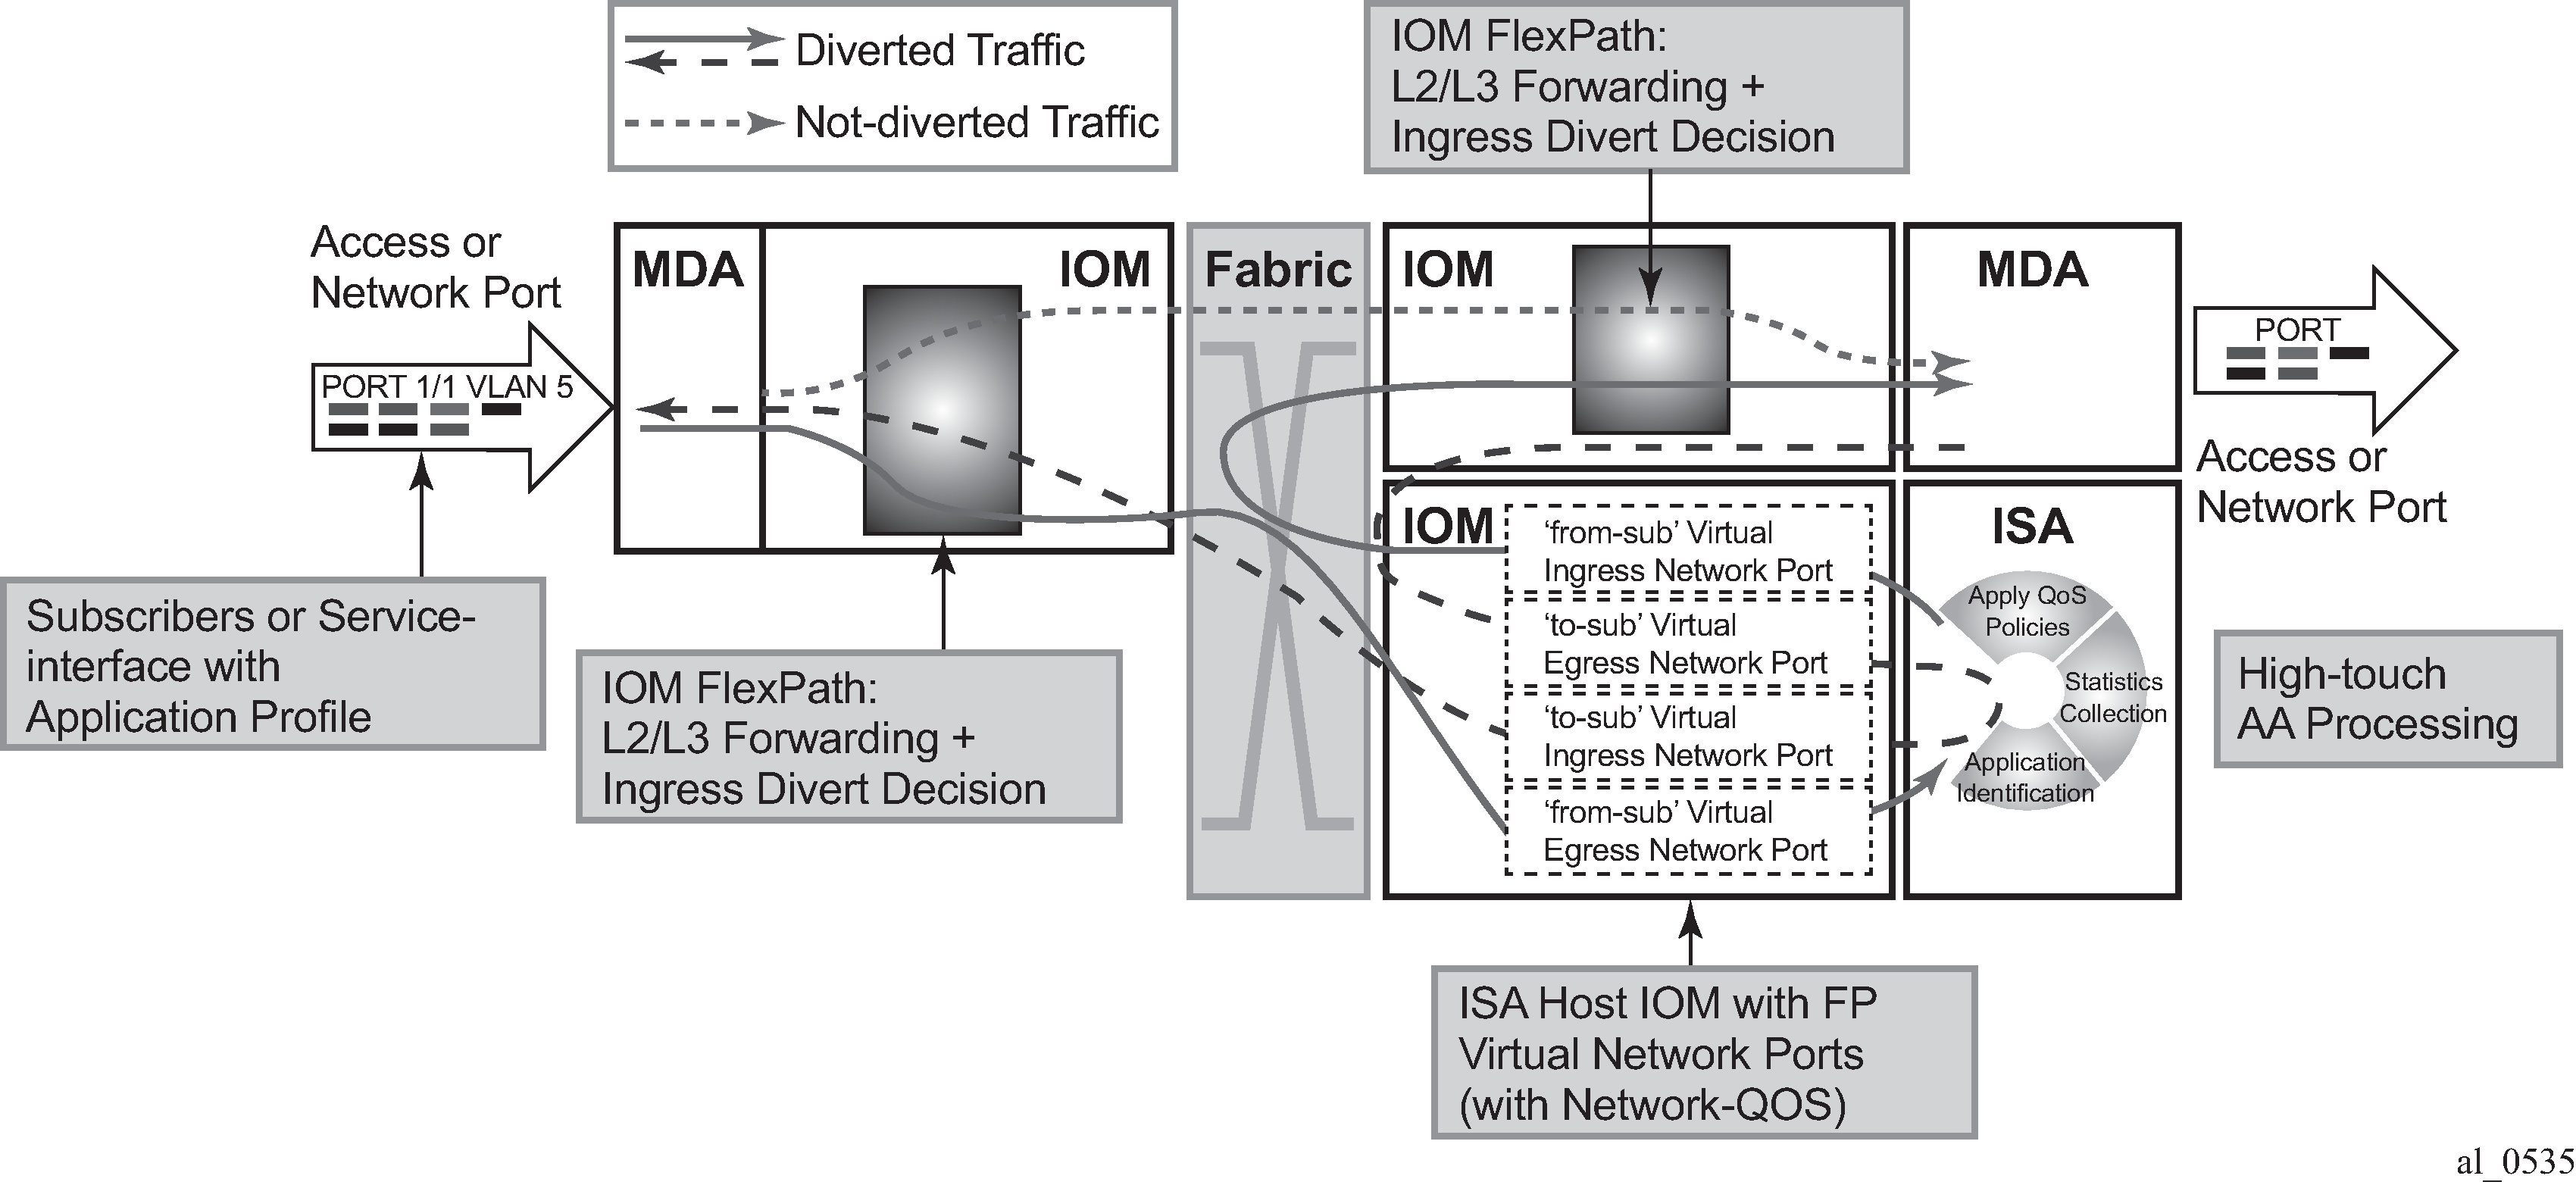
As shown in System packet datapath to AA ISA, traffic is diverted to an AA ISA by provisioning of an application profile (app-profile) for a subscriber or SAP service context. SR OS then automatically handles traffic diversion for both directions of traffic for that AA subscriber context, through one of the AA ISAs in the AA group where that app-profile is defined.
The following elements in the SR OS node must be properly engineered for any given AA deployment. Each element is described in this section:
ISA capacity cost and load balancing across ISAs.
ISA host IOM network egress QoS. Host IOM egress network ports weighted-average shared buffer pool thresholds (within the egress QoS configuration for each group) are used for overload cut-through processing.
ISA resources and statistics collection.
Flows
Traffic volume (bandwidth)
Subscribers
Flow setup rate
ISA overload cut-through
ISA default subscriber policies
ISA capacity planning approach
This example illustrates an approach to the configuration of the AA system to address these considerations:
IOM/ISA-AA network egress QoS configuration should be designed to treat the ISA as a network port with normal network port maximum delay (by MBS).
Within the ISA, fair access to the ISA-AA bandwidth and flow resources must be ensured: it is recommended that default application QoS policy (AQP) policy entries be configured limiting bandwidth and flow resources per AA subscriber.
Thresholds for SNMP alerts that indicate a high load on ISA processing should be configured: capacity cost, flow, bandwidth.
Capacity tracking in live deployments should be performed for parameters that can affect overload: flow setup rate, bandwidth, and subscriber-count per ISA.
Use of other scale related consumable AA resources against system maximum limits. This includes parameters such as statistics records, transit-ip table entries, and transit-prefix TCAM entries, which should be planned and periodically tracked. These limits will not affect overload of the ISA but may affect intended service operation.
For recommendations of the specific parameters to watch in a given deployment as well as the values of the system limits for a given release, contact your regional support organization.
AA overload and resource monitoring
Overload is a condition where the total packet processing requirements for traffic arriving on a given ISA exceeds the available resources, resulting in the host IOM egress buffers reaching a configured ‟overload” threshold. Above this threshold, the ISA can be configured to forward excess traffic (called overload cut-through). If cut-through is not enabled and the overload condition continues, the egress queue MBS threshold will eventually be reached, after which packets will be discarded. Even if overload cut-through is enabled, any egress traffic that exceeds the maximum bus capacity of the ISA queue discard threshold will be discarded.
ISA capacity overload events are supported within the system resource monitoring and logging capabilities if the traffic and resource load crosses any of the following high and low load thresholds on a per-ISA basis. Exceeding one of these thresholds does not in itself indicate an overload state.
Host IOM egress network ports weighted-average shared buffer pool thresholds (within the egress QoS configuration for each AA group) are used for triggering and removing overload cut-through processing. Care should be taken in the configuration of these buffers, as the IOM flexpath has significant buffer capacity that can result in latency larger than the network SLA acceptable guidelines. A properly engineered configuration will have large enough buffering to not trigger ISA overload unnecessarily (due to normal bursts with a reasonable traffic load) but will not incur excessive latency prior to triggering the overload state.
ISA capacity cost: if the capacity cost of all subscribers on the ISA exceeds a threshold, an event is raised but the overload condition is not set (unless other resources are exhausted). ISA overload or traffic cut-through does not occur simply if capacity cost is exceeded. It is used to capacity plan an intended load for the ISA, proportional to resource use per subscriber, in order to generate events prior to overload to allow appropriate action to mitigate the resource consumption (such as provisioning more ISAs).
Flow table consumption (number of allocated flow resources in use): the flow table high-watermark threshold warnings are for proactive notification of a high load. The ISA will cut-through new flows when the ‟flow resources in use” is at the maximum flow limit. Reaching the flow limit does not generate backpressure to the IOM, nor is the ISA considered in an overload state. Flow usage thresholds are different from bit-rate/packet-rate/flow-setup-rate thresholds in that when the flow table high-watermark threshold is exceeded, the ISA will no longer be operating as application-aware for the flows with no context. The default subscriber policy is applied to traffic that required a flow record but was unable to allocate one, which is a similar behavior to overload cut-through.
The following terms are used to describe flow resources:
Maximum flows: the maximum AA flow table size for a given release.
Flows: on the show screens, the ‟flows” field is an indication of the number of unique 5-tuple entries in the flow table. This includes active and inactive flows; inactive will age out of the table after a period of inactivity that is dependent on the protocol used.
Active flows: the number of flows with traffic in the current reporting interval.
Flow resources in use: the number of allocated flows in the flow table. This number is greater than the number of active flows, reflecting inactive flows and flows pre-allocated for some dynamic protocols (control + data channels) and for some UDP traffic.
Traffic volume: traffic rate in bytes/sec and packets/sec is the dominant cause of ISA overload in most network scenarios, when the ISA is presented with more traffic than it can process. This results in the ISA internal ingress buffers reaching a threshold that causes backpressure to the IOM egress queues (toward the ISA), allowing the ISA to process the packets it already has. This internal backpressure mechanism is normal behavior, allowing burst tolerance at the IOM-to-ISA interface; thus backpressure is not in itself an indication of overload. Overload occurs when the bursts or the load of traffic is sustained long enough to reach the ISA host IOM network port egress weighted-average shared buffer threshold. The actual amount of traffic that can be passed through an ISA is dependent on the application traffic mix, flow density, and AA policy configurations and will vary by network type and by region. The bit-rate and packet-rate watermarks can be used to provide event notification when the traffic rates exceed planning expectations.
Flow setup rate: this is generally proportional to total traffic volume, and as such can be a factor in ISA overload. The flow setup rate is the rate at which new flows are presented to the ISA, each resulting in additional tasks that are specific to flow state creation; thus the ISA has a sensitivity to flow setup rates as fewer cycles are available for other datapath tasks when the flow setup rate is high. In residential networks, flow setup rates of 3 k to 5 k flows/sec per Gbps of traffic are common. The flow setup watermarks can be used to provide event notification when the rate exceeds planning expectations.
ISA Overload Models
For an ISA overload strategy, there are two design options for configuring the overload behavior of the system:
Host IOM egress discards: in this model, the philosophy is to treat AA packet processing resources in the same way as a network interface (of somewhat variable capacity depending on the traffic characteristics). When too much traffic is presented to the ISA, it backpressures the host IOM egress, which will buffer packets. If the egress buffer thresholds are exceeded, the ISA will discard according to the egress QoS slope policy. This is configured by not enabling isa-overload-cut-through and use of appropriate egress QoS policies. Firewall or session filter deployments may use this model.
Overload cut-through: the ISA group can be enabled to cut-through some traffic if an overload event occurs, triggered when the IOM network port weighted-average queues depth exceeds the weighted-average shared high-watermark threshold. In this ISA state, some packets are cut-through from application analysis but retain subscriber context with the default subscriber policy applied. This mode of deployment is intended for situations where it is preferable to forward packets even if not identified by AA than to drop/discard the packet. For example, if AA is providing value-added services (VAS) such as In-Browser Notification (IBN), analytics, or traffic rate limiting, this would usually be the preferred model as the underlying service should be preserved even if capacity to provide the VAS is not available.
Note that even with overload cut-through enabled, there is a hardware-based maximum ISA throughput of approximately 11 Gbps for MS-ISA and 40 Gbps for MS-ISA2. If this is exceeded on a sustained basis, IOM egress discards may still occur.
Understanding Packet and Protocol Cut-Through
Traffic can be cut-through the ISA-AA card on a packet-by-packet basis, in which case packets do not go through AA identification and subscriber application policy. The conditions that trigger cut-through include:
Overload (IOM egress network port weighted-average shared buffer threshold): excess traffic bypasses all AA processing except for the default subscriber policy
Non-conformant IP packet: traffic bypasses all AA processing except IP protocol checks and the default subscriber policy. Optionally, these packets can be discarded in AA.
Flow table full: for new 5-tuples sent to the ISA, if the flow table is full, the packets are cut-through the ISA and only the default subscriber policy is applied.
The default subscriber policy is a set of AQP rules that apply AQP match criteria limited to Application Service Options (ASO), aa-sub, and traffic-direction starting with the first packet of a flow, with no match conditions based on AA identification (application, app-group, charging-group, IP header). Packets will be either denied_by_default_policy or cut_through_by_default_policy, depending on the policer action configuration in the AQP rules.
For cut-through traffic, no flow records exist but it is counted under per-subscriber protocol statistics as one of the following counters, depending on the case:
cut_through — Statistics for any packet that could not map to a flow, but that has a valid subscriber ID. This can be an error packet, fragmented out-of-order, no flow resource, invalid TCP flags, etc. This is the most important count for indicating overload cut-through, as it counts all traffic in overload cut-through mode (when the weighted-average threshold has been crossed).
denied_by_default_policy — Packets that are dropped due to a default policy with a flow-based policer (flow rate or flow count) with action discard.
cut_through_by_default_policy — Packets that failed to pass flow-based policers with an action of priority-mark.
An example of overload cut-through statistics in the CLI is shown below:
A:BNG# show application-assurance group 1 protocol count
===============================================================================
Application-Assurance Protocol Statistics
===============================================================================
Protocol                         Disc          Octets       Packets      Flows
-------------------------------------------------------------------------------
advanced_direct_connect            0%               0             0          0
aim                                0%               0             0          0
amazon_video                       0%               0             0          0
ares                               0%               0             0          0
bbm                                0%               0             0          0
betamax_voip                       0%               0             0          0
bgp                                0%               0             0          0
bittorrent                         0%       678428534       5322929    1036129
cccam                              0%               0             0          0
citrix_ica                         0%               0             0          0
citrix_ima                         0%               0             0          0
cnnlive                            0%               0             0          0
cups                               0%               0             0          0
cut_through                        0%      5299435739      10603771          0
cut_through_by_default_policy      0%               0             0          0
cvs                                0%               0             0          0
daap                               0%               0             0          0
dcerpc                             0%               0             0          0
denied_by_default_policy           0%               0             0          0
Configuration
This example illustrates a typical configuration of an SR OS node for AA for each of the configuration topics.
AA traffic load test environment
Application assurance identifies every byte and every packet of hundreds of real-world applications using per-flow stateful analysis techniques. It is a challenge to find test equipment that can accurately emulate full scale (10 Gbps to 40 Gbps) with traffic mixes and flow behaviors representing hundreds of thousands of end users with application clients across a range of devices. Some specialized stateful test equipment can emulate large traffic rates, but even the best will have equipment-specific patterns and behaviors not representative of live traffic. Therefore, the best scenario to engineer the AA overload configuration is by iteration in live deployments: setting an initial target and modifying the configuration based on ISA performance under load.
For a lab test of ISA throughput and loading, Nokia uses stateful test equipment which supports emulation of various service provider traffic mix profiles suitable for generating overload conditions; however, it is outside the scope of this document to configure AA throughput tests.
The operator should be aware that use of unrealistic, non-stateful traffic generators can result in a high level of unknown traffic, with the ISA performance impacted by continually trying to identify large numbers of packets of no real application type. This, combined with cut-through for invalid IP packets, can result in ISA overload and traffic cut-through (due to overload or invalid IP packets) at traffic levels not representative of actual ISA performance on real traffic.
ISA capacity cost and load balancing across ISAs
These AA group-level commands define the load balancing parameters within an ISA group.
*A:BNG# configure isa
    application-assurance-group 1 aa-sub-scale residential create
        no description
        no fail-to-open
        isa-capacity-cost-high-threshold 304000
        isa-capacity-cost-low-threshold 272000
        partitions
        divert-fc be
        no shutdown
    exit
The following should be noted related to this configuration:
Up to 7 primary and 1 backup ISAs are allowed. If the AA services are considered ‟value added” and not part of a paid service, backups are usually not used because the ‟fail to fabric” capability keeps the underlying service running.
The default behavior in case of ISA failure is ‟no fail-to-open”, which means ‟fail-to-wire”; if an ISA fails, traffic is forwarded as if no divert was configured
Threshold for sending capacity-cost SNMP traps: the unit used for capacity cost is a variable defined in the network design; in this example, it is expressed in Mbps of the subscriber total BW UP+DOWN with a high watermark set to 7600 Mbps × 40 = 304000 (where 40 is an oversubscription ratio). The low watermark is equal to 6800 Mbps × 40 = 272000.
Partitions should always be enabled to configure additional policies in the future (for example, wifi/business)
divert-fc configuration applies to the AA group: in this example, FC BE Internet is the only diverted FC; this is typical for AA residential and WLan-GW deployments. For VPN services, typically all datapath FCs are diverted to AA.
ISA-AA host IOM - network egress shared memory and QoS
The amount of shared memory allocated per port, along with the network port egress QoS policy, determine the maximum delay for traffic diverted to Application Assurance.
This maximum network port delay is typically determined by the operator and must be used to define the proper QoS configuration to apply to the ISA-AA ports; this QoS configuration may be the same (typically) as what is applied to regular network ports on the SR OS node.
On the line cards there is shared network egress memory per ISA-AA port, with the ISA-AA is represented by two network ports on the host IOM:
‟from-sub”: for traffic sent from the subscriber to the network
‟to-sub”: for traffic sent from the network to the subscriber
configure isa application-assurance-group 1
            qos
                egress
                    from-subscriber
                        pool
                            slope-policy "default"
                            resv-cbs default
                        exit
                        queue-policy "network-facing-egress"
                        port-scheduler-policy "network-facing"
                    exit
                    to-subscriber
                        pool
                            slope-policy "default"
                            resv-cbs default
                        exit
                        queue-policy "network-facing-egress"
                        port-scheduler-policy "network-facing"
                    exit
            exit
            no shutdown
The amount of shared memory reserved for each egress network port is determined by the speed of the port (10 Gbps for MS-ISA and 40 Gbps for MS-ISA2) and the egr-percentage-of-rate ratio configuration.
MS-ISA uses by default 1000% and 500% of the rate respectively for to-sub and from-sub ports, while MS-ISA2 uses by default 100% for both to-sub and from-sub ports.
It is typically recommended that these values be adjusted when MS-ISA and a high-speed Ethernet MDA are mixed on the same IOM, because in this context the amount of shared memory allocated to the Ethernet MDA should be increased by reducing the MS-ISA network ports memory allocation ratio. If two MS-ISAs are installed on the same IOM, the system will by default allocate 50% of the network egress shared memory to each ISA. In addition, an operator may adjust these values in case the actual network-to-subscriber versus subscriber-to-network ratio is significantly different in the production network, in order to achieve the expected maximum tolerated network delay.
The operator can modify the egr-percentage-of-rate per port using the following command:
A:BNG# configure port 1/2/fm-sub
A:BNG>config>port# info detail
----------------------------------------------
        modify-buffer-allocation-rate
            egr-percentage-of-rate 500
        exit
----------------------------------------------
A:BNG# configure port 1/2/to-sub
A:BNG>config>port# info detail
----------------------------------------------
        modify-buffer-allocation-rate
            egr-percentage-of-rate 1000
        exit
Network egress scheduling/queuing priority is for all ISAs within a group defined at the AA ISA group level
An example below with ISA-AA and 2 x 10G Eth MDA:
7750# configure port <slot>/<isa-aa-mda>/fm-sub
    modify-buffer-allocation-rate
        egr-percentage-of-rate 65

7750# configure port <slot>/<isa-aa-mda>/to-sub
    modify-buffer-allocation-rate
        egr-percentage-of-rate 130
In this example, the configuration defines:
from-sub — Approximately 190 msec worth of buffer at 2500 Mbps.
to-sub— Approximately 190 msec worth of buffer at 5000 Mbps.
The buffer can be further refined from the network QoS policy.
For MS-ISA2, each MS-ISM flexpath will default the buffer allocation rate to 100%, which is a suitable value assuming that both modules in a slot are MS-ISA2 (which is the MS-ISM configuration), or that the I/O module has a similar traffic rate as the MS-ISA2 (which is also the case in the 10x10GE and 1x100GE versions of the MS-ISA2 line cards).
Configuring ISA resources and stats collection
The following are the key consumable resources in an AA ISA:
Flows
Bandwidth
Subscribers
Flow setup rate
The AA group should be configured with watermark thresholds where each ISA will generate SNMP events when resources reach this level.
Per-ISA-card resource usage watermarks trigger SNMP traps to the management system (5620 SAM)
The values defined below can be refined based on the network characteristics in term of flows and bandwidth per ISA after the initial deployment
7750# configure application-assurance
----------------------------------------------
        flow-table-low-wmark 90
        flow-table-high-wmark 95
        flow-setup-high-wmark 66500
        flow-setup-low-wmark 63000
        bit-rate-high-wmark 7600
        bit-rate-low-wmark 6800
In this example, the usage SNMP watermarks are configured for:
Flow table: 95%/90% (maximum 4M flows on MS-ISA)
Flow setup rate: configured to 95%/90% (of maximum 70k fps on MS-ISA)
Bit rate/total diverted throughput
The show app-assure group status detail command is used to display basic ISA health status:
# aa-sub, active aa-sub, bitrate, flows in use, flow setup rate
statistics for all ISAs combined or per ISA
A:BNG# show application-assurance group 1 status detail
  ===============================================================================
  Application-Assurance Status
  ===============================================================================
  Last time change affecting status : 05/30/2014 17:18:34
  Number of Active ISAs             : 4
  Flows                             : 214007945881
  Flow Resources In Use             : 2955164
  AA Subs Created                   : 70567
  AA Subs Deleted                   : 10544
  AA Subs Modified                  : 0
  Seen IP Requests Sent             : 0
  Seen IP Requests Dropped          : 0
  -------------------------------------------------------------------------------
                                      Current    Average    Peak
  -------------------------------------------------------------------------------
  Active Flows                      : 2911508    2769454    4582522
  Flow Setup Rate (per second)      : 33923      29400      67865
  Traffic Rate (Mbps)               : 7620       7238       22628
  Packet Rate (per second)          : 1254138    1182571    3044376
  AA-Subs Downloaded                : 69887      66129      70567
  Active Subs                       : 23131      19737      38114
  -------------------------------------------------------------------------------
                                      Packets               Octets
  -------------------------------------------------------------------------------
  Diverted traffic                  : 7437950197613         5530634242355947
  Diverted discards                 : 0                     0
      Congestion                    : 0                     0
      Errors                        : 0                     N/A
  Entered ISA-AAs                   : 7437950180191         5530634229794634
  Buffered in ISA-AAs               : 22                    29849
  Discarded in ISA-AAs              : 97790                 47801217
      Policy                        : 0                     0
      Congestion                    : 0                     0
      Errors                        : 97790                 47801217
  Modified in ISA-AAs
      Packet size increased         : 0                     0
      Packet size decreased         : 0                     0
  Errors (policy bypass)            : 28283549              21160338635
  Exited ISA-AAs                    : 7437950082379         5530634181963568
  Returned discards                 : 0                     0
      Congestion                    : 0                     0
      Errors                        : 0                     N/A
  Returned traffic                  : 7437950054070         5530634162337570
  ===============================================================================
This can also be run on a per-ISA basis:
show application-assurance group 1 status isa <slot/port> detail
Note that for MS-ISA2, there is a maximum AA packet rate of 7 M pps; under most known traffic mix scenarios, the ISA should be safely below this packet rate when at maximum bandwidth throughput. However, it is worth periodically checking this value, because if the maximum packet rate is exceeded, and overload cut-through will result. (For MS-ISA, the maximum packet rate supported is high enough to not be feasible with realistic application-based traffic mixes).
The ISA aa-performance record should always be enabled in a network for capacity planning purposes in order to properly plan when to add new ISA cards if required and to monitor the network health:
*A:BNG>config>isa# info
----------------------------------------------
        application-assurance-group 1 aa-sub-scale residential create
            no description
            primary <slot/port>
            backup <slot/port>
            no fail-to-open
            isa-capacity-cost-high-threshold 304000
            isa-capacity-cost-low-threshold 272000
            partitions
            statistics
                performance
                    accounting-policy 7
                    collect-stats
                exit
            exit
            divert-fc be
            no shutdown
        exit
The commands highlighted in bold above will export information on the total traffic load and resource utilization of the ISA card:
Flows — active flows, setup rates, resource allocation
Traffic rates — bandwidth, packets
Subscribers — active, configured, statistics resource allocation in use
The AA statistics collection configuration refers to accounting policies that are also defined in the SR OS node:
*A:BNG>config# log
    file-id 7
        description "ISA Performance Stats"
        location cf2:
        rollover 15 retention 12
    exit
    accounting-policy 7
        description "ISA Performance Stats‟
        collection-interval 15
        record aa-performance
        to file 7
        no shutdown
    exit
From the AA performance record the following fields in Tracking ISA load in the reporting interval can be used as to tracking ISA load in the reporting interval (typically a 15 to 60 minute period):
Record name |
Type |
Description |
Load planning use |
|---|---|---|---|
dco |
cumulative |
octets discarded due to congestion in MDA |
Should be 0; ISA internal congestion |
dcp |
cumulative |
packets discarded due to congestion in MDA |
Should be 0; ISA internal congestion |
dpo |
cumulative |
octets discarded due to policy in MDA |
Not related to load planning |
dpp |
cumulative |
packets discarded due to policy in MDA |
Not related to load planning |
pbo |
cumulative |
octets policy bypass |
Not used. Traffic was for an invalid subscriber and the group was "no fail-to-open" |
pbp |
cumulative |
packets policy bypass |
Not used. Traffic was for an invalid subscriber and the group was "no fail-to-open" |
nfl |
cumulative |
number of flows |
informative |
caf |
intervalized |
current active flows |
informative |
aaf |
intervalized |
average active flows |
informative |
paf |
intervalized |
peak active flows |
Check vs max |
cfr |
intervalized |
current flow setup rate |
informative |
afr |
intervalized |
average flow setup rate |
Check meets expected norms; increasing over time increases load |
pfr |
intervalized |
peak flow setup rate |
informative |
ctr |
intervalized |
current traffic rate |
informative |
atr |
intervalized |
average traffic rate |
Check meets expected norms; increasing over time increases load |
ptr |
intervalized |
peak traffic rate |
Check vs max |
cpr |
intervalized |
current packet rate |
informative |
apr |
intervalized |
average packet rate |
informative |
ppr |
intervalized |
peak packet rate |
informative |
cds |
intervalized |
current diverted subscribers |
informative |
ads |
intervalized |
average diverted subscribers |
informative |
pds |
intervalized |
peak diverted subscribers |
Check vs max and expected norms; increasing over time increases load |
rfi |
intervalized |
flows in use |
Check vs max and expected norms; increasing over time increases load |
rcc |
cumulative |
ISA capacity cost |
Check meets expected norms; increasing over time increases load |
The intended deployment model is for this statistic record to be collected by a centralized service-aware management system along with all other AA records and to be stored in a reporting and analysis management database for subsequent analytics purposes, such as trending charts or setting thresholds of key values. It is recommended that a CRON script be used to export the AA performance record to a storage server for post processing if no reporting and analysis management tool is deployed:
If no reporting and analysis management tool is deployed in the network, it is possible to automatically collect the XML accounting files and provide high-level reporting through an XML-to-CSV conversion.
The simplest approach is to configure a CRON script on the SR OS node to automatically retrieve the CF accounting file (alternatively, any other scripting mechanism with an interval smaller than the retention period can be used)
It is recommended that the rollover interval of the file-id policy be modified to 6H or above in order to collect fewer files while keeping the same collection interval.
*A:BNG# file type cf2:/script
file copy cf2:/act/*.gz ftp://login:password@IP-ADDRESS/acct/router1/

*A:BNG>config>cron# info
----------------------------------------------
        script "test-ftp-act"
            location "cf2:/script"
            no shutdown
        exit
        action "cron1"
            results "ftp://login:password@IP-ADDRESS/results/router1-result.log"
            script "test-ftp-act"
            no shutdown
        exit
        schedule "schedule1"
            interval 36000
            action "cron1"
            no shutdown
        exit
The schedule : interval 36000 is in seconds (10 hours).
With this XML to CSV export mechanism, a spreadsheet can be used by the network engineer to periodically track the ISA resource utilization.
ISA overload cut-through
The system can be configured to react to overload based on the weighted-average (WA) queue depth of the shared network port buffer pool from-sub and to-sub. Overload cut-through is typically recommended for use of AA for value-added services where, in the event of overload, the preference is for the ISA to continue to pass packets without AA processing. However, firewall use cases will prefer to drop excess traffic in the event of overload, in which case overload cut-through may not be desired.
In addition to triggering an alarm, further packets sent to the ISA after the WA high-watermark threshold is reached are cut-through immediately by the ISA card without application identification or subscriber policy processing, if the isa-overload-cut-through command is enabled.
The WA queue depth is typically configured based on the maximum tolerated delay for the service diverted and the amount of shared buffer space allocated from the IOM.
AA deployment recommended settings:
high watermark — 33% of the maximum MBS for all diverted network queues
low watermark — 5% of the maximum MBS for all diverted network queues
The recommended high and low watermarks assume that the sum of the network port egress queues MBS size is 100% of the shared buffer. If this network queue maximum size is further reduced in the network QoS policy, the watermark values must be adapted proportionally; for example, if the total MBS size cannot exceed 50% of the shared buffer, then the watermark values would be divided by 2: the high watermark = 33% / 2 = 16%, the low watermark = 5% / 2 = 2%. Adjusting the MBS and the wa-shared-high-wmark and wa-shared-low-wmark values proportionately ensures that the MBS point (after which discards occur) is above the WA shared high-watermark threshold; otherwise, the ISA will not ever overload if MBS discards are occurring first.
A:BNG# configure isa application-assurance-group 1
            isa-overload-cut-through
            qos
                egress
                    from-subscriber
                        wa-shared-high-wmark 16
                        wa-shared-low-wmark 2
                    exit
                    to-subscriber
                        wa-shared-high-wmark 16
                        wa-shared-low-wmark 2
                    exit
                exit
            exit
The show isa group commands can be used to verify that overload cut-though is enabled.
*A:BNG>show isa application-assurance-group 1
=============================================================
ISA Application-assurance-groups
=============================================================
ISA-AA Group Index          : 1
Description                 : (Not Specified)
Subscriber Scale            : residential
WLAN GW Group Index         : N/A
Primary ISA-AA              : 1/2 up/active
Backup ISA-AA               : 2/1 down
Last Active change          : 07/02/2014 12:17:45
Admin State                 : Up
Oper State                  : Up
Diverted FCs                : be
Fail to mode                : fail-to-wire
Partitions                  : enabled
QoS
  Egress from subscriber
    Pool                    : default
      Reserved Cbs          : default
      Slope Policy          : default
    Queue Policy            : default
    Scheduler Policy        :
  Egress to subscriber
    Pool                    : default
      Reserved Cbs          : default
      Slope Policy          : default
    Queue Policy            : default
    Scheduler Policy        :
Capacity Cost
    High Threshold          : 4294967295
    Low Threshold           : 0
Overload Cut Through        : enabled
Transit Prefix
    Max IPv4 entries        : 0
    Max IPv6 entries        : 0
    Max IPv6 remote entries : 0
HTTP Enrichment
    Max Packet Size         : 1500 octets
========================================================================
To monitor the load status of an ISA, enter the following CLI command.
*A:BNG>show application-assurance group 1 status isa 5/1 cpu
==========================================
Application-Assurance ISA CPU Utilization
(Test time 993791 uSec)
==========================================
Management CPU Usage
------------------------------------------
Name               CPU Time    CPU Usage
                  (uSec)
------------------------------------------
System               14277         1.43%
Management           61101         6.15%
Statistics           69850         7.02%
Idle                848563        85.39%
==========================================
Datapath CPU Usage
------------------------------------------
Name              CPU Time     CPU Usage
                  (uSec)
------------------------------------------
System               14277         1.43%
Packet Processing    61101         6.15%
Application ID       69850         7.02%
Idle                848563        85.39%
Additionally, the system log files can be used to examine the AA overload history to determine when the overload state was entered and exited. It can be helpful to send AA events to a separate log using the following configuration:
    log
        filter 45
            default-action drop
            entry 10
                action forward
                match
                    application eq "application_assurance"
                exit
            exit
        exit
        log-id 45
            description "application-assurance log"
            filter 45
            from main
            to memory 500
        exit
The log files can then be examined to see if overload has occurred, and how frequently. If overload occurs with any regularity, it is a situation that should be addressed. Below is an example of a log file showing AA overload:
A:BNG# show log log-id 45
===============================================================================
Event Log 45
===============================================================================
Description : application-assurance log
warning: 13 events dropped from log
Memory Log contents  [size=500   next event=16  (not wrapped)]

15 2014/08/14 17:00:32.66 EST WARNING: APPLICATION_ASSURANCE #4433 Base
"ISA AA Group 1 MDA 5/1 exiting overload cut through processing."

14 2014/08/14 17:00:32.55 EST WARNING: APPLICATION_ASSURANCE #4431 Base
"ISA-AA group 1 MDA 5/1 wa-shared buffer use is less than or equal to 1% in the to-subscriber direction or corresponding tmnxBsxIsaAaGrpToSbWaSBufOvld notification has been disabled."

13 2014/08/14 17:00:32.06 EST WARNING: APPLICATION_ASSURANCE #4432 Base
"ISA AA Group 1 MDA 5/1 entering overload cut through processing."

12 2014/08/14 17:00:32.05 EST WARNING: APPLICATION_ASSURANCE #4430 Base
"ISA-AA group 1 MDA 5/1 wa-shared buffer use is greater than or equal to 35% in the to-subscriber direction."
The primary indicator to look at in CLI statistics for ISA load indication is datapath CPU usage. Regardless of the configuration and traffic profiles in use, datapath CPU usage gives a consistent indication of whether the ISA is under heavy load (the cause of overload is the inability of the ISA to perform more tasks). The idle datapath time is not proportionate to bandwidth throughput, but if idle datapath CPU usage is under 5%, this indicates an approaching maximum processing load.
At an average datapath use of 95-100% (less than 5% idle) the ISA is creating latency and backpressuring the host IOM egress. It is the best way to know how close to overload the ISA has been. Attempting to examine data throughput statistics such as bit rate, flow setup rate and packet rate to predict overload is not recommended, as these are quite variable under normal circumstances and are not directly correlated to overload. Once in overload, the data statistics (volume, setup rate, and so on) are useful for determining what threshold traps to put in place for the future, but the needed thresholds will always be specific to the live deployment traffic mix and policy configuration.
Below is an example of the status for an ISA that is fully loaded but not yet in overload:
*A:BNG>show application-assurance group 1 status isa 5/1 cpu
==========================================
Application-Assurance ISA CPU Utilization
==========================================

----------------------------------------------
Management CPU Usage (Test time 999636 uSec)
----------------------------------------------
Name                  CPU Time     CPU Usage
                      (uSec)
----------------------------------------------
System                    1540         0.15%
Management                  14        ~0.00%
Statistics              643955        64.42%
ICAP Client                603         0.06%
Idle                    353524        35.37%
----------------------------------------------

----------------------------------------------
Datapath CPU Usage   (Test time 999735 uSec)
----------------------------------------------
Name                  CPU Time     CPU Usage
                      (uSec)
----------------------------------------------
System                  188374        18.84%
Packet Processing       534203        53.43%
Application ID          277158        27.72%
Idle                         0         0.00%
----------------------------------------------
In this example, 0% idle datapath CPU means the ISA is fully used. When the Datapath CPU Usage Idle average is in the 5-10% range consistently, the ISA should be considered ‟full”; to add new subscribers, more ISAs are required.
If the excessive traffic condition persists, backpressure from the ISA to the IOM will buffer packets in the egress buffers, and when the egress MBS is exceeded, the ISA host IOM will indicate diverted discards due to congestion if cut-through is not enabled:
*A:BNG>show application-assurance group 1 status detail
===============================================================================
Application-Assurance Status
===============================================================================
Last time change affecting status : 08/12/2014 13:16:15
Number of Active ISAs             : 1
Flows                             : 235754165
Flow Resources In Use             : 12000000
AA Subs Created                   : 14224
AA Subs Deleted                   : 0
AA Subs Modified                  : 1
Seen IP Requests Sent             : 0
Seen IP Requests Dropped          : 0
-------------------------------------------------------------------------------
                                    Current    Average    Peak
-------------------------------------------------------------------------------
Active Flows                      : 8452434    3786948    10632607
Flow Setup Rate (per second)      : 246578     65104      298677
Traffic Rate (Mbps)               : 33702      13229      35813
Packet Rate (per second)          : 6847697    2466118    6945936
AA-Subs Downloaded                : 14224      13710      14224
Active Subs                       : 14224      9934       14224
-------------------------------------------------------------------------------
                                    Packets               Octets
-------------------------------------------------------------------------------
Diverted traffic                  : 8924242848            5983284952320
Diverted discards                 : 752486                729147667
    Congestion                    : 752486                729147667
    Errors                        : 0                     N/A
Entered ISA-AAs                   : 8923417360            5982508976617
Buffered in ISA-AAs               : 57                    19277
Discarded in ISA-AAs              : 0                     0
    Policy                        : 0                     0
    Congestion                    : 0                     0
    Errors                        : 0                     0
Modified in ISA-AAs
    Packet size increased         : 0                     0
    Packet size decreased         : 0                     0
Errors (policy bypass)            : 0                     0
Exited ISA-AAs                    : 8923417303            5982508957340
Returned discards                 : 0                     0
    Congestion                    : 0                     0
    Errors                        : 0                     N/A
Returned traffic                  : 8923285123            5982432640249
===============================================================================
ISA default subscriber policy
Default subscriber policy — AQP with match criteria not using App-ID or 5-tuple. Match only includes traffic direction and/or ASO characteristic and/or subscriber name.
It is recommended that each ISA be configured with some default subscriber policies that get applied to all subscribers at all times, independent of application flow ID, and even when an ISA is in overload cut-through. These policies protect the ISA resources and provide fairness of resource allocation between subscribers by limiting the ISA resources that can be consumed by a single subscriber. A starting point for the recommended policers is (in all cases, network-specific tuning is recommended):
Per-subscriber flow rate policer: value more than expected maximum peak per-subscriber rate for active subscribers. The policer protects one subscriber from attacking the network with an excessive flow rate and affecting ISA flow rate resources used by other customers. A typical rate for residential networks could be 100 fps per subscriber.
Per-subscriber flow count policer: value more than expected maximum per-subscriber flow count for active subscribers. The policer protects one subscriber from consuming excessive flow counts and affecting ISA flow resources used by other customers.
Downstream bandwidth per subscriber: to a value more than the maximum rate supported by the service, or to less than the maximum per-subscriber capability of the ISA, whichever is lower. For fixed networks, several default policer rates are recommended using a per-sub ASO value for low, medium and large rate ranges set at a rate related to the subscriber access speed. For example, for an FTTH service the per-sub policers could be set at 3 value ranges: below 25Mbps, with another at 100Mbps sub policer for services between 25Mbps and 100Mbps, and another sub-policer for rates between 100Mbps and 1Gbps. The settings for a mobile 3G network rate may be 1Mbps and in an LTE network the rate may be vhcc10Mbs.
For a CLI example of a default subscriber policy, see Application Assurance — App-Profile, ASO and Control Policies.
Conclusion
Any deployment of Application Assurance should include careful capacity planning of the ISA resources, with an appropriate ISA overload strategy, whether for overload cut-through to keep excess traffic flowing, or with a discard policy engineered in the host IOM egress QoS policies.
ISA resource use should be monitored via appropriately configured resource thresholds, events, log files, XML records and show screens to ensure that sufficient ISA resources are available as required.