Viewing a fabric intent
-
Click the
 menu.
menu.
- Select Fabric Intents.
- To open a specific fabric intent from the list, do one of the following:
- Double-click the row for that fabric intent.
- Select a row, click the
 icon at the right edge of that row, and select
Open from the displayed action list.
icon at the right edge of that row, and select
Open from the displayed action list.
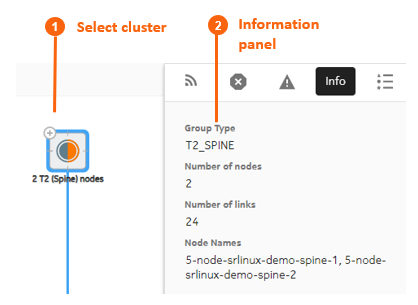
Groups
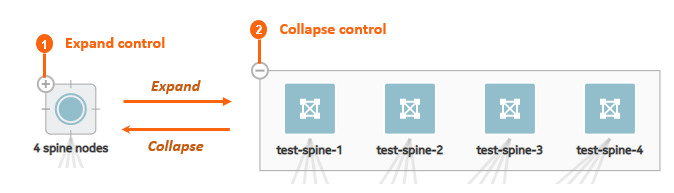
Groups represent multiple nodes in your fabric's topology. When a fabric consists of many nodes, the topology can grow complicated. Groups simplify the display of such complicated structures to make them more comprehensible at a glance.
The maximum number of nodes represented by a single group is a variable you can set with the Clustering Controls display setting (as described in Display controls). The system automatically adds more groups to the display to represent additional nodes beyond this threshold.
You can click the ![]() control for
any group to expand it; the node is replaced by the set of individual nodes it represented.
control for
any group to expand it; the node is replaced by the set of individual nodes it represented.
Element |
Description |
|
|---|---|---|
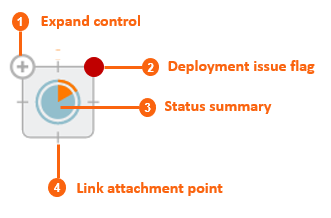
1 |
Expand control |
Click this control to expand the group and display its individual nodes. |
2 |
Deployment issue flag |
This displays only if there are issues associated with the deployment of configuration data to one or more nodes in the group. |
3 |
Status summary |
This is a pie chart that indicates the proportion of nodes in the group that are the subject of alerts, versus those that are not. Errors are represented by the orange segment. |
4 |
Link attachment point |
Links to other nodes originate from one of these points at the edge of the group icon. |
To expand a group, click the ![]() control at the top-left corner of the group.
control at the top-left corner of the group.
To collapse an expanded group, click the ![]() control in the same position.
control in the same position.
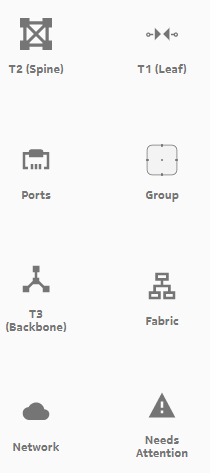
The symbol for each node indicates its role as spine, leaf, or backbone as shown in Icons for fabric intents.
Information displays
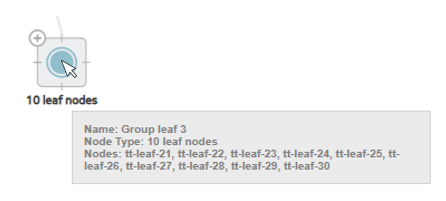
You can hover the cursor over a node or group in the fabric intent Design view to see details about that object.
You can also expand the information panel on the right side of the page by clicking ![]() . The information panel shows
more details about the currently selected object in the fabric topology (either a group,
a node, or a link).
. The information panel shows
more details about the currently selected object in the fabric topology (either a group,
a node, or a link).
Error indicators
The Fabric Services System UI provides a number of cues to draw your attention to problem areas in your fabric intent. Highlights and symbols in the topology display identify groups and nodes that are the subject of one or more errors.
Element |
Description |
|---|---|

|
Operational Normal: this node or group is in good order and in an operational state. |

|
Intent Matching: this node or group is configured as described in the original fabric intent. |

|
Intent Deviation: this node or group has been configured differently than specified in the original fabric intent. This arises when someone outside of the Fabric Services System alters the node configuration after the deployment of your fabric intent. |

|
Operational Issue: this node or group is not operational or its operation is impaired. Check the Alerts list to identify the operational issue that is affecting the object. |

|
Missing Hardware: this node or group is identified as "real" in the fabric intent, but no corresponding real-world hardware has been associated with it. |

|
Maintenance: this node or group is subject to a Maintenance intent (either to replace a node with new matching hardware, or to update the node's software load). |
The Status Summary at the bottom of the page shows general information about the fabric intent's progress and status.
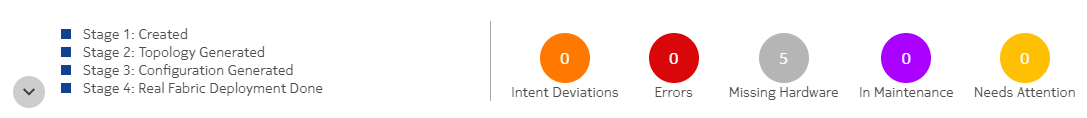
- Stage: The current fabric intent's progress through its development stages toward
deployment, including:
- Created: A user has selected a template, supplied basic parameters, and elected to proceed with fabric generation.
- Topology Generated: the system has generated the fabric topology.
- Configuration Generated: the system has generated the configuration files for individual nodes participating in the fabric, based on the current fabric intent design.
- Deployment Done: Tracked separately for the Digital Sandbox and real hardware, this indicates that the necessary configurations have been applied to the nodes participating in the fabric.
- Status: These indicators show a count of nodes within the current fabric that are in various states, as described in Node shading.
Viewing the event log
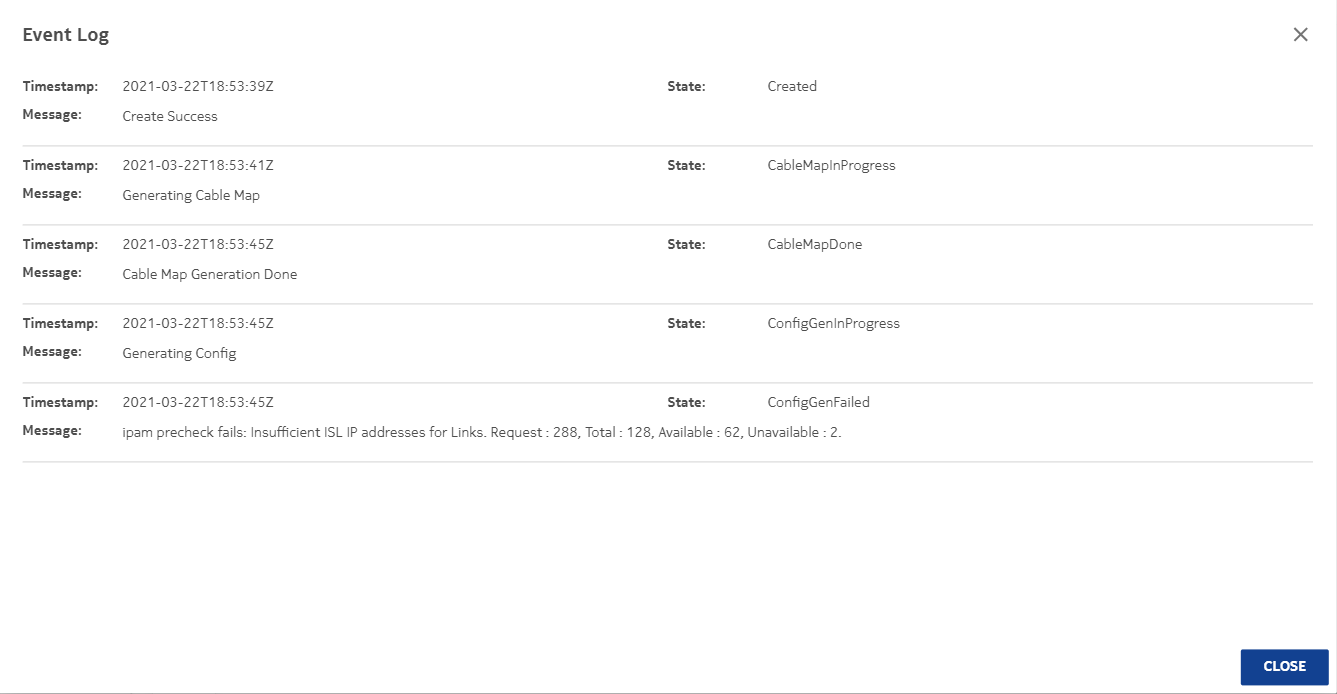
To view the event log for a fabric intent:
-
Click the menu.
- Select Fabric Intents.
-
To open a specific fabric intent from the list, do one of the following:
- Double-click the row for that fabric intent.
- Select a row, click the icon at the right edge of that row, and select
Open from the displayed action list.
-
From the opened fabric intent, click the menu at the upper right of
the page.
- Select Event Log from the action list.
- To exit the event log, click the CLOSE button.
Viewing a fabric intent as code
-
Click the menu.
- Select Fabric Intents.
- Use the Region Selector at the top of the page to select the region that includes the fabric intent.
-
To open a specific fabric intent from the list, do one of the following:
- Double-click the row for that fabric intent.
- Select a row, click the icon at the right edge of that row, and select
Open from the displayed action list.
-
Click
 to open the code view.
- Optional:
Do any of the following:
- To save the fabric code in a local file, click
 and choose a
location and name for the file.
and choose a
location and name for the file. - To copy a portion of the code, select the code and click
 . The system
adds the selection to your clipboard.
. The system
adds the selection to your clipboard. - To find a particular string of text within the fabric code, click
 and enter the text
string.
and enter the text
string. The first instance is highlighted; use the arrows to navigate forward or backward to additional instances, or click ALL to highlight all instances simultaneously.
- To save the fabric code in a local file, click
-
To compare the current fabric code against the code for a previous version of the same
fabric:
- At the end of the "breadcrumb" list at the upper left of the overlay, in the drop-down list, click Compare Versions.
- Click the Compare To drop-down list and select a different version number of the current fabric from the list.
- Click the Expand <number> lines link to view the full fabric code displayed in two panels, one for each version.
- Optional: Repeat step 7.b to select another version of the same fabric against which to compare the current version's code.
-
To view the code for an individual node within the fabric:
- At the end of the "breadcrumb" list at the upper left of the overlay, in the drop-down list, click Fabric Elements.
- Click a node in the left column to see its current configuration code.
- Click the Expand <number> lines link to view the full fabric code displayed in two panels, one for each version.
- Optional: To see the normalized version of the same node's code, click the drop-down list at the upper right of the overlay and select Normalized.
-
When finished viewing the fabric as code, click
 at the upper right of the overlay
to return to the Fabric Design view.
at the upper right of the overlay
to return to the Fabric Design view.
Viewing the configuration file for a single node
Follow this procedure to view the current configuration planned for a single node.
-
Click to open the
main menu, then select Inventory.
- Use the Region Selector at the top of the page to select the region whose inventory you want to work with.
-
Find the node and click at the end of
its row.
- Select Inspect Configuration from the displayed actions list.
- Optional:
Do any of the following:
- To save the fabric configuration in a local file,
click and choose
a location and name for the file.
- To copy a portion of the fabric configuration,
select the portion and click . The
selection is added to your clipboard.
- To find a particular string of text within the
fabric configuration, click
 and enter
the text string. The first instance is highlighted;
use the arrows to navigate forward or backward to
additional instances, or click ALL to highlight all
instances simultaneously.
and enter
the text string. The first instance is highlighted;
use the arrows to navigate forward or backward to
additional instances, or click ALL to highlight all
instances simultaneously.
- To save the fabric configuration in a local file,
click
-
Click at the upper
right of the overlay to close the Inspect
Configuration overlay.
Downloading the initial node configuration
To download the configuration file:
-
Click the menu.
- Use the Region Selector at the top of the page to select the region whose inventory you want to work with.
- Select Fabric Intents.
-
To open a specific fabric intent from the list, do one of the
following:
- Double-click the row for that fabric intent.
- Select a row, click the icon at the right edge of that
row, and select Open from the displayed action
list.
-
From the opened fabric intent, click the
menu at the upper right of the page.
- Select Download Initial Node Configuration from the list. The system immediately downloads the file "initialNodeConfigs" to your Downloads folder.
- To view the configuration, open the initlalNodeConfigs file in a text editor.
Viewing the fabric inventory
You can open a fabric intent's Fabric Inventory view to see a list of all of the nodes that are included in the fabric design. The Inventory view displays extensive details about each node, including its role in the current fabric intent.
This list is a subset of the full inventory; it shows only the nodes participating in the current fabric intent.
From this view you can edit labels for nodes, associate planned nodes with real hardware, inspect an individual node's configuration code, and download a mapping file to help with node association. For more information about the complete inventory and the full set of actions available from any inventory view, see Inventories.
To open the Inventory view for a single fabric intent:
-
Click the menu.
- Select Fabric Intents.
- Use the Region Selector at the top of the page to select the region whose inventory you want to work with.
-
To open a specific fabric intent from the list, do one of the
following:
- Double-click the row for that fabric intent.
- Select a row, click the icon at the right edge of that
row, and select Open from the displayed action
list.
- Click the View drop-down list and select Fabric Inventory.
- To return to the Fabric Design view or open another view, make the corresponding selection from the View drop-down list.
Viewing fabric links
- Role
- Endpoint 1 Node, IP Address, and Port
- Endpoint 2 Node, IP Address, and Port
- Any associated labels
From this view you can edit labels on individual links.
To open the Fabric Links view:
-
Click the menu.
- Select Fabric Intents.
- Use the Region Selector at the top of the page to select the region that includes the fabric intent.
-
To open a specific fabric intent from the list, do one of the
following:
- Double-click the row for that fabric intent.
- Select a row, click the icon at the right edge of that
row, and select Open from the displayed action
list.
- Click the View drop-down list and select Fabric Links.
- To return to the Fabric Design view or open another view, make the corresponding selection from the View drop-down list.
Viewing edge links
To open the Edge-Links view:
-
Click the menu.
- Select Fabric Intents.
- Use the Region Selector at the top of the page to select the region that includes the fabric intent.
-
To open a specific fabric intent from the list, do one of the
following:
- Double-click the row for that fabric intent.
- Select a row, click the icon at the right edge of that
row, and select Open from the displayed action
list.
-
Click the View drop-down list and select
Edge-Links.
The display switches to the Edge-Links view.
This view displays the available ports in the current fabric intent, as well as any LAGs that have been created within the current fabric intent.
-
To view additional details about any edge link:
-
Select a row and click the more ( ) icon.
- Select Open from the drop-down list.
-
Select a row and click the more (
-
Click Close to return to the
Edge-Links view.
To return to the Fabric Design view or open another view, make the corresponding selection from the View drop-down list.
Generating a wiring plan
The wiring plan is in the form of a .csv file that identifies all of the connected pairs of nodes participating in the fabric, their roles (for example leaf or spine), and the ports on each node that serve as endpoints for their interconnections.
To generate a wiring plan:
-
Click the menu.
- Select Fabric Intents.
- Use the Region Selector at the top of the page to select the region that includes the fabric intent.
-
To open a specific fabric intent from the list, do one of the
following:
- Double-click the row for that fabric intent.
- Select a row, click the icon at the right edge of that
row, and select Open from the displayed action
list.
-
Click the More actions icon ()
to open the actions menu and select Generate Wiring
Plan...
The system generates and saves a file with the name <fabric name>_wiringPlan.csv.