Port Throughput Summary (NSP) report
Port Throughput Summary (NSP) report overview
The Port Throughput Summary (NSP) report differs from the Port Throughput Summary report by including throughput data for NEs managed by the NFM-P only, by the MDM (model-driven Nokia) only, or NFM-P+MDM-mediated NEs. The content and format of the Port Throughput Summary (NSP) report vary from the NFM-P-only Port Throughput Summary report to accommodate its model-driven approach.
For classic+GRPC NEs, the NE IP must be in IPV4 format. The IPV6 format is currently not supported by the report.
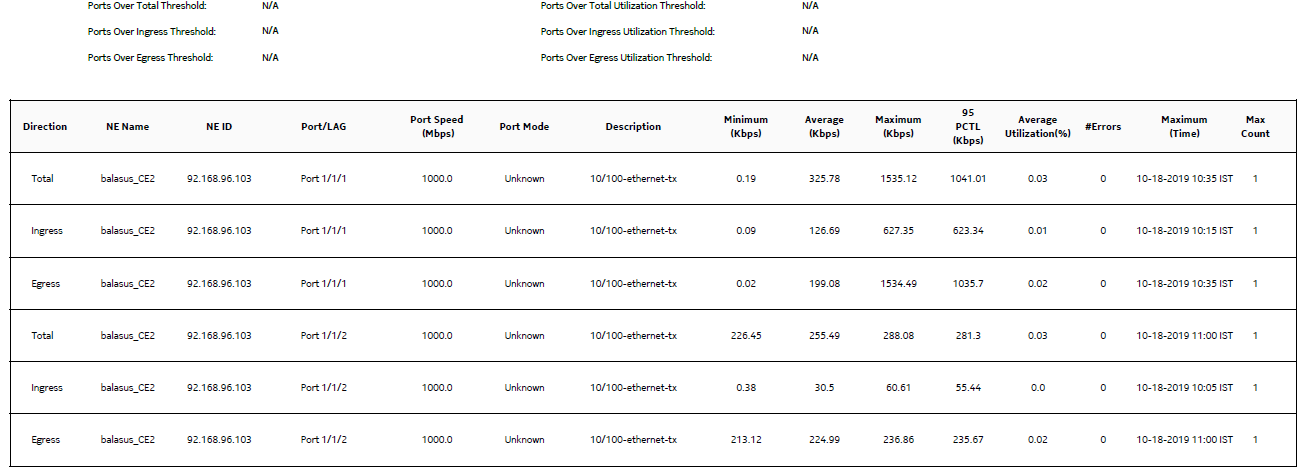
The port mode may show its value as Unknown for multivendor NEs because it is specific to Nokia.
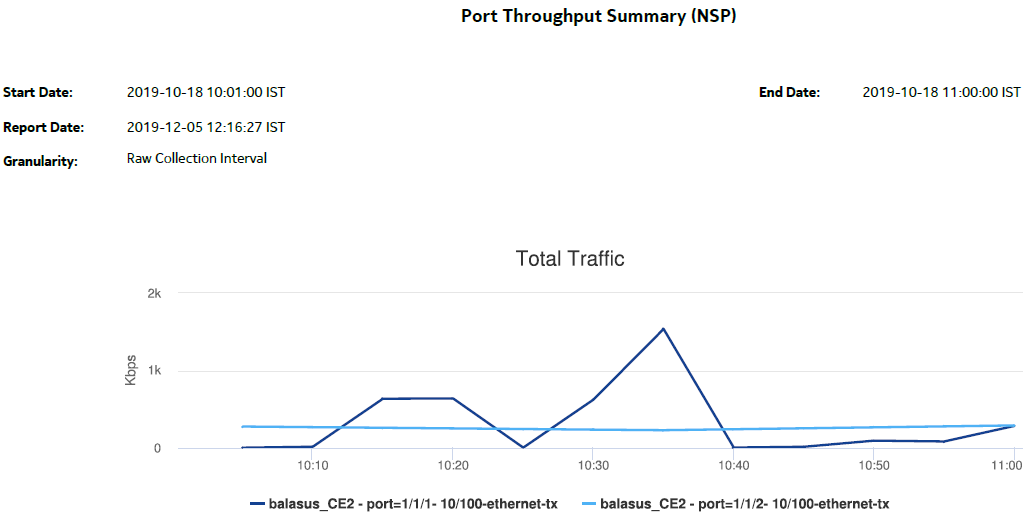
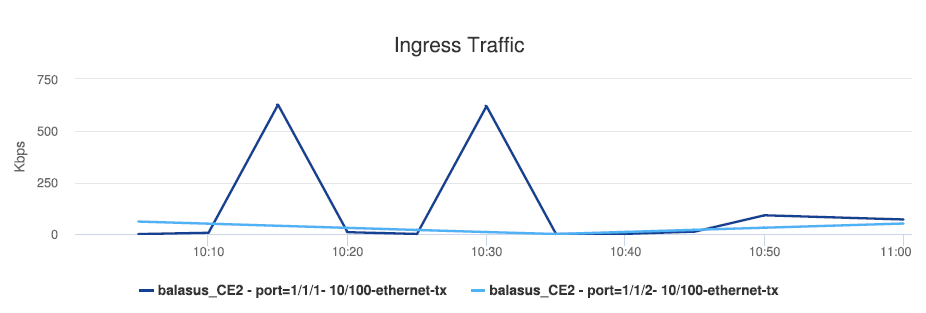
The Port Throughput Summary (NSP) report shows bandwidth utilization by specified ports for selected NFM-P and MDM-mediated NEs. The report contents and format vary from the NFM-P-only Port Throughput Summary report to accommodate the model-driven approach. The report can display a set of time series graphs, showing total, ingress, and egress.
The top five ports with the highest throughputs are shown in the report plots.
The summary table shows the minimum, average, and maximum throughput values and the average utilization, along with percentiles, for all the ports selected. The summary table displays the ports in descending order of average total throughput. The report also shows information such as the total count of errors of all types for the port.
If a percentile value from 1 to 99 is entered in the Percentile input, the selected percentile value of the data is shown in the table.
The values entered in the ingress, egress, and total threshold input prompts are compared with the average of ingress, egress, or total values and accordingly the records or rows in the table are highlighted. The highlighted rows (that is, the average values) are populated in the three rows above the table.
Additionally, the plot or graph shows the actual values at a specified time.
You must apply unique descriptions to classic NEs with gPRC when they are discovered in the NFM-P and SDN; otherwise, they are displayed as duplicates in the 'Physical ports or LAGs or MC LAGs' report input options.
Limitations
Report limitations include:
Prerequisites
You must configure SAP on an access port. When an access port is not configured with SAP, the drill-down from Port Throughput to Service Utilization per Port Details does not generate a report and shows a warning in the input prompts.
The following table describes the aggregation rules that must be enabled and the telemetry subscriptions that must be configured for the NEs on which statistics are to be collected. The aggregation rules must be enabled to view the report for granularities other than raw data; see How do I configure analytics aggregation?. Enable aggregation and configure telemetry subscriptions; see the Telemetry information on the Network Developer Portal and the NSP Data Collection and Analysis Guide.
See the NSP NFM-P Statistics Management Guide for information about creating or modifying a specific MIB statistics policy using a bottom-up method.
Table 19-13: Port Throughput Summary (NSP) report prerequisites
|
Aggregator name |
Monitored object class |
Statistics class |
Statistics collection |
NE types |
|---|---|---|---|---|
|
md-aggr:/md-aggr-base/telemetry-interfaces/interface |
equipment.PhysicalPort |
telemetry:/base/interfaces/interface |
GNMI/GRPC-based performance statistics |
All 7250 IXR variants 7750 MD SR Classic NE with gRPC telemetry collection enabled Cisco IOS-XR (NCS 7.6.2) (LAG only) Cisco XRV 7.6.2 (port and LAG) Huawei NetEngine 8000 (huawei-vrp-NE8K-M8) (port and LAG) Juniper vMX Junos 21.4R1.12 (port and LAG) |
|
md-aggr:/md-aggr-base/telemetry-interfaces/interface-errors |
Telemetry Base Interface errors |
telemetry:/base/interfaces/interface/errors |
Telemetry statistics |
7750 MD SR Classic NE with gRPC telemetry collection enabled Cisco IOS-XR (NCS 7.6.2) (LAG only) Cisco XRV 7.6.2 (port and LAG) Huawei NetEngine 8000 (huawei-vrp-NE8K-M8) (port and LAG) Juniper vMX Junos 21.4R1.12 (port and LAG) |
The following table describes the Port Throughput Summary (NSP) report prerequisites for NFM-P-managed NEs.
Table 19-14: Port Throughput Summary (NSP) report prerequisites for NFM-P-managed NEs
|
Aggregator name |
Monitored object class |
MIB name |
Statistics class |
Statistics collection |
NE types |
|---|---|---|---|---|---|
|
Interface Utilization Statistics Aggregator |
equipment.PhysicalPort lag.Interface |
ifXEntry |
equipment.InterfaceAdditionalStats |
Performance statistics |
7210-SAS All 7250 IXR variants 7705 SAR 7750-SR |
|
PortNetIngressStats Error Stats Aggregator |
equipment.PhysicalPort |
TIMETRA- PORT-MIB.tmnxPort NetIngress StatsEntry |
equipment.PortNetIngressStats |
Performance statistics |
7210 SAS All 7250 IXR variants 7705 SAR 7750 SR |
|
PortNetEgressStats Error Stats Aggregator |
equipment.PhysicalPort |
TIMETRA- PORT-MIB.tmnxPort NetEgress StatsEntry |
equipment.PortNetEgressStats |
Performance statistics |
7210 SAS All 7250 IXR variants 7705 SAR 7750 SR |
|
Dot3Stats Error Stats Aggregator |
equipment.PhysicalPort |
EtherLike- MIB.dot3Stats Entry ifEntry RMON- MIB.etherStats Entry |
equipment.InterfaceStats ethernetequipment.EthernetStats ethernetequipment.Dot3Stats |
Performance statistics |
7210 SAS All 7250 IXR variants 7705 SAR 7750 SR |
|
IngressPortFwdEngDropReasonStats Error Stats Aggregator |
equipment.PhysicalPort |
TIMETRA- PORT-MIB.tPortIngress FwdEngDR StatsEntry |
equipment.IngressPortFwdEngDropReasonStats |
Performance statistics |
7210 SAS All 7250 IXR variants 7705 SAR Hm 7750 SR |
Report characteristics
The following table lists the principal report characteristics.
Table 19-15: Port Throughput Summary (NSP) report characteristics
|
Characteristic |
Value | |||||
|---|---|---|---|---|---|---|
|
Data type |
Statistics | |||||
|
Source database |
Auxiliary database | |||||
|
Report inputs |
Prompt |
Notes | ||||
|
End date |
Calendar date or relative date (for example, two days ago) and time | |||||
|
Report range |
Length of time to be reported, in minutes (minutes, min), hours (hours, h), days (days, d), or months (months, m) | |||||
|
Granularity |
Aggregation types: | |||||
|
NE Types |
Search using partial names or wildcard (%). Select individual items or click Select All. | |||||
|
Name or name pattern for NEs | ||||||
|
NEs | ||||||
|
Port modes |
Select Access, Network, or Hybrid. Select individual items or click Select All. | |||||
|
Port-LAG or MC LAG |
Select one radio button | |||||
|
Name or name pattern for ports |
Search using partial names or wildcard (%). Select individual items or click Select All. | |||||
|
Physical ports or LAGs or MC LAGs | ||||||
|
Ingress Threshold |
Specify in bps/Kbps/Mbps/Gbps | |||||
|
Egress Threshold | ||||||
|
Total Threshold | ||||||
|
Average total utilization threshold |
— | |||||
|
Average ingress utilization threshold | ||||||
|
Average egress utilization threshold | ||||||
|
Percentile |
Identify a percentile of interest between 1 and 99. | |||||
|
Report inputs |
Prompt |
Notes | ||||
|
Logo Resource ID |
The logo to add to the report. Enter the Resource ID of the logo image in the Images folder. The default is the Nokia logo. To create the report without a logo, leave the Logo Resource ID field blank. | |||||
|
Logo Position |
Choose Left, Middle, or Right. The logo appears on the left on the first page of the report if you choose Left or Middle. | |||||
|
Show report output on one page |
Select the check box to enable pagination. Note: Using the Show report output on one page option when creating reports as drill-downs may impact report rendering time. Nokia recommends disabling the Show report output on one page option when creating reports. | |||||
|
Drill-down support |
Yes:
Note: You can drill down on an NFM-P managed port but the hyperlink is disabled for MDM-managed ports. | |||||


