Alarms
Alarms in EDA can arise from a variety of sources, including the EDA system itself and
the wide array of supported apps. For any alarm, the source/affected object is
identified as part of the alarm in the resource,
group, and kind fields.
Alarms are also associated with a namespace; this could be the base EDA namespace, or some other namespace. Users can only see and interact with alarms in namespaces for which they have access permissions.
Some alarms can be generated by intent-based apps within EDA. EDA treats such alarms as having been cleared if the app stops reporting that alarm.
Alarms associated with apps are described in documentation for individual apps.
Alarms on standby clusters
Standby cluster alarms can be important in understanding the state of redundancy in an EDA cluster. It is therefore useful to be able to see alarms generated on a standby cluster member even when working with the active member.
EDA supports this using the `cluster_member` field, which is set to the name of the cluster member that raised the alarm. This allows an operator to view alarms for all clusters, but still distinguish alarms for the active cluster from those for a standby cluster. For alarms that are not cluster-specific, this field remains unset.
Alarms in the EDA GUI
The EDA GUI includes several summary views of alarms known to EDA:
- An alarm summary is displayed on the EDA home page.
- A more detailed summary of alarms affecting key EDA components (clusters, Git servers, App catalogs and registries) is displayed on the main Alarms Summary page
- The Alarms list displays a list of all active alarms
- Suppress an alarm: this sets the suppressed flag for the current instance of the
alarm. By default, suppressed alarms are not displayed in the EDA GUI.Note: You can still view suppressed alarms by choosing "Show all alarms" from the Alarm List Table Settings and Actions menu.
- Delete an alarm: this removes all history of the alarm. Deletion is only allowed for cleared alarms. The option is disabled for active alarms.
- Acknowledge an alarm: this sets the Acknowledged flag for the current instance of the alarm.
Alarm definition resources
EDA core
services
and EDA applications document their supported alarms as
alarm
definition
resources. These resources are available via the query
.namespace.resources.cr.core_eda_nokia_com.v1.alarmdefinition.
This query allows operators to retrieve a list of supported alarms that is specific
to their deployed apps and versions.
The alarm definition specifications include the following fields:
| Specification | Description |
|---|---|
| SourceGroup |
Specifies
the group of the resource that raises the
alarm, for example,
Identifies
the application that raises the alarm. EDA core alarms have
the
source group
|
| Type | Specifies the alarm type, for example,
InterfaceDown. |
| Description | Specifies the description of the alarm. |
| ClusterSpecific |
If this specification is true, the alarm is raised against a specific EDA cluster. For example, a raised DeploymentDegraded alarm specifies which EDA cluster (active or standby) has a Kubernetes Deployment with one or more replicas that are not running. |
| Severity (optional) |
Specifies alarm severity. If not set, the alarm severity is variable. For example, the CPUThresholdExceeded alarm increases severity based on the CPU utilization value. |
| Kind and Group (optional) |
Specifies the Kind and Group of the resource which the alarm is associated with. For example, an InterfaceDown alarm is raised against an
Interface resource. The Kind is |
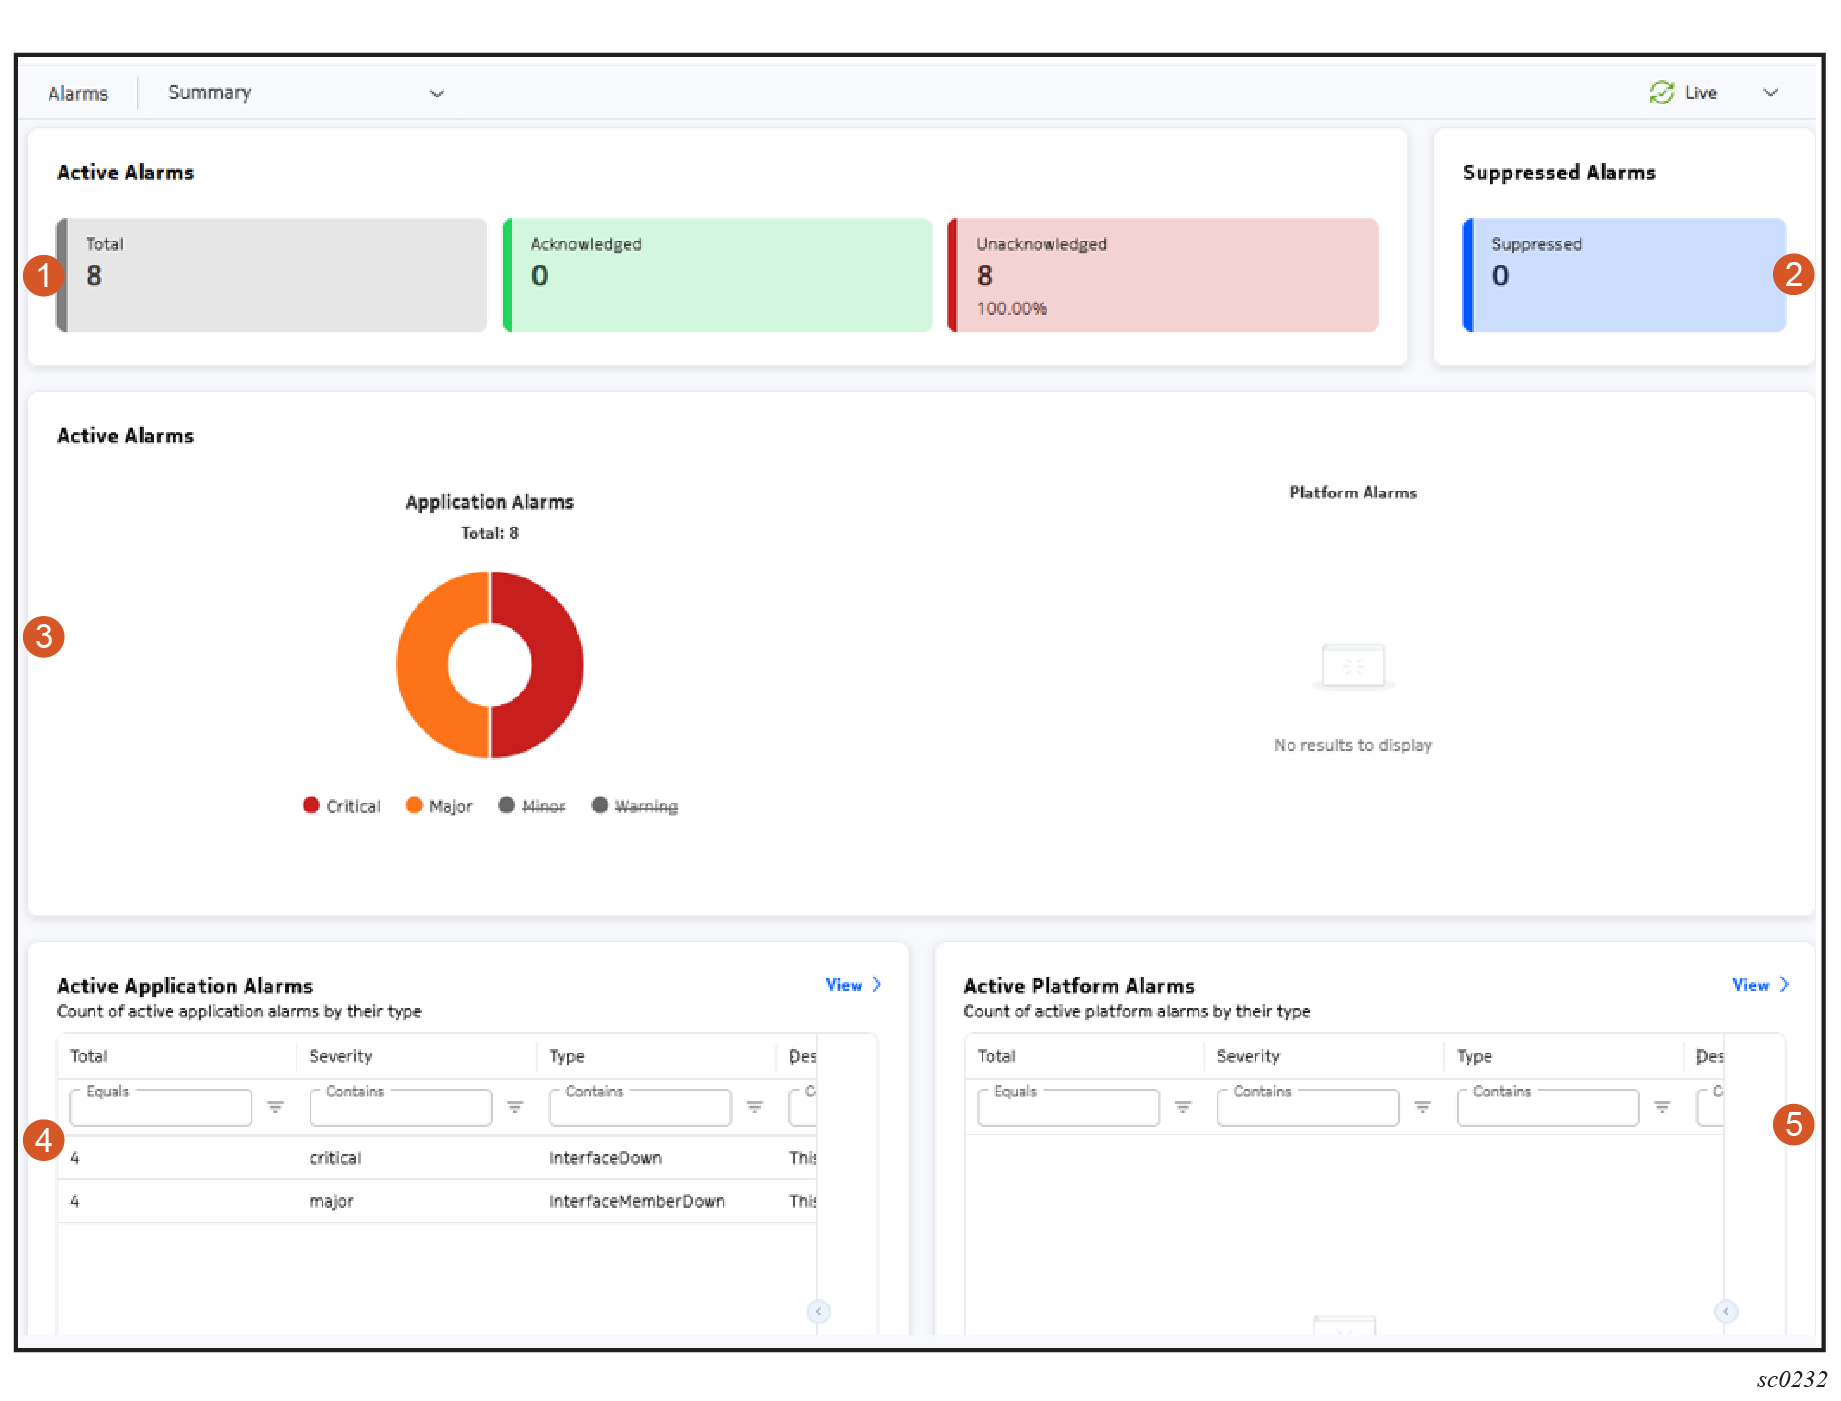
The Alarms Summary
| # | Dashlet | Description |
|---|---|---|
| 1 | Active Alarms count | The Active Alarms count dashlet displays a total count of alarms affecting EDA applications and the EDA platform itself. This dashlet also displays the count of acknowledged and unacknowledged alarms. |
| 2 | Suppressed Alarms | The Suppressed Alarms dashlet displays the count of suppressed alarms. |
| 3 | Active Alarms charts | The Active Alarms charts dashlet breaks the Application Alarm and Platform Alarm counts down by severity and displays them in charts. |
| 4 | Active Application Alarms | Building on the data displayed in the Active Alarms panel, the Active
Application Alarms dashlet lists the active alarms affecting EDA
applications, their severity, and their type. Clicking the View link opens the Alarms List. |
| 5 | Active Platform Alarms | The Active Platform Alarms dashlet lists the active alarms affecting
the EDA application, their severity, and their type. Clicking the View link opens the Alarms List. |
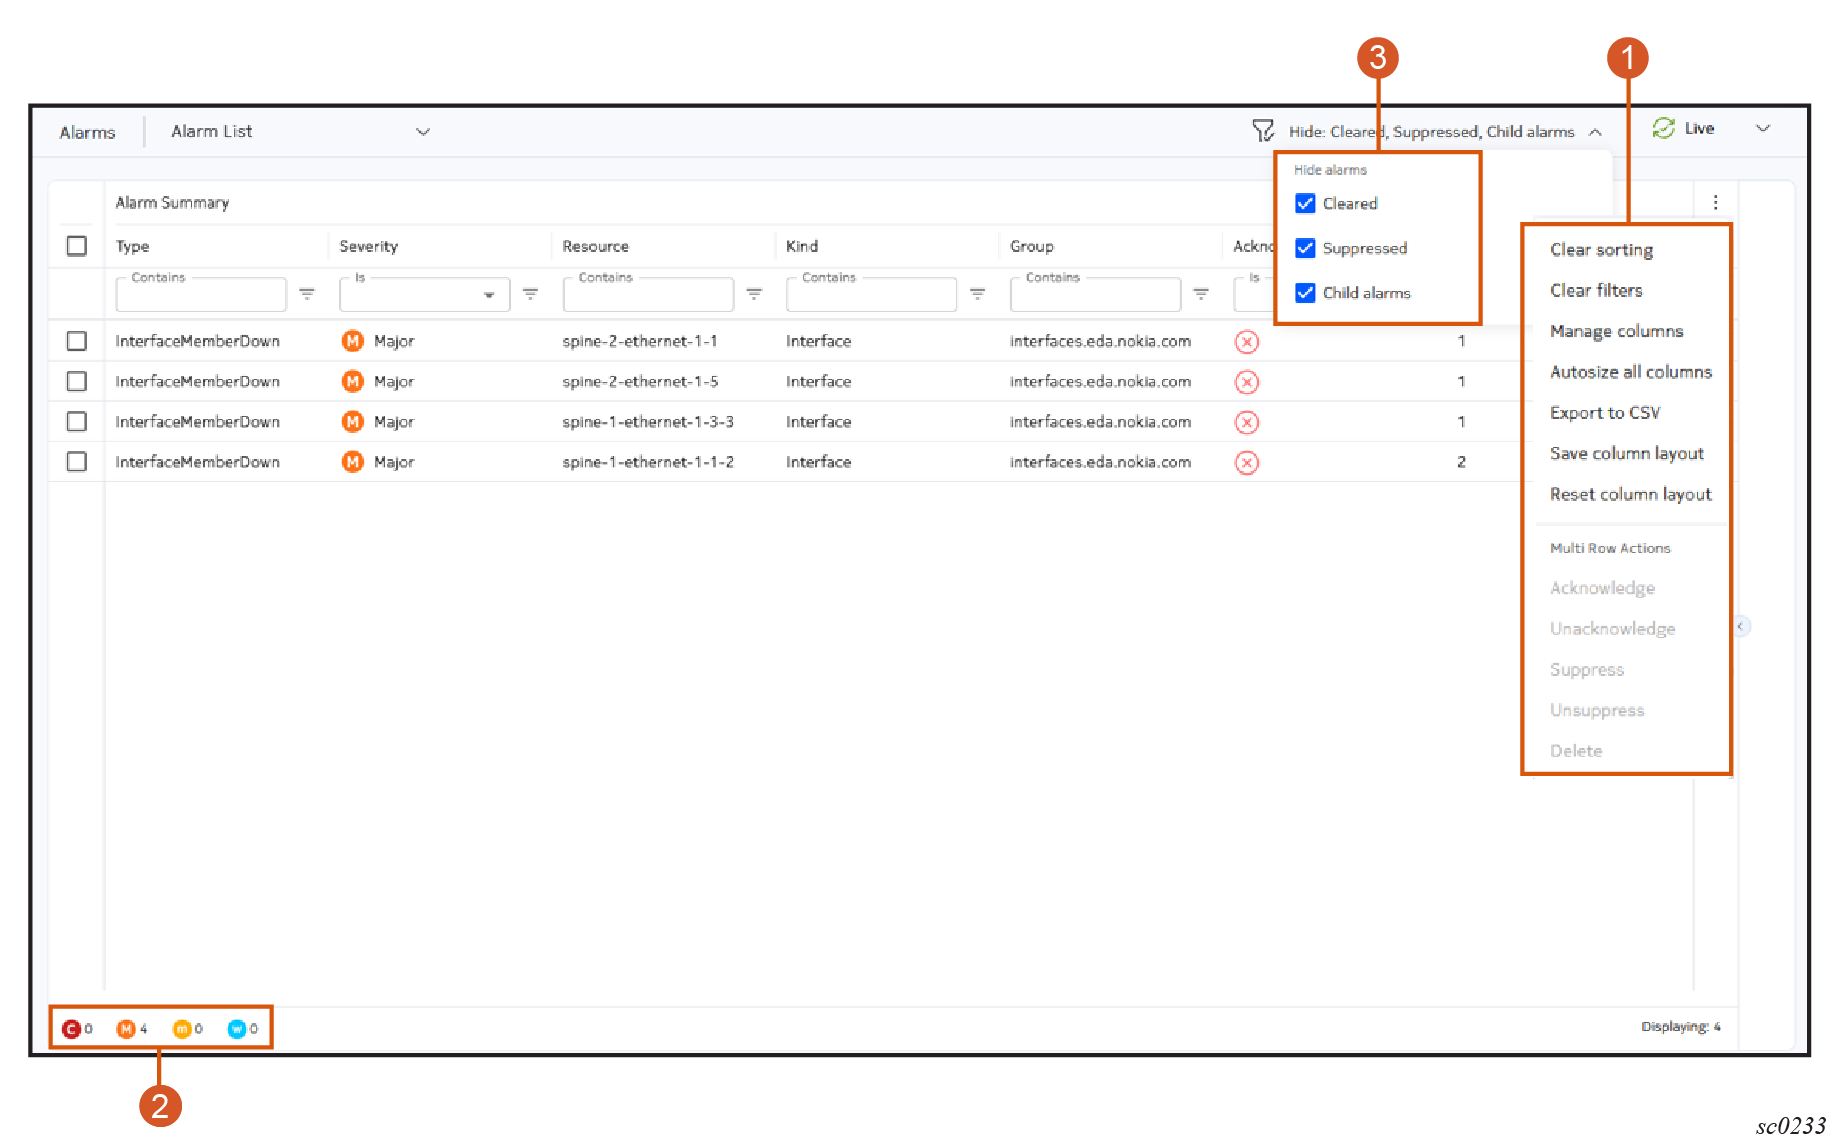
The Alarms list
| # | Name | Function |
|---|---|---|
| 1 | Alarms menu | The Alarms menu includes:
|
| 2 | Alarm count | Displays the number of current alarms of various severities. |
| 3 | Alarm quick filters | Allows you to hide alarms using the following filters:
These filters are all selected by default. |
Columns
The list of alarms displays the following columns by default.
| Column | Description |
|---|---|
| Namespace | Indicates
the namespace to which the alarm belongs. Alarms that are not specific to a namespace, such as platform certificate alarms, do not have or display a namespace value. |
| Type | The alarm type, as defined by the alarm itself. For example, InterfaceDown. |
| Severity | The importance of the alarm, as defined by the alarm itself.
Supported severities are:
You can click this column to sort by severity level. |
| Resource | Indicates the name of the resource that this alarm is present
on.
|
| Kind | Indicates the kind of resource the alarm is present on.
|
| Group | Indicates the group of the resource the alarm is present on.
For example, this is set to fabrics.eda.nokia.com if an alarm is raised against a Fabric. |
| Acknowledged | Indicates whether the alarm has been acknowledged (True or False) |
| Occurrences | The number of occurrences for the alarm. |
| Last Changed | Indicates the time the alarm last changed state. The timestamp is updated any time an alarm changes state between cleared and not cleared. |
The following alarms can be optionally displayed in the list of alarms by selecting Manage columns from the Alarms menu.
| Column | Description |
|---|---|
| Name | Indicates the name of the alarm. |
| Description | The description of the alarm from the alarm's encoded Description field. |
| Cleared | Whether the alarm has been cleared by an operator. Possible
values are:
This column is visible if the Active only filter is turned off. |
| Cluster Member | For EDA platform alarms, the EDA cluster member to which the alarm applies. |
| Probable Cause | The probable cause of the alarm, from the alarm's encoded Probable Cause field. |
| Remedial Action | The suggested remedial action to resolve the alarm, from the alarm's encoded Remedial Action field. |
| Acknowledged Until | If the alarm has been temporarily acknowledged, this indicates the date and time at which the acknowledgement expires. |
| Last Acknowledged | Indicates the date and time when the most recent acknowledgement occurred for this alarm. |
| Last Acknowledged By | Indicates the user who last acknowledged the alarm. |
| Suppressed Until | If the alarm has been temporarily suppressed, this indicates the date and time at which the suppression expires. This column is visible if the Hide suppressed filter is turned off. |
| Suppressed | Indicates whether the alarm has been suppressed. This column is visible if the Hide suppressed filter is turned off. |
| Last Suppressed | Indicates the date and time when the most recent suppression occurred for this alarm. |
| Last Suppressed By | Indicates the user who last suppressed the alarm. |
| Source Resource | The EDA-managed resource from which the alarm originates. |
| Source Kind | The kind of resource from which the alarm originates. |
| Source Group | The group of the resource from which the alarm originates. |
| JS Paths | The EDB entry which triggered the raising or clearing of the alarm, in JSPath notation. For example, if the alarm pertains to an interface operational state, this may be the JSPath: .node{.name=="spine-1"}.srl.interface{.name=="ethernet-1/14"} |
| Parent Alarms | Indicates whether the alarm is associated with one or more parent alarms. It is common for alarms to have one or more parents. For example, an InterfaceDegraded alarm may be caused by one or more of its component members being down; that condition is itself the subject of a separate alarm. This column is visible if the Root cause only filter is turned off. |
| Targets Affected | Indicates the number of child items which show the correlation between an alarm and the target it affects. |
The Alarms Information panel
The Alarms list page contains an Information panel that you can open by clicking the Expand/Contract control at the middle right of the page. This Information panel appears throughout the EDA GUI, for details see Information panel. The following figure shows an example of an expanded Alarms Information panel for a selected alarm.
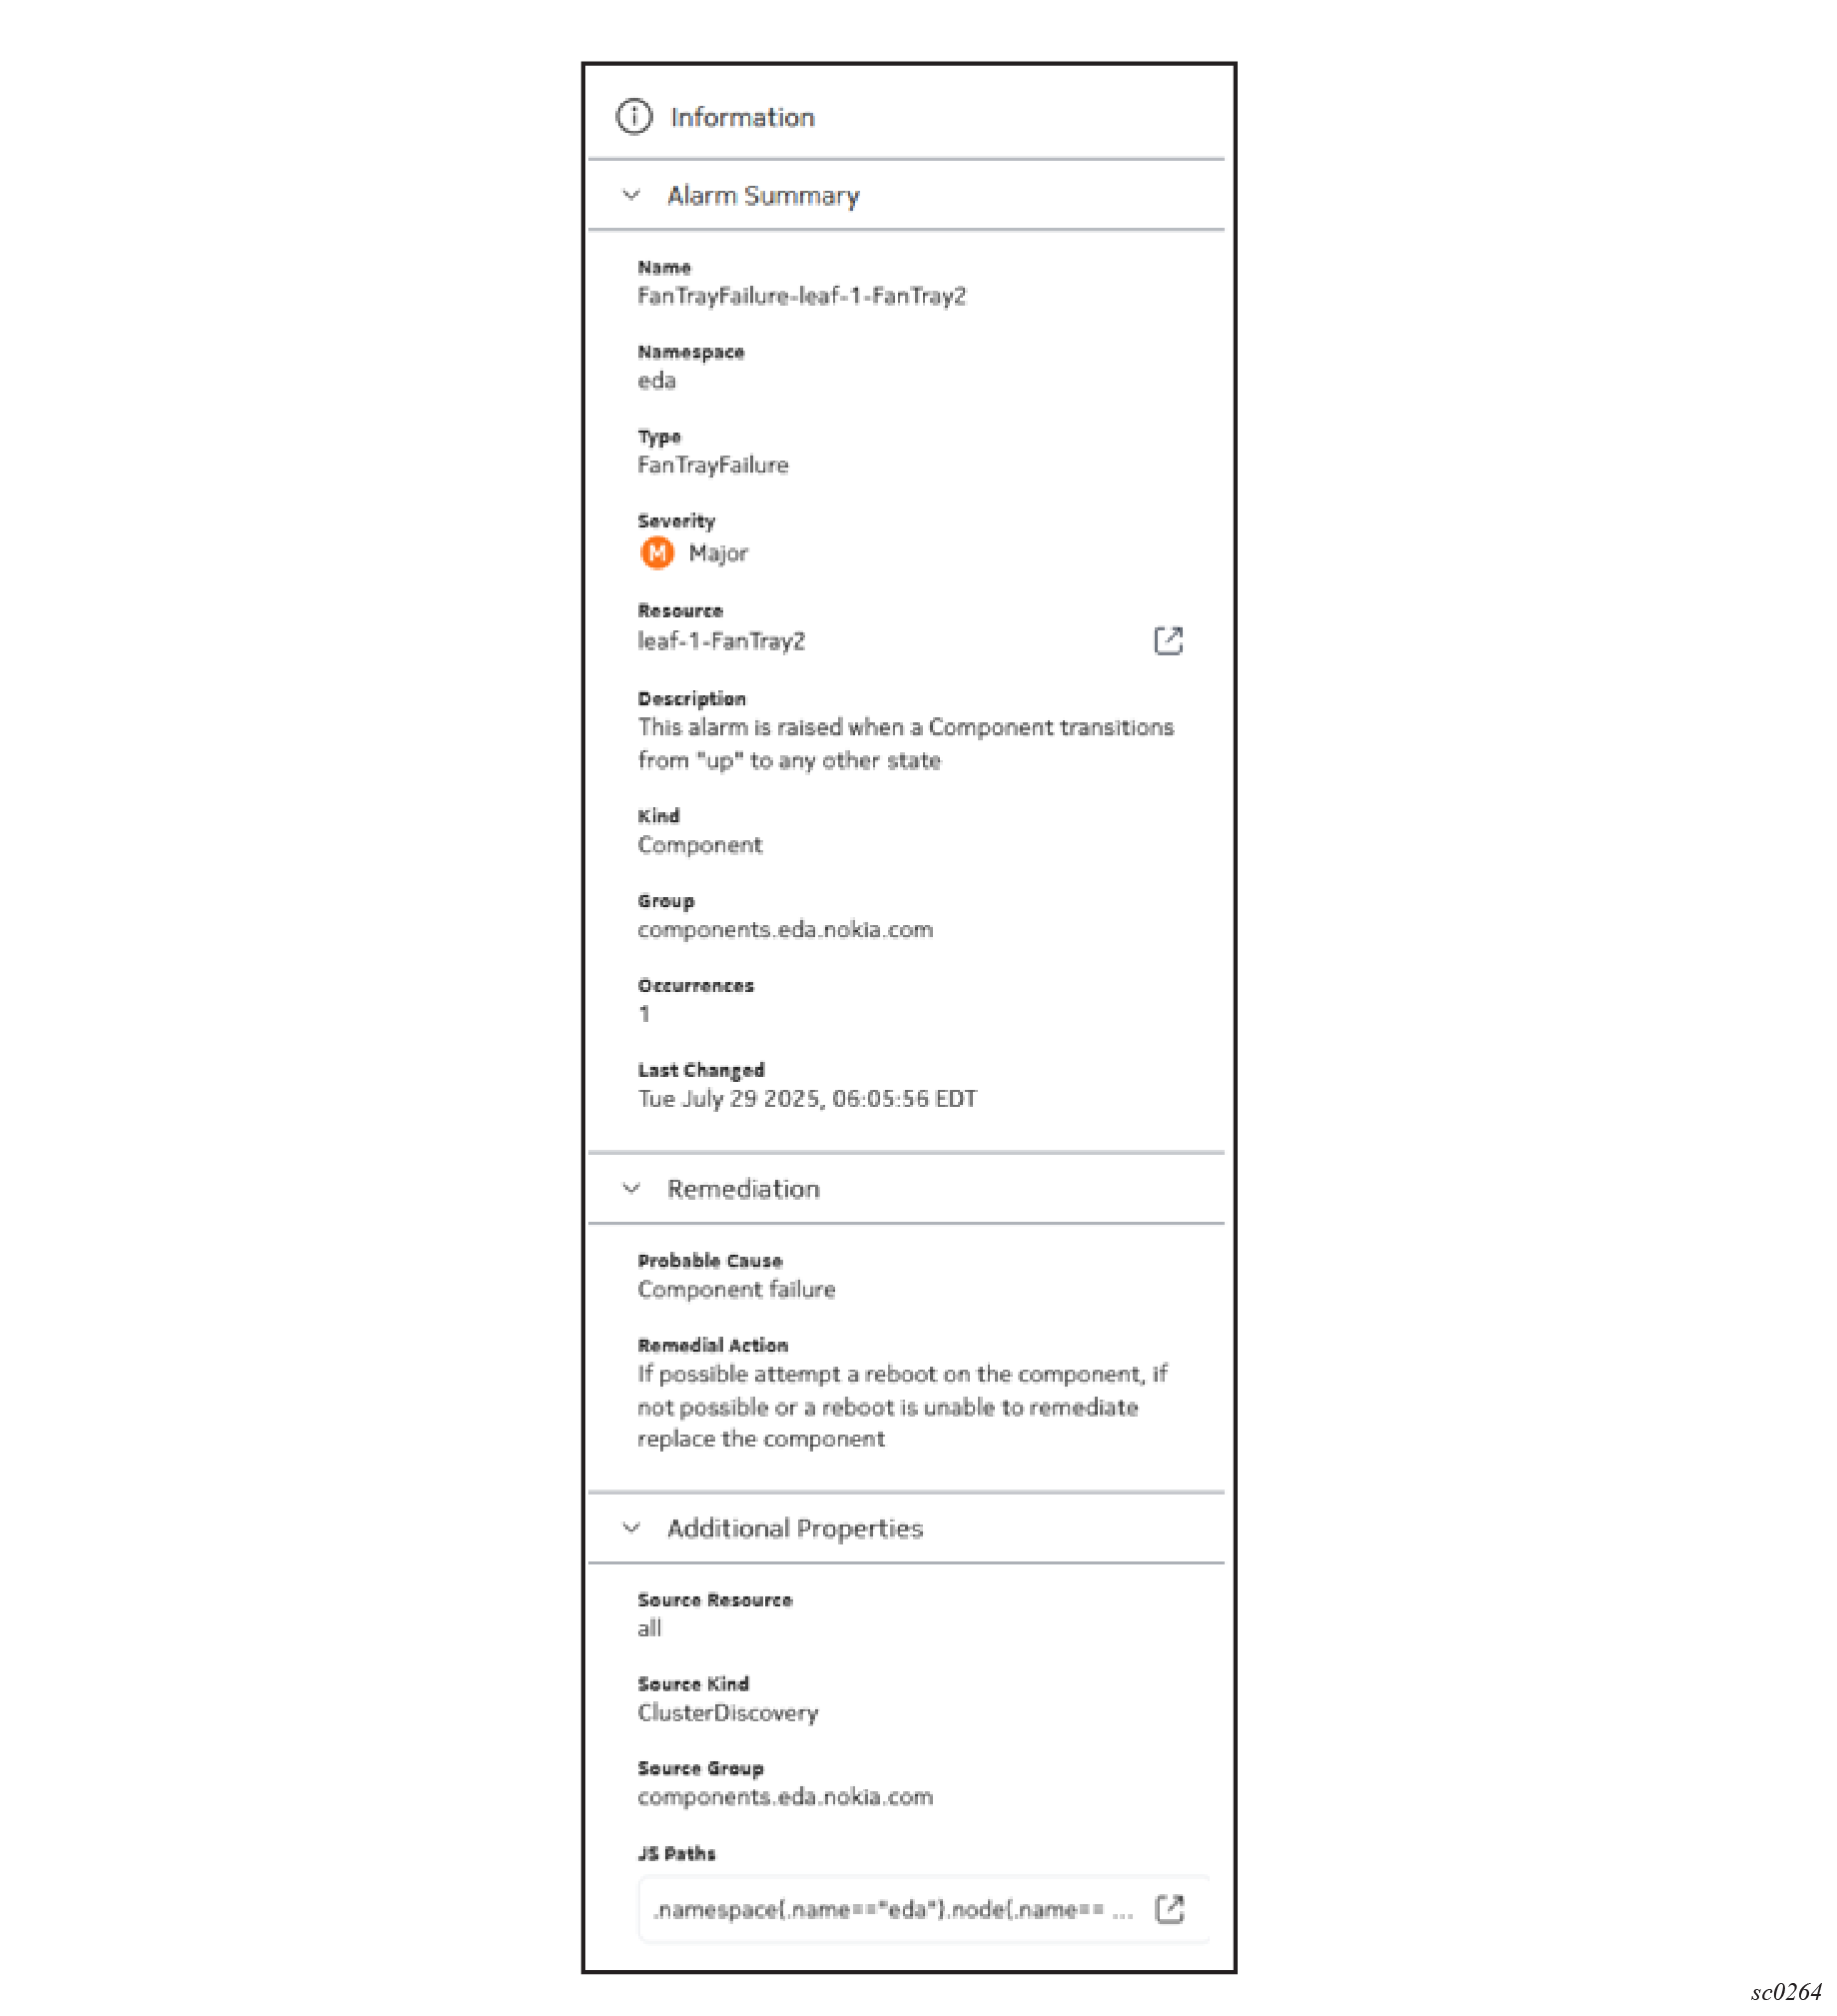
- Alarm Summary – includes Name, Namespace, Type, Severity, Cleared, Resource, Description, Kind, Group, Occurrences, Acknowledged, and Last Changed fields
- Remediation – includes Parent Alarms, Probable Cause, and Remedial Action fields
- Additional Properties – includes Acknowledged Until, Last Acknowledged, Suppressed, Suppressed Until, Last Suppressed, Source Resource, Source Kind, Source Group, and JS Path fields
Fields that are empty or not applicable are hidden.
| Location | Description |
|---|---|
|
Displays the resource information for the selected alarm. Click Go to resource to view the details of the alarm resource. |
|
|
Displays the parent alarm of the selected alarm. Click Go to parent alarm to display the Details page for the parent alarm of the selected alarm. |
|
|
Displays the JS path for the selected alarm. Click Go to Query Builder to display the Query Builder page for the selected alarm. |
Sample core alarms
| Property | Description |
|---|---|
| Name | RepositoryReachabilityDown-<cluster>-<server-name>-<repo-type>-<source> |
| Severity | Critical |
| Description | Connectivity between <source-kind> "<source>" and the "<repo-type>" repository at "<server-uri/remote-path>" is down. This alarm is raised after three failures to connect to a repository, where each attempt is made at a 15s interval. After three failures the alarm is generated (so after 45s) and is cleared on a connection attempt succeeding. |
| Probable cause | Connectivity issues, Kubernetes CNI misconfiguration, or credential/TLS misconfiguration/expiration. |
| Remedial action | Restore connectivity between the corresponding <source-kind> and apps repository/Git server. Ensure credentials and proxy configuration are correct, and any offered certificates are trusted. |
|
|
| Property | Description |
|---|---|
| Name | ServiceReachabilityDown-<cluster>-<service>-<source> |
| Severity | Critical |
| Description | Connectivity between <source-kind> "<source>" and the <kind> on "<service>" is down. |
| Probable cause | Connectivity issues between worker nodes in the Kubernetes cluster, Kubernetes CNI misconfiguration, pod failure, or TLS misconfiguration/expiration. |
| Remedial action | Restore connectivity between the corresponding source and destination. Ensure credentials and proxy configuration are correct (typically using no proxy for inter-cluster HTTPS), and certificate validity. |
|
|
| Property | Description |
|---|---|
| Name | PodNotRunning-<cluster>-<pod> |
| Severity | Critical |
| Description | Pod "<pod>" is not in the "Running" state. Any functionality provided by this pod is not available. This alarm can be raised transiently at system startup. |
| Probable cause | Kubernetes controller or registry reachability issues, worker node failure, initial instantiation. |
| Remedial action | Validate reachability to the registry used to pull the image for the specified pod, ensure no worker node, storage, or networking issues exist that would cause the Kubernetes controller to mark the pod in any state other than "Running". |
|
|
| Property | Description |
|---|---|
| Name | DeploymentDegraded-<cluster>-<deployment> |
| Severity | Critical |
| Description | Deployment "<deployment>" has at least one replica not in the "Running" state. Depending on the application this may result in loss of functionality or loss of service capacity. This alarm can be raised transiently at system startup. |
| Probable cause | Kubernetes infrastructure issues, worker node failure, initial instantiation. |
| Remedial action | Validate reachability to the registry used to pull images for any failed pods in the Deployment, ensure no worker node, storage, or networking issues exist that would cause the Kubernetes controller to mark pods in any state other than "Running". |
|
|
| Property | Description |
|---|---|
| Name | DeploymentDown-<cluster>-<deployment> |
| Severity | Critical |
| Description | Deployment "<deployment>" is down, with no pods in the "Running" state. Any functionality provided by the Deployment is not available. This alarm can be raised transiently at system startup. |
| Probable cause | Kubernetes infrastructure issues, worker node failure, initial instantiation. |
| Remedial action | Validate reachability to the registry used to pull images for failed pods in the Deployment, ensure no worker node, storage, or networking issues exist that would cause the Kubernetes controller to mark pods in any state other than "Running". |
|
|
| Property | Description |
|---|---|
| Name | NPPDown-<cluster>-<npp> |
| Severity | Critical |
| Description | Connectivity between ConfigEngine "<config-engine>" and the NPP "<npp>" is down. This results in no new transactions succeeding to targets served by this NPP (unless operating in null mode), and no telemetry updates being received. Effectively targets served by this NPP are offline. Look for a corresponding PodNotRunning alarm. |
| Probable cause | Connectivity issues between worker nodes in the Kubernetes cluster, Kubernetes CNI misconfiguration, pod failure, or TLS misconfiguration/expiration. |
| Remedial action | Restore connectivity between the corresponding ConfigEngine and the destination NPP. Ensure credentials and proxy configuration is correct (typically using no proxy for inter-cluster HTTPS), and certificate validity. |
|
|
| Property | Description |
|---|---|
| Name | PoolThresholdExceeded-<pool-type>-<pool-name>-<pool-instance> |
| Severity | Varies; see definitions |
| Description | The "<pool-instance>" instance of the <pool-type> "<pool-name>" has crossed the <severity> threshold of <threshold>. |
| Probable cause | Pool utilization. |
| Remedial action | Expand the pool via growing a segment or add additional segments. Additionally, you may move pool consumers to a different pool. |
|
|
| Property | Description |
|---|---|
| Name | StateEngineReachabilityDown-<state-engine>-<state-controller> |
| Severity | Critical |
| Description | Connectivity between State Controller "<state-controller>" and the State Engine "<state-engine>" is down. This results in no new state application instances being deployed to the corresponding State Engine, and the rebalancing of already-pinned instances to other State Engines. This connectivity is also used to distribute the map of shards to State Engine, meaning the corresponding State Engine is not receiving shard updates (assuming it is still running). |
| Probable cause | Connectivity issues between worker nodes in the Kubernetes cluster, Kubernetes CNI misconfiguration, pod failure, or TLS misconfiguration/expiration. |
| Remedial action | Restore connectivity between the corresponding State Controller and the destination State Engine. Ensure credentials and proxy configuration are correct (typically using no proxy for inter-cluster HTTPS), and certificate validity. |
|
|
Viewing alarms
- is sorted first by "Severity", and then by the "last changed" timestamp in descending order (most recent change first)
- hides any suppressed alarms
- In the EDA main menu, select Alarms to open the Alarms page.
-
To include suppressed alarms (which are hidden by default), do the
following:
- Click the More icon at the upper right of the Alarms page.
- Select Show All Alarms from the displayed list.
-
To exclude suppressed alarms from the list, do the following:
- Click the More icon at the upper right of the Alarms page.
- Select Hide suppressed alarms from the displayed list.
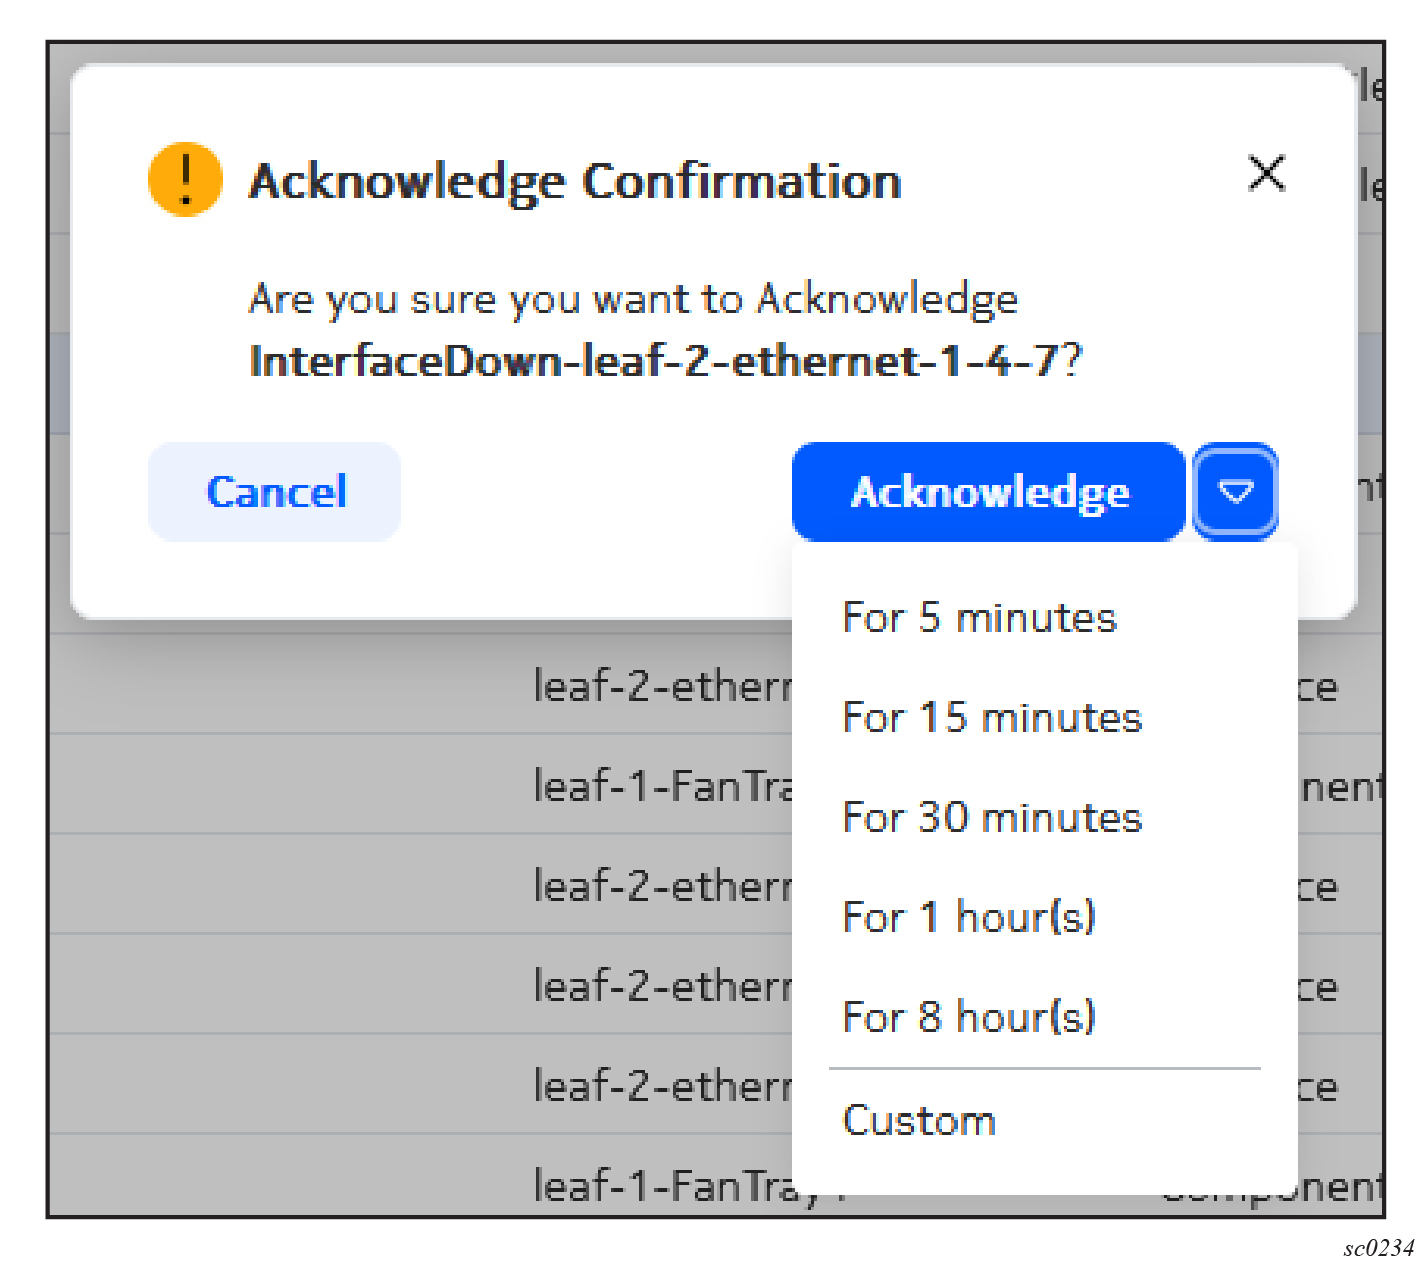
Acknowledging an alarm
- Acknowledge the alarm permanently.
- Acknowledge the alarm temporarily, after which the alarm returns to its unacknowledged state.
- In the EDA main menu, select Alarms to open the Alarms page.
- Find the alarm in the list using the sorting and filtering controls.
- At the right side of the row, click the Table row actions button.
- Click Acknowledge from the list.
-
Optionally, you can choose to acknowledge the alarm only temporarily by doing
either of the following:
- Click the drop-down control and click one of the standard periods displayed.
- Click the drop-down control, then click Custom, and in the resulting window select a date and time for the acknowledgement to expire.
- Click Acknowledge to complete the acknowledgement of the alarm.
Acknowledge multiple alarms
- Acknowledge the alarms permanently
- Acknowledge the alarms temporarily, after which all of the selected alarms return to their unacknowledged state.
- In the EDA main menu, select Alarms to open the Alarms page.
- Use the sorting and filtering controls to display the necessary set of alarms in the list.
-
Select all of the alarms you want to acknowledge by checking the box at the
left edge of the list. Click the check box again to unselect any alarm.
Note: To select all alarms in the list, check the check box in the title row. Click the check box again to unselect all alarms in the list.Note: The number of alarms you have selected, as well as the total number of alarms, is indicated at the lower right of the Alarms page.
- At the upper right of the Alarms page, click the Table settings & actions button.
- Select Acknowledge from the list.
-
Optionally, you can choose to acknowledge the alarm only temporarily by doing
either of the following:
- Click the drop-down control and click one of the standard periods displayed.
- Click the drop-down control, then click Custom, and in the resulting window select a date and time for the acknowledgement to expire.
- Click Acknowledge to complete the acknowledgement of the selected alarms.
Deleting a single alarm
- In the EDA main menu, select Alarms to open the Alarms page.
- Find the alarm in the list using the sorting and filtering controls.
- At the right side of the row, click the Table row actions button.
-
Click Delete from the list.
Note: The Delete option is not displayed for an alarm that has not been cleared.
- Click Confirm to complete the acknowledgement.
Deleting multiple alarms
- In the EDA main menu, select Alarms to open the Alarms page.
- Use the sorting and filtering controls to display the necessary set of alarms in the list.
-
Select all of the alarms you want to delete by checking the box at the left
edge of the list. Click the check box again to unselect any alarm.
Note: To select all alarms in the list, check the check box in the title row. Click the check box again to unselect all alarms in the list.Note: The number of alarms you have selected, as well as the total number of alarms, is indicated at the lower right of the Alarms page.
- At the upper right of the Alarms page, click the Table settings & actions button.
- Click Delete in the list.
-
Click Confirm to complete the acknowledgement for all
alarms.
Note: If some of the alarms you selected were not eligible for deletion, only those that were eligible are deleted by this operation. Ineligible alarms are not deleted. No error message displays in this case.
Suppressing a single alarm
- Suppress the alarm permanently.
- Suppress the alarm temporarily, after which the alarm returns to its unsuppressed state.
- In the EDA main menu, select Alarms to open the Alarms page.
- Find the alarm in the list using the sorting and filtering controls.
- At the right side of the row, click the Table row actions button.
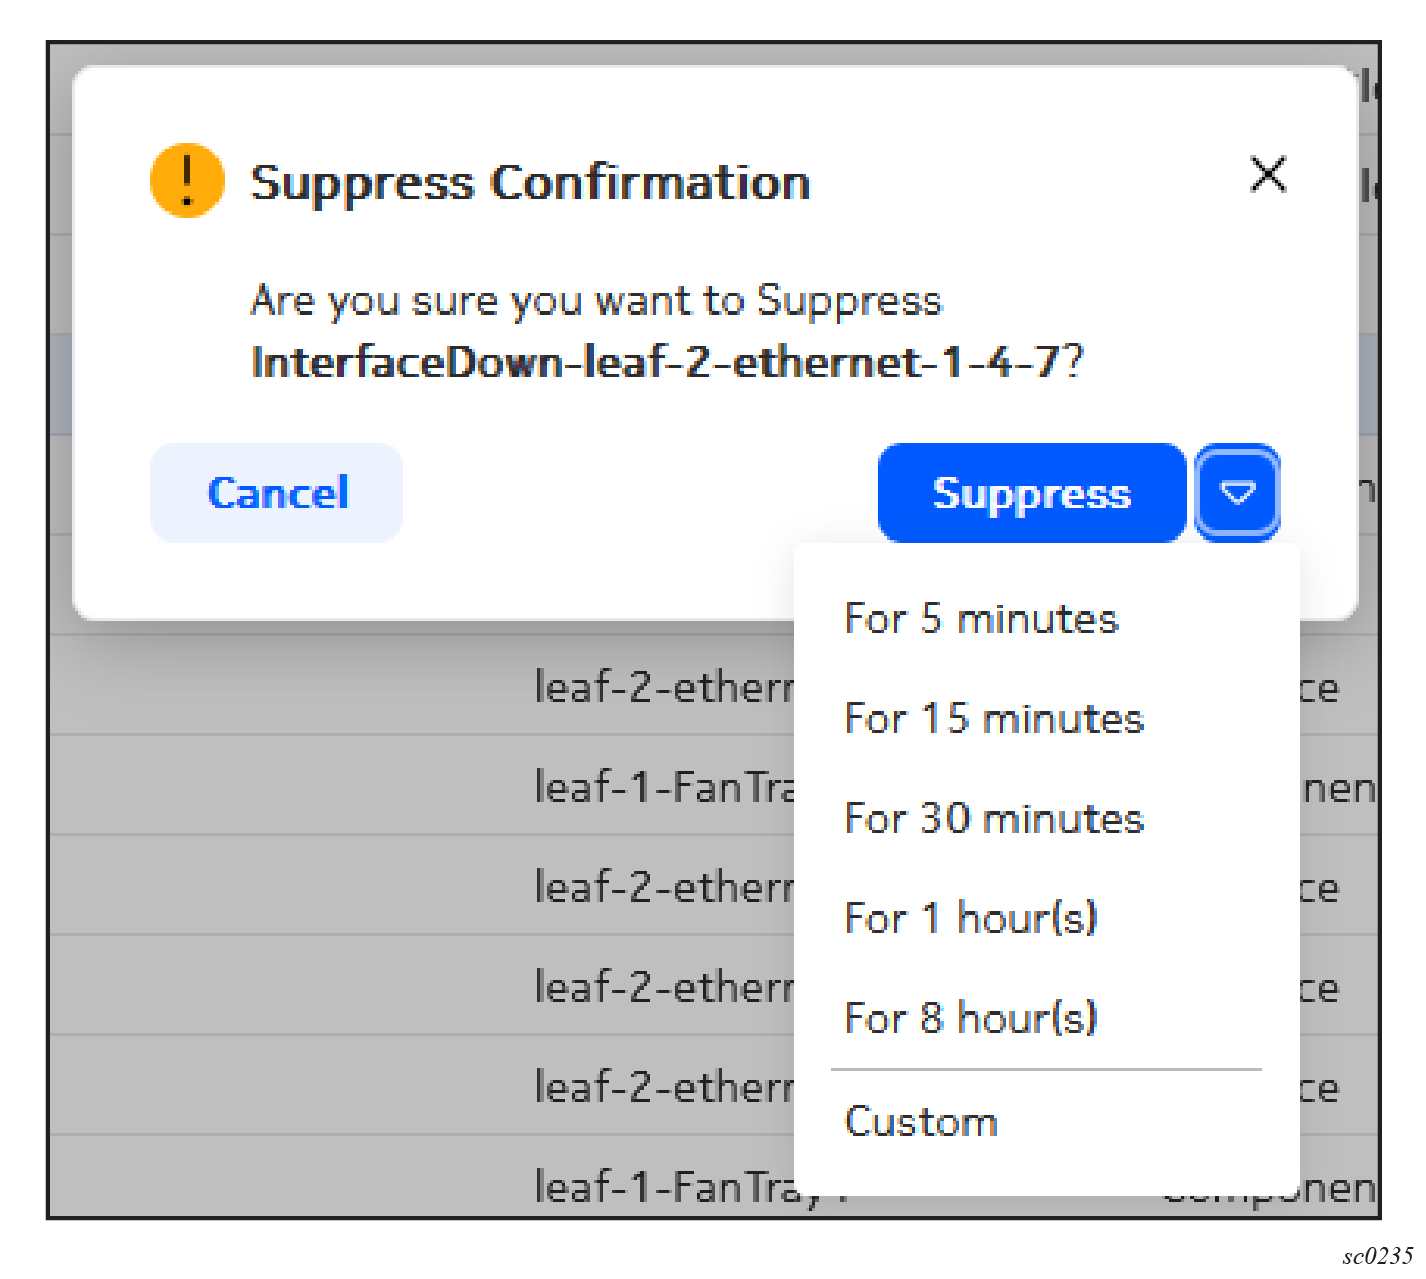
- Click Suppress from the list.
-
Optionally, you can choose to suppress the alarm only temporarily by doing
either of the following:
- Click the drop-down control and click one of the standard periods displayed.
- Click the drop-down control, then click Custom, and in the resulting window select a date and time for the suppression to expire.
-
Click Confirm to complete the alarm suppression.
Note: By default, suppressed alarms are not displayed in the alarms list. Unless you have selected to show all alarms, suppressing an alarm causes it to vanish from the alarms list.
Suppressing multiple alarms
- Suppress the alarms permanently
- Suppress the alarms temporarily, after which all of the selected alarms return to their unsuppressed state.
- In the EDA main menu, select Alarms to open the Alarms page.
- Use the sorting and filtering controls to display the necessary set of alarms in the list.
-
Select all of the alarms you want to delete by checking the box at the left
edge of the list. Click the check box again to unselect any alarm.
Note: To select all alarms in the list, check the check box in the title row. Click the check box again to unselect all alarms in the list.Note: The number of alarms you have selected, as well as the total number of alarms, is indicated at the lower right of the Alarms page.
- At the upper right of the Alarms page, click the Table settings & actions button.
- Select Suppress from the list.
-
Optionally, you can choose to suppress the alarm only temporarily by doing
either of the following:
- Click the drop-down control and click one of the standard periods displayed.
- Click the drop-down control, then click Custom, and in the resulting window select a date and time for the suppression to expire.
-
Click Confirm to complete the suppression for all
alarms.
Note: By default, suppressed alarms are not displayed in the alarms list. Unless you have selected to show all alarms, suppressing alarms causes them to vanish from the alarms list.
Viewing alarm details
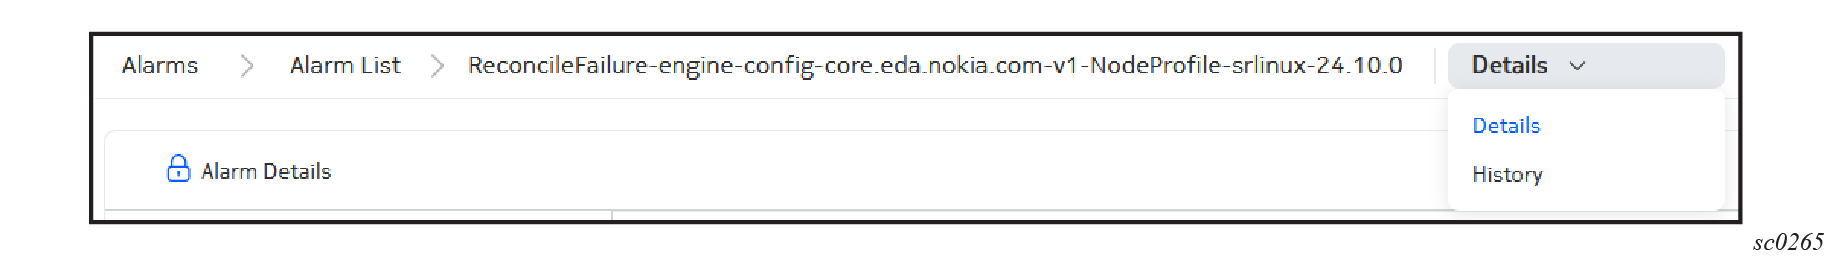
You can switch between the Alarm Details page and the Alarm History pages by selecting Details or History from the drop-down list at the upper right of the page.
The bread crumb path allows you to navigate from the Alarms Summary page to the Alarms Details or History page.
- In the EDA main menu, select Alarms to open the Alarms page.
- Find the alarm in the list using the sorting and filtering controls.
-
Double-click the alarm.
EDA opens the Alarm Details page, which shows the Alarm Summary information including the following grouped fields:
- Alarm Summary – includes Name, Namespace, Type, Severity, Cleared, Resource, Description, Kind, Group, Occurrences, Acknowledged, and Last Changed fields
- Remediation – includes Parent Alarms, Probable Cause, and Remedial Action fields
- Additional Properties – includes Acknowledged Until, Last Acknowledged, Suppressed, Suppressed Until, Last Suppressed, Source Resource, Source Kind, Source Group, and JS Path fields
Fields that are empty or not applicable are hidden.
Viewing alarm history
You can switch between the Alarm History and the Alarm Details pages by selecting Details or History from the drop-down list at the upper right of the page.
The bread crumb path allows you to navigate from the Alarms Summary page to the Alarms Details or History page.
- In the EDA main menu, select Alarms to open the Alarms page.
- Find the alarm in the list using the sorting and filtering controls.
- At the right side of the row, click the Table row actions button.
-
Click
History from the list.
EDA opens the Alarm History window, which shows all events pertaining to the selected alarm including the following details:
- Cleared (true/false)
- Last change date and time
- Probable cause
- Remedial action
- Acknowledged (true/false)
- History of users who acknowledged