Topology
A common visualization used to describe relationships between structures is a graph or topology diagram. A topology consists of a set of nodes, links, and endpoints, with one or more toggle-able overlays and badges to indicate various types of status for the displayed objects.
A node in the topology is an anchor for endpoints, and the relationship between endpoints is described using links.
In EDA, a topology can represent the relationships between any set of resources that have
a structured relationship. The most common form of this is a physical topology, which
EDA uses to illustrate how managed TopoNode resources interact with
each other using TopoLink resources.
The most common topology visualization, and the one currently supported by EDA, is a tree in which:
- Nodes and links are included in the tree
- Each level of the tree is denoted as a "tier"
- A tier may have one or more groups of resources
- Relationships between tiers are drawn based on links present
Nodes
In a physical topology, a node is simply a termination point for endpoints. For example, in a data center a topology can be represented using:
- A leaf switch that is abstracted using a
TopoNode, which becomes a "node" in the topology. - The interface connecting to a spine is abstracted using an
Interface, which becomes an "endpoint" in the topology. - The physical cable plugged into the interface is abstracted using a
TopoLink, which becomes the "link" in the topology.
Within the EDA GUI's topology display, nodes can display badges and adopt a particular shading based on a selected overlay.
Links
Any links with endpoints on nodes selected is drawn as links connecting those nodes in the topology illustration. Other links may extend into an abstract "edge" icon.
Endpoints
An endpoint is one end of a link, and is commonly used in physical topologies.
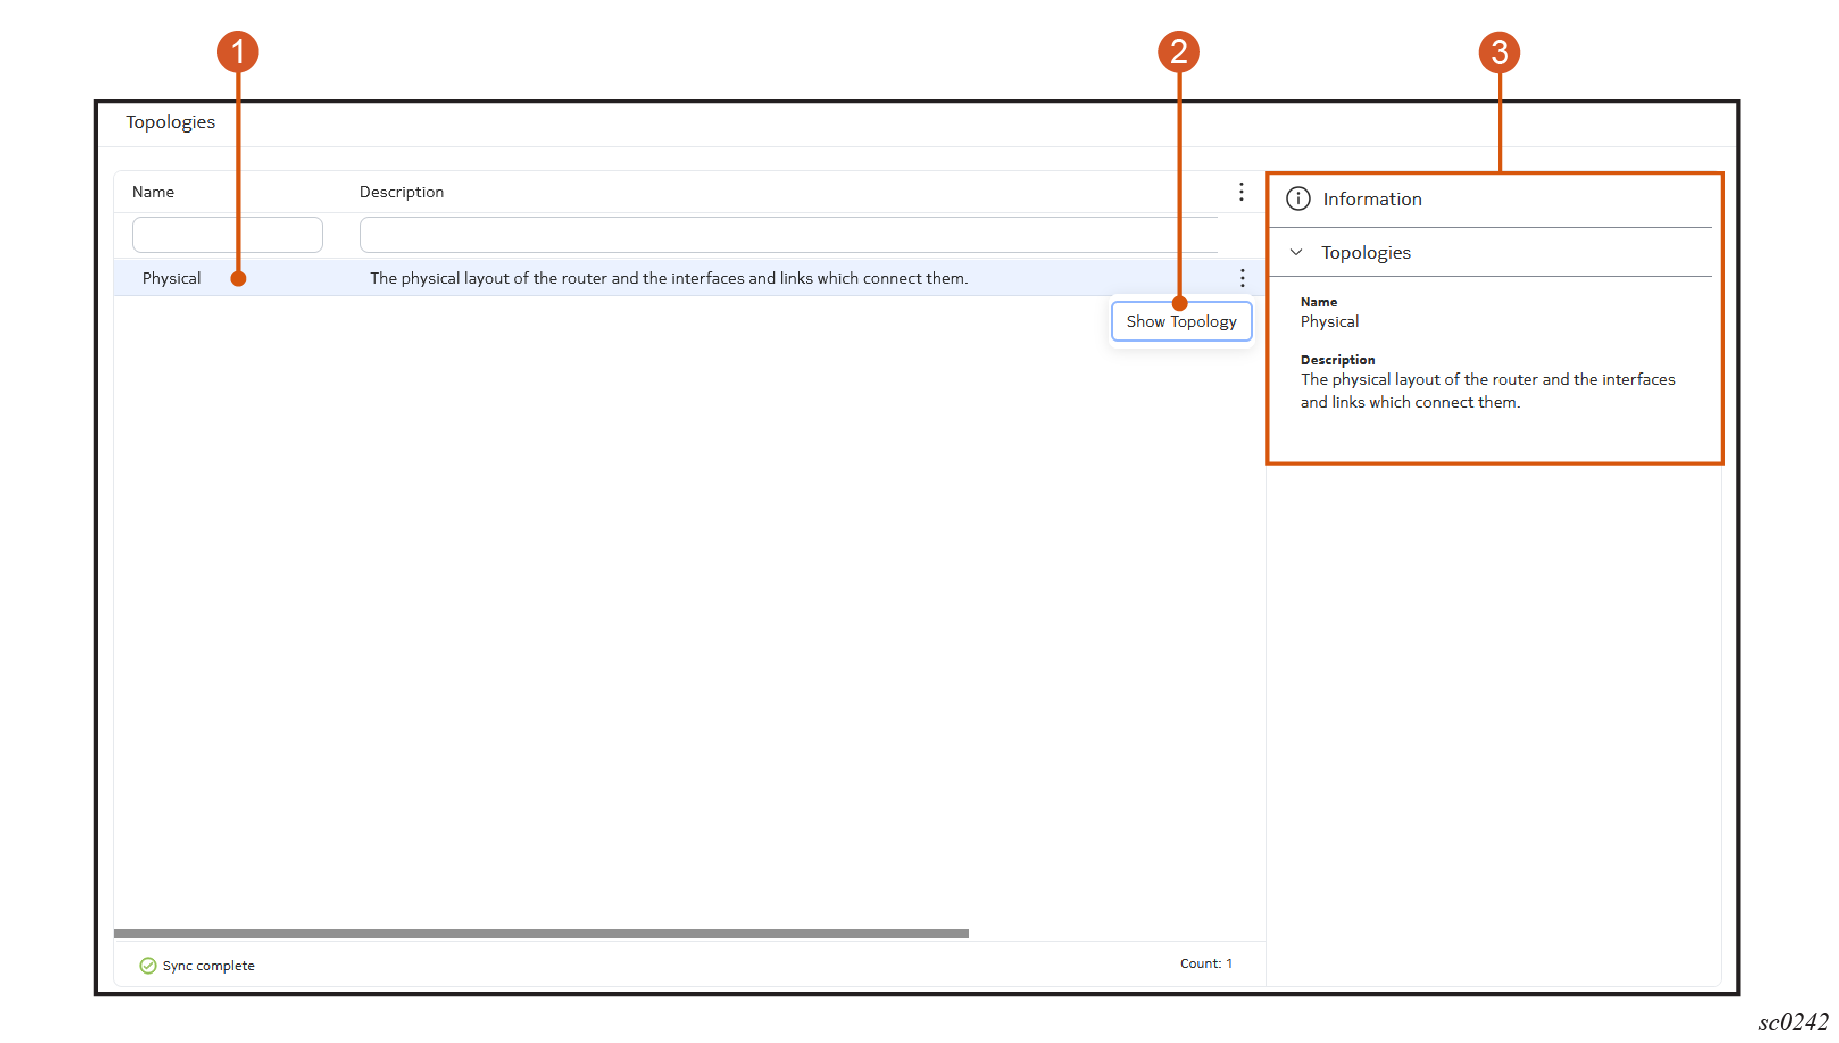
The Topologies page
You can view the topology page by selecting Topologies in EDA's main menu.
| # | Name | Function |
|---|---|---|
| 1 | Topology list | Select an available topology. Currently, the Physical topology is supported. |
| 2 | Table row action list | Select to take an action for the current row. Currently the Show Topology action is supported. |
| 3 | Information panel | Like most pages of the EDA GUI, the Topologies list includes an information panel that displays details about the currently selected object. |
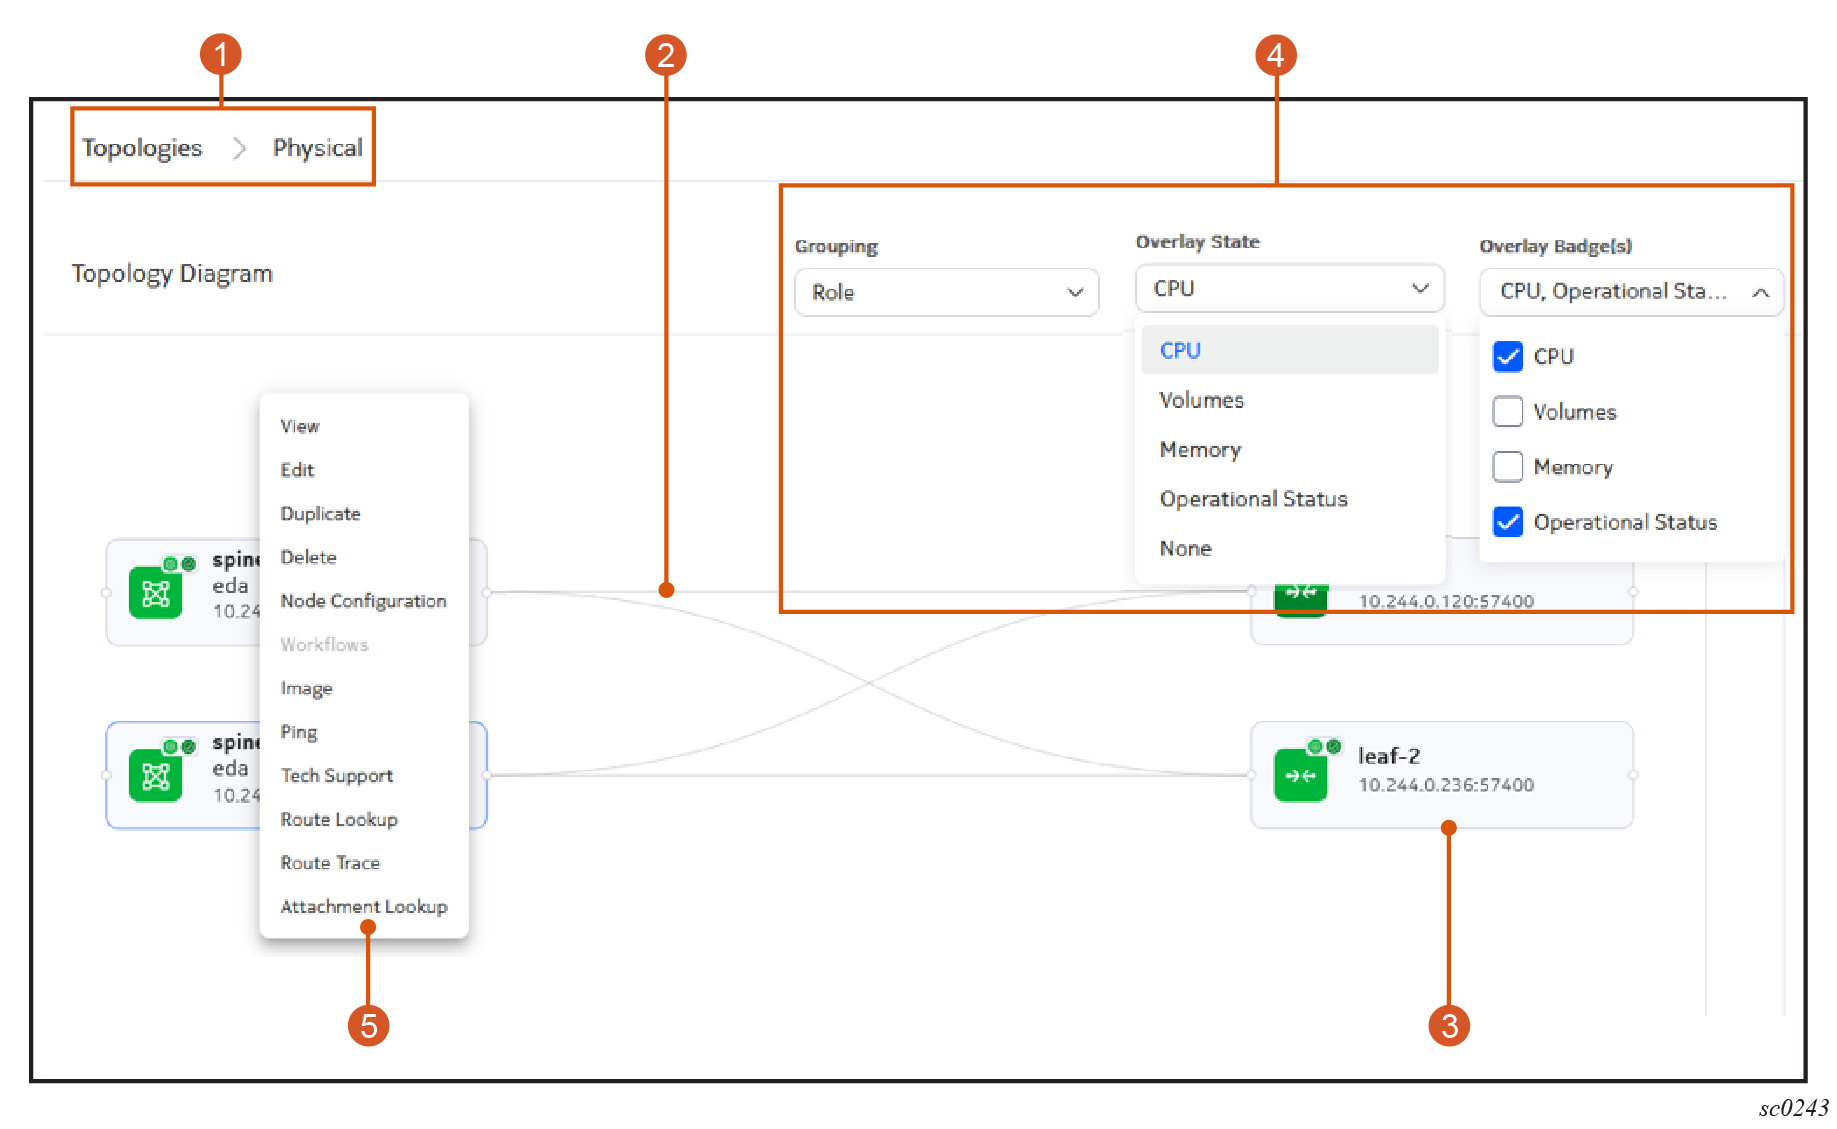
The topology illustration
When you select Show Topology from the actions on the Topologies page, EDA displays a graphical representation of the topology including nodes and links.
| # | Name | Function |
|---|---|---|
| 1 | Topology breadcrumb | Displays the name of the topology currently being displayed. You can click Topologies to return to the Topologies page. |
| 2 | Links | These are examples of links within the topology. Click on any link to view details about that link, the connected nodes, and the link endpoints in the Information panel. |
| 3 | Node | This is an example of a node within the topology. Click on any node to view details about that node in the Information panel. Right-click on any node to access the standard node actions menu. |
| 4 | Grouping, Overlay, and Badge selectors | Use this drop-down list to:
Each overlay applies shading to the topology illustration to indicate the related status of all nodes and links. Badges display on the nodes within the topology, and the badge icon and color indicate the related status of each node. You can select up to three badges for inclusion in the Topology display. |
| 5 | Actions menu for nodes | Right-clicking on a node opens a menu for standard node actions. See the documentation for node management for details about these actions. |
Grouping
The Grouping selection determines how elements within the topology are arranged within the topology diagram.
The Physical Topology includes one grouping, named Role, by default. To customize the physical topology grouping, create or edit TopologyGrouping resources via Kubernetes.
- eda.nokia.com/role=backbone
- eda.nokia.com/role=superspine
- eda.nokia.com/role=leaf
- eda.nokia.com/role=borderleaf
Grouping can also control how multiple nodes are consolidated into a single expandable node within the topology illustration.
Overlays
Information can be overlaid on a topology as either a state or as a badge. States shade the nodes and links of a topology with a color corresponding to the information. For example, EDA's Operational Status overlay shades nodes and link green for operationally up, and red for operationally down.
In EDA, you can toggle overlays on and off.
More details about the significance of overlay shading are available in the Information panel for each node.
Overlays may also include state information for topology endpoints. This is not represented in the graph, but is available in the Information panel by selecting the appropriate link.
- The CPU utilization overlay shades nodes based on the percentage of CPU capacity that is in use on the node.
- The Memory overlay shades nodes based on the percentage of memory that is in use on the node.
- The Volume overlay shades nodes based on the percentage of disk usage on the node.
- The LLDP overlay shades links based on the discovered peer or interface on each endpoint, and the correlation of this with each link, to ensure alignment. It thereby acts as a kind of topology intent check.
- The Operational Status overlay indicates the operational status of each TopoNode and TopoLink member in the topology. This status derived from the status of NPP connectivity to the node, and the operational state of underlying interfaces making up the TopoLink. As with other overlays, updates are constantly updated to reflect moment-by-moment status.
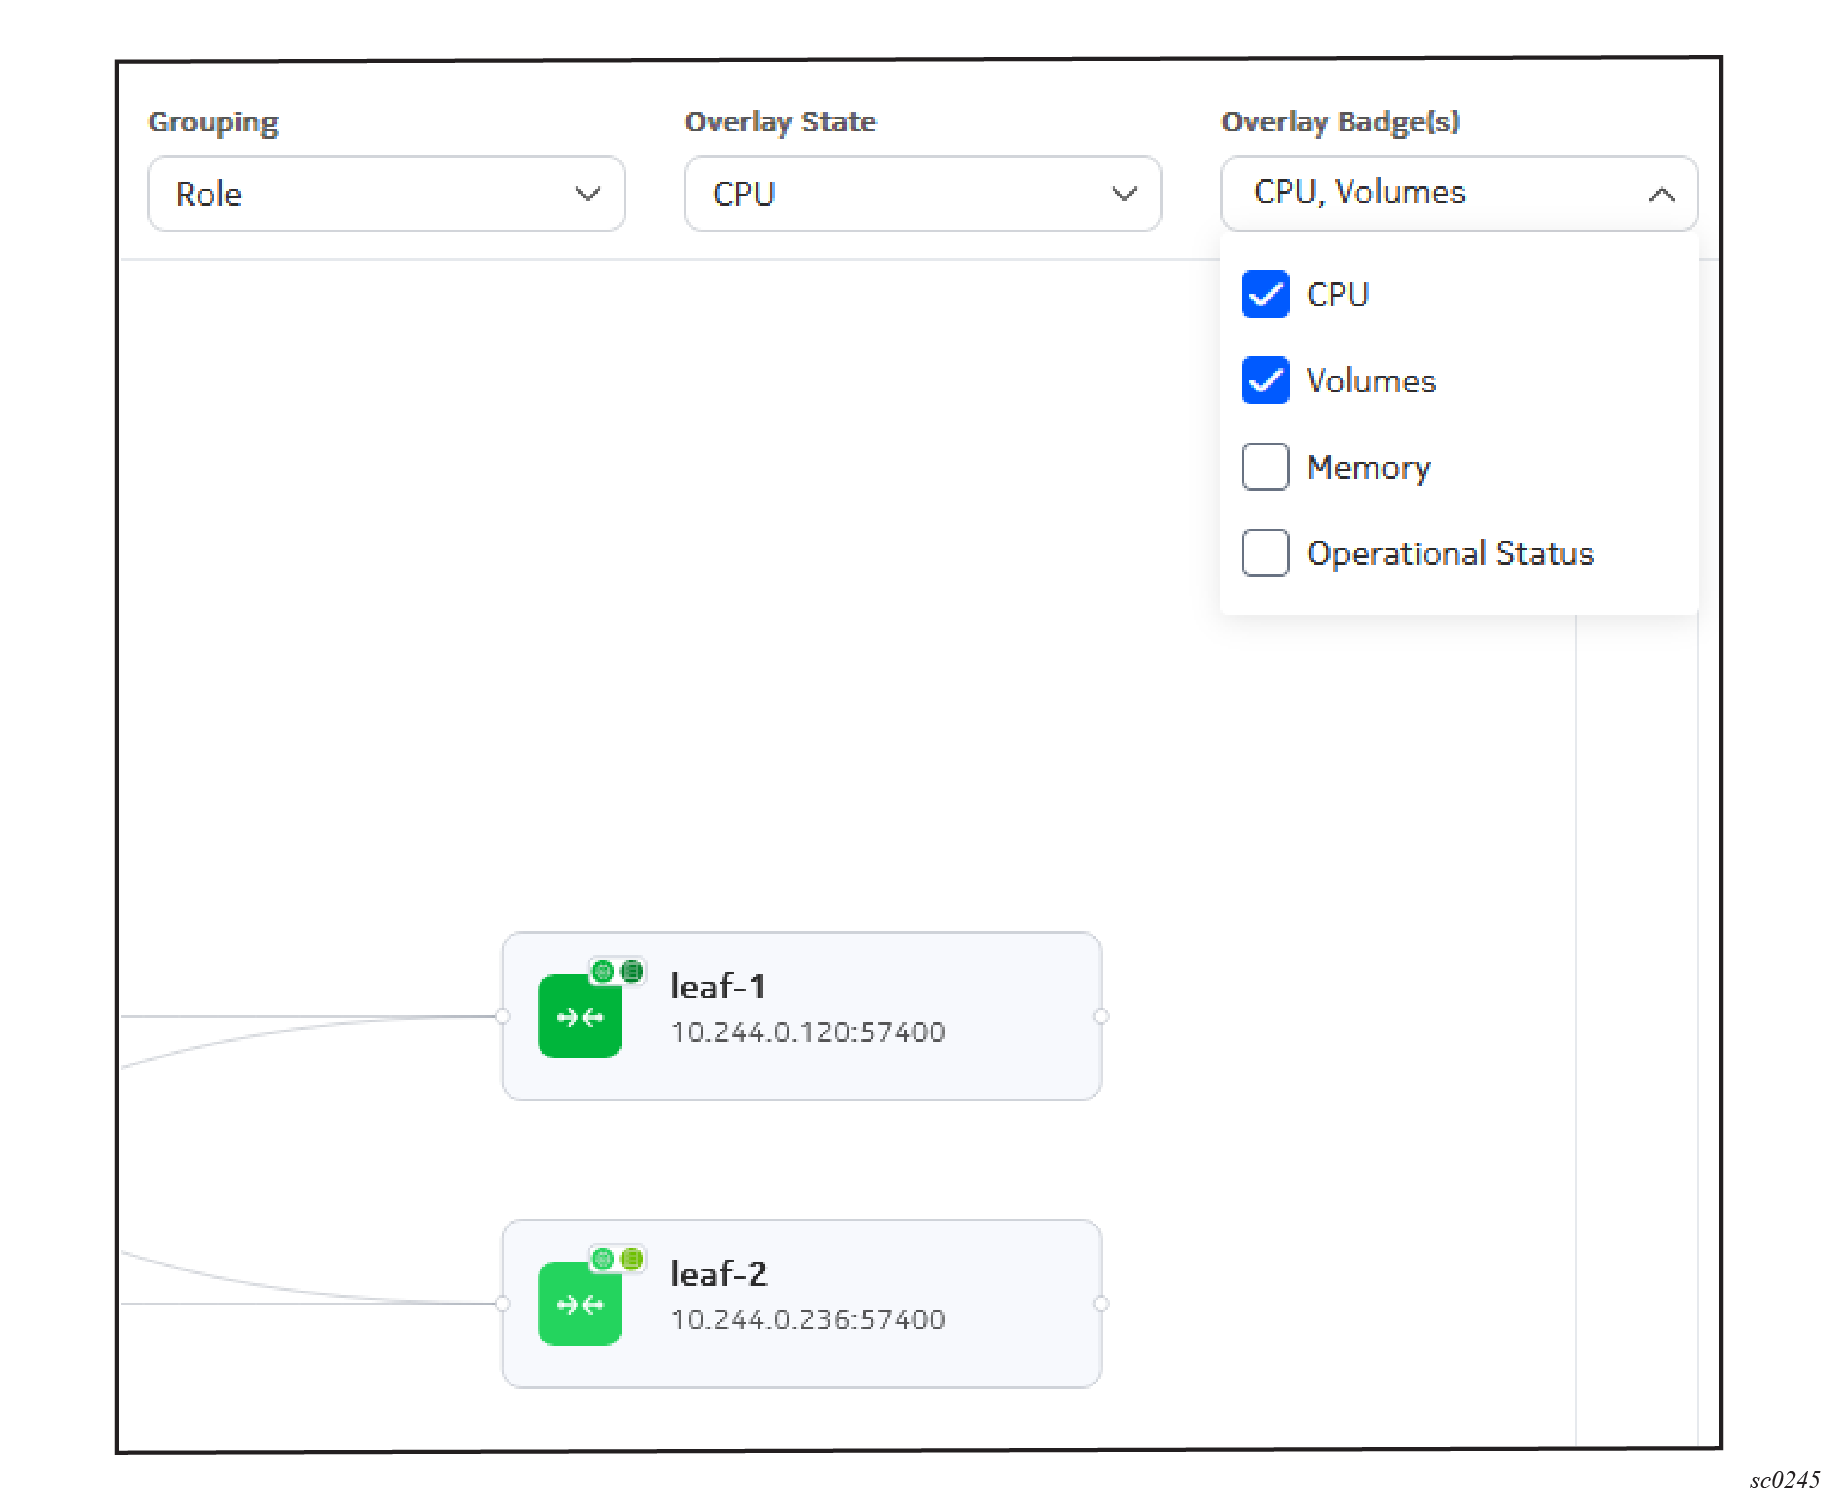
Overlay badges
Overlay badges are displayed only on nodes within the topology. You can select up to three badges to display simultaneously. Each badge consists of an icon or a single-digit character (to identify the information type) and a set of colors (to indicate status related to that information type). Where multiple badges are available and enabled, they display in a series at the upper right of the node image.
The Operational Status badge indicates the operational status of each TopoNode in the topology. This value is derived from the status of NPP connectivity to the node.
More details about the significance of a badge are available in the Information panel for a badged node.
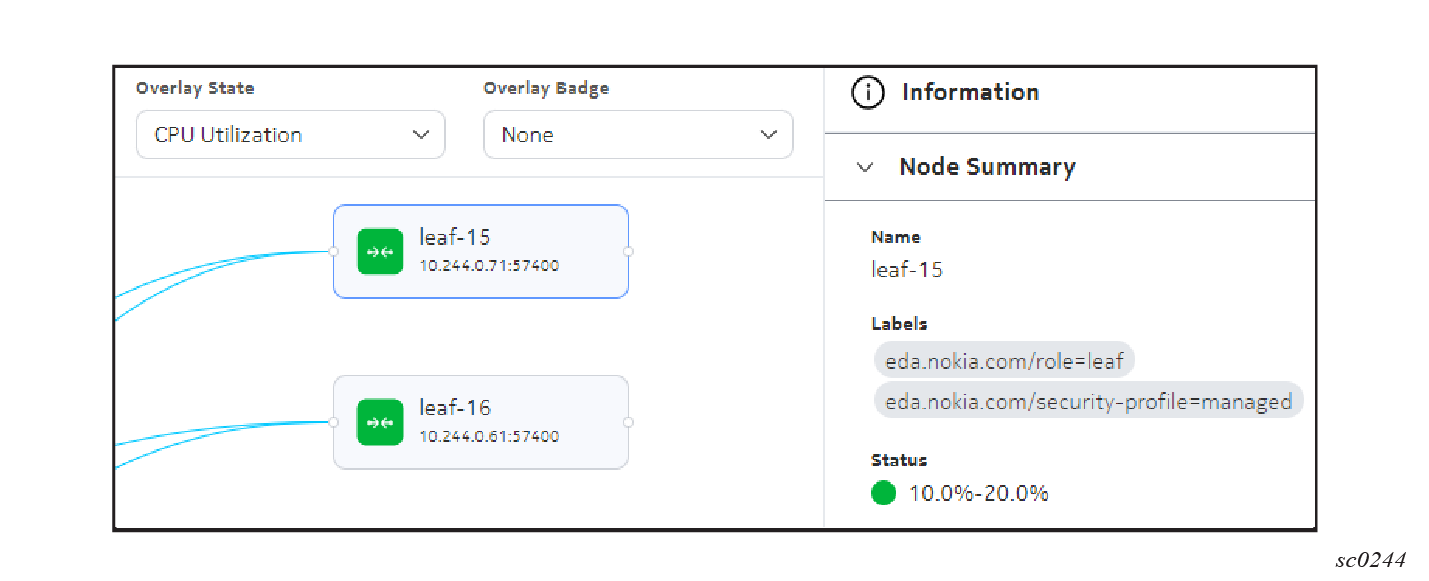
Information panel
As with many pages in the EDA GUI, an information panel is available on the right side of the topology illustration. Expand this panel to view detailed information about a selected object within the illustration.
For links, the information panel includes nested summaries for each selected link showing its endpoints. Actions are available through a contextual menu associated with each eligible object.
This can be a useful way to see the specific meaning of overlays shading or badges within the topology illustration.
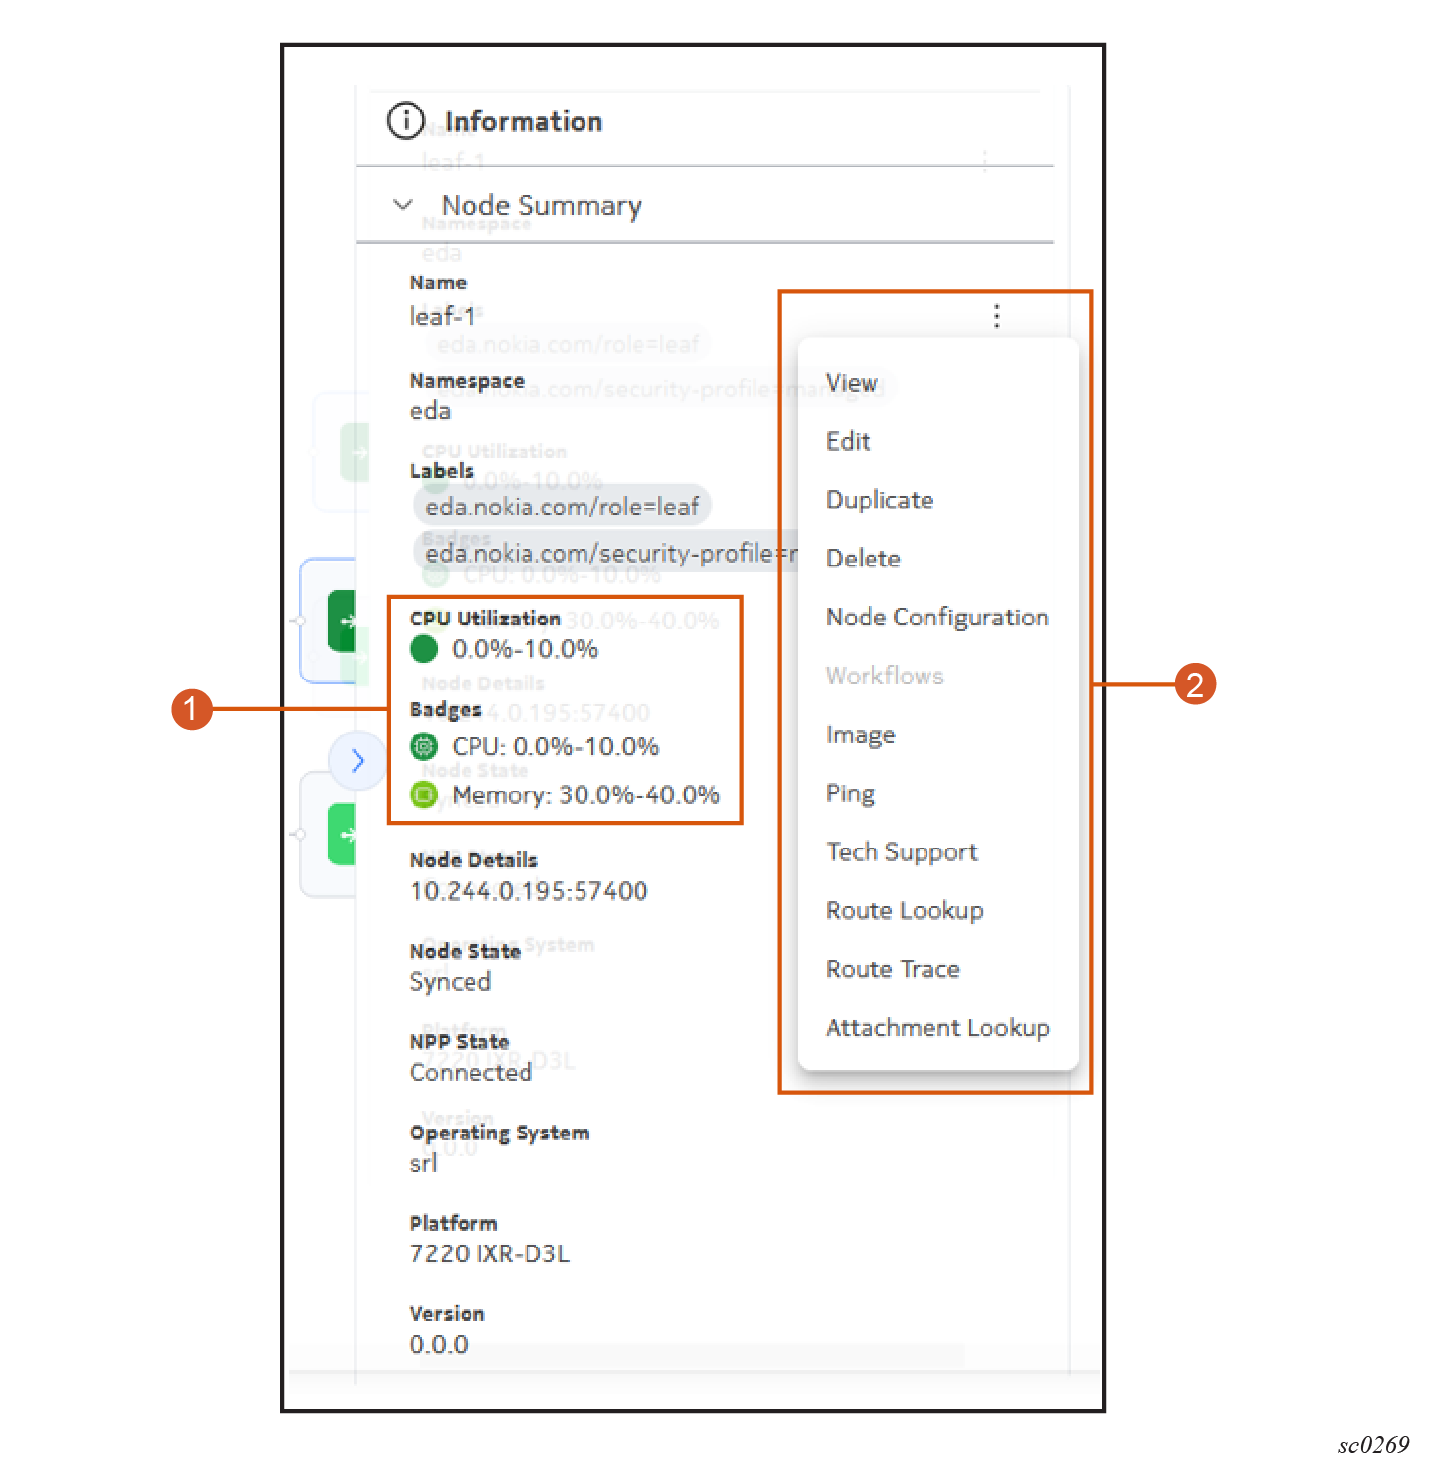
| # | Name | Function |
|---|---|---|
| 1 | Status indicators | If an overlay or badges are enabled, then the associated overlay or badge names are displayed here along with the current, associated status for the selected nodes. |
| 2 | Actions menu | The conventional menu for node actions is available from the information panel. Actions are applied to the selected node. See the documentation for node management for details about these actions. |
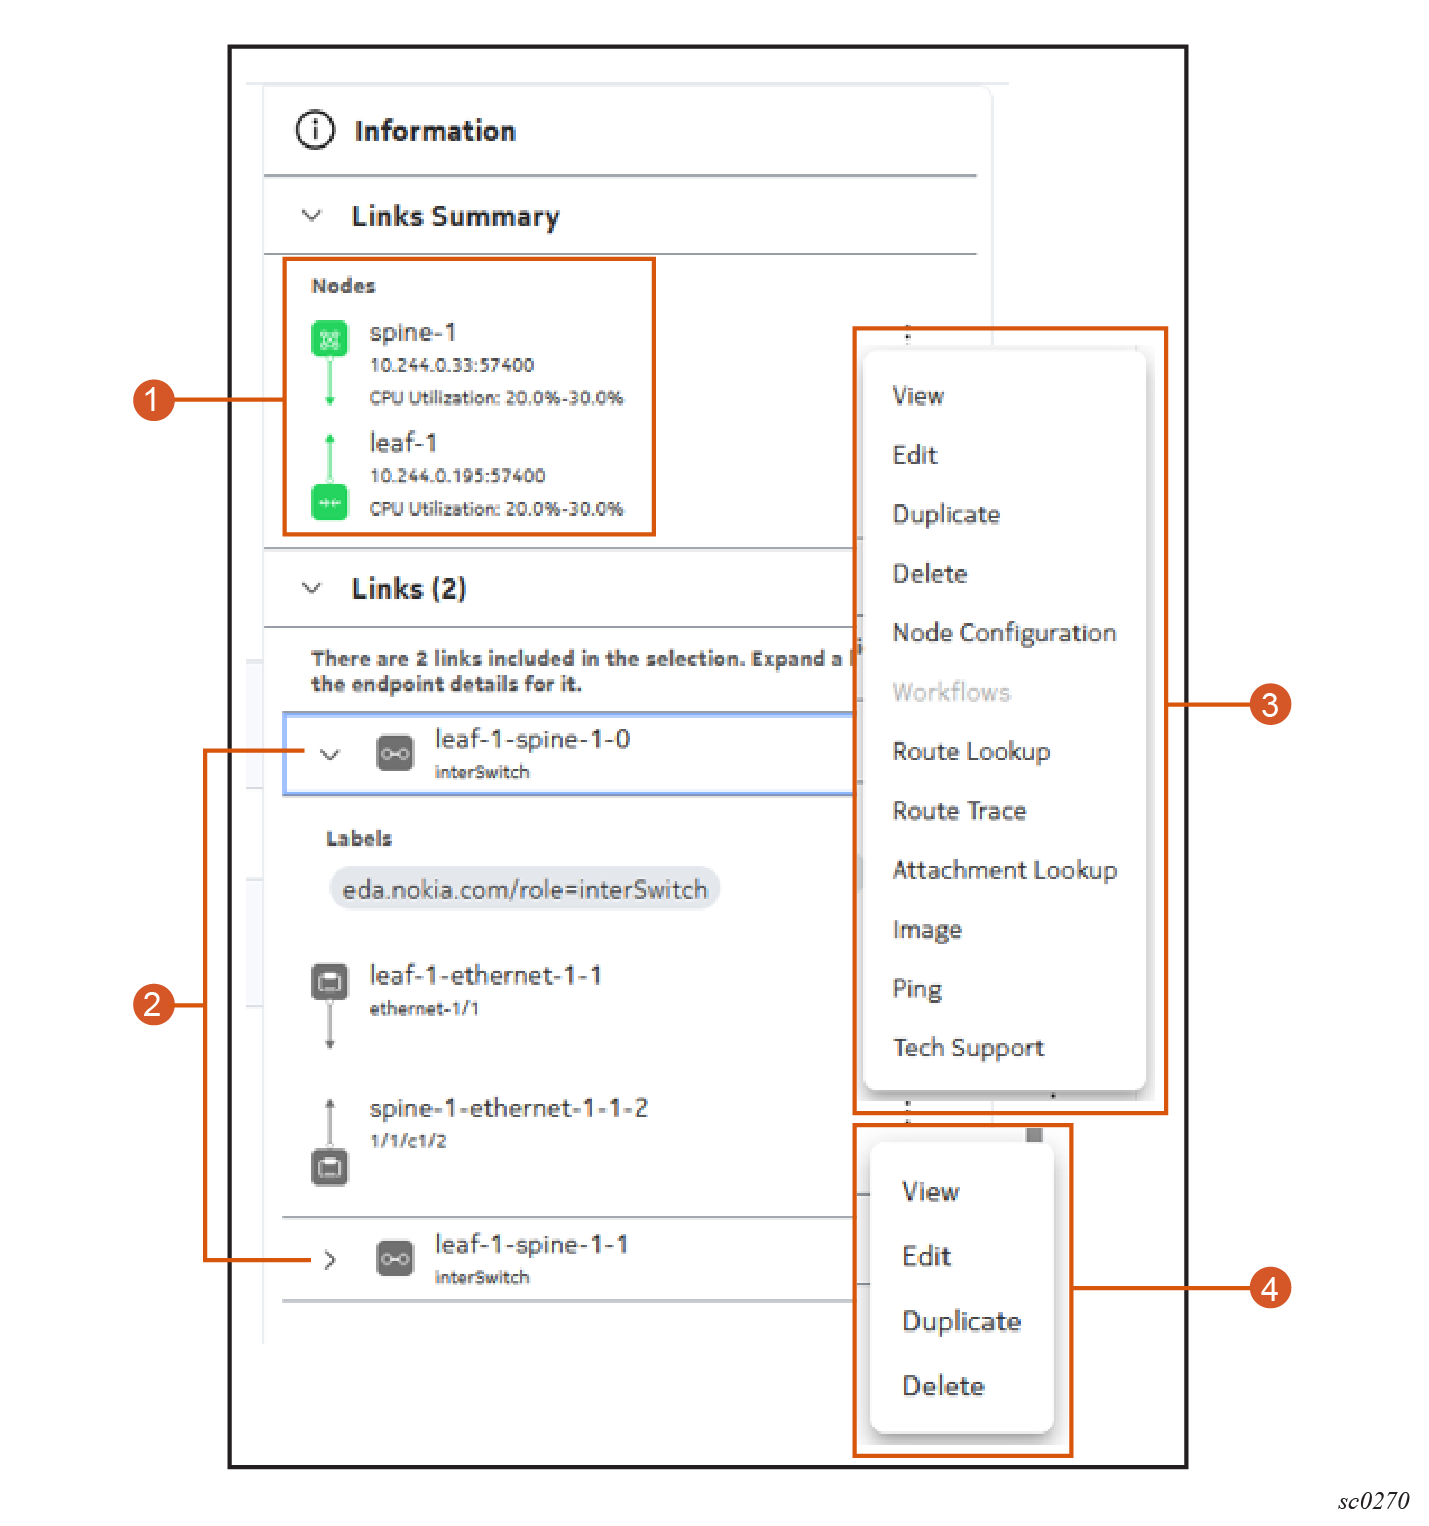
| # | Name | Function |
|---|---|---|
| 1 | Participating nodes | Nodes at either end of the selected link are identified here. If an overlay is selected, that information is included here as well. |
| 2 | Links | The selected links are listed here. Initially they are
collapsed. Expanding any link in the list displays details about its endpoint. |
| 3 | Node actions | A contextual action menu is available for displayed nodes |
| 4 | Link and endpoint actions | A contextual action menu is available for individual links (shown in the illustration) and endpoints (not shown). |
Viewing a topology
- From the EDA main menu, select Topologies to open the Topologies page, showing a list of supported topologies.
- Select a topology from the list.
-
Click the Table row actions icon at the right edge of
the list and select Show Topology from the actions
list.
The Topology Diagram displays, showing a graphical representation of the nodes and links within network topology.
-
Optionally, select an overlay by clicking the Overlay
State drop-down and selecting an overlay from the list.
Nodes in the topology illustration are shaded to signify their status with regard to the selected overlay data.
-
Optionally, select one or more badge types by clicking the
Overlay Badge drop-down and selecting up to three
badge types from the list.
Nodes in the topology illustration display corresponding badges, shaded to signify the nodes' status with respect to the selected badge data.
-
To view details about an individual node, select the node and then expand the
Information panel.
The panel shows:
- identifying information for the selected node
- overlay and badge status for the selected node
- an action menu that includes supported node actions
-
To view information about a link within the topology, click the link. If it is
not already expanded, expand the Information panel.
The panel shows information about:
- the nodes at either end of the link, and their status
- the inter-switch links that connect the nodes, and their status
- the endpoints of each link and their status.
- an action menu for the nodes, links, and endpoints within the information panel