Home page
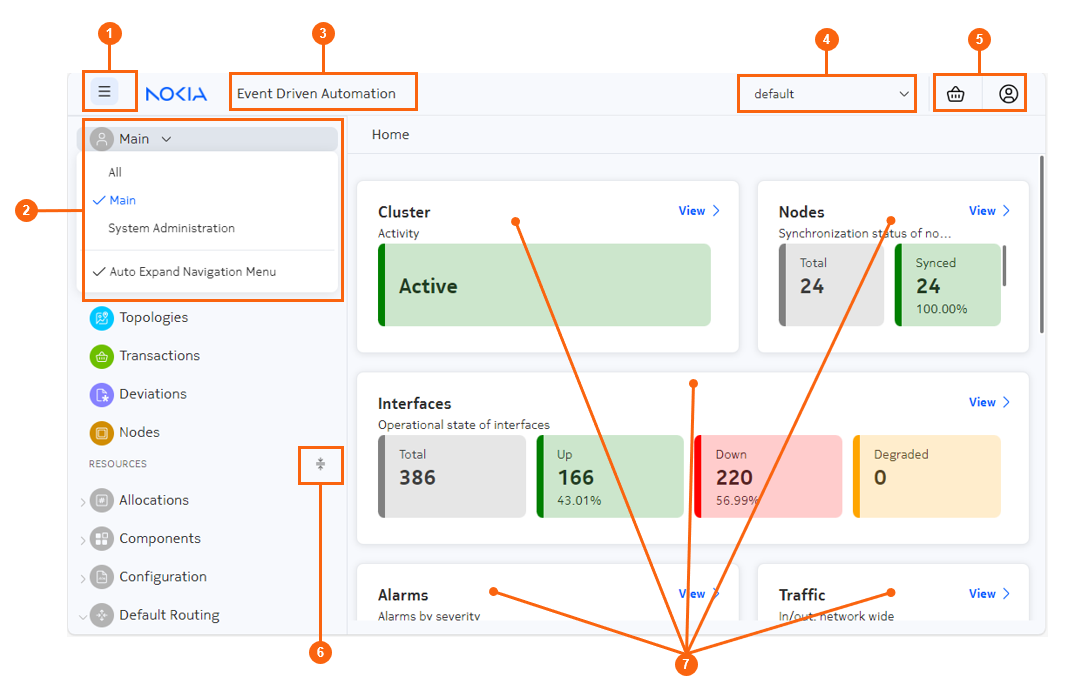
The EDA Home page is your first landing page for the EDA GUI. While some elements of the Home page are unique, it also includes a set of standard controls that are available from all pages within the EDA GUI.
| # | Name | Function |
|---|---|---|
| 1 | Menu pin/un-pin | Use this button to expand and pin, or collapse and hide, the main menu in the left column of the EDA GUI. |
| 2 | Menu selector | Use this drop-down selector to toggle between:
|
| 3 | Event Driven Automation Home button | Click here to navigate to, or re-load, the EDA Home page. |
| 4 | Namespace selector | Use this drop-down selector to choose a working namespace: either all namespaces, or one specific namespace. This selection affects the namespace from which to display data, and either create or manage resources. |
| 5 | Common buttons |
|
| 6 | Menu heading expand/collapse toggle | Click this control to alternately expand all headings or collapse all headings in the main navigation menu. |
| 7 | Panels | Each panel displays important information about the status of the EDA
application and the network it is managing. Clicking the View link in any panel opens the EDA GUI page specific to that panel's information. |
Default Home page panels
Note: All panels are "live"; they continuously update to show the
latest data.
- Cluster: the current cluster and status.
- Nodes: displays the synchronization state of the nodes known to EDA (total nodes; synced nodes; unsynced nodes).
- Interfaces: displays the operational state of the interfaces known to EDA (total interfaces, Up interfaces; Down interfaces).
- Alarms: displays the number of current alarms, and their percentage distribution by alarm type.
- Traffic: displays total inbound and outbound traffic for the network as a whole.
- Top interfaces - In: displays the five interfaces exhibiting the most incoming traffic.
- Top interfaces - Out: displays the five interfaces exhibiting the most outgoing traffic.